Download to read offline
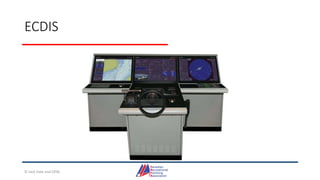
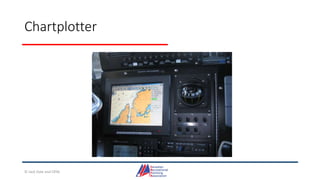
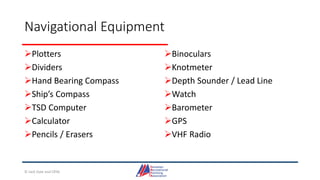
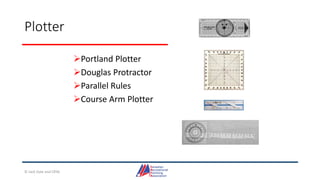
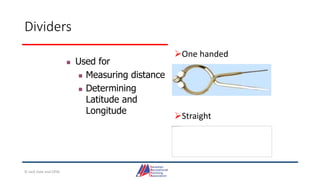
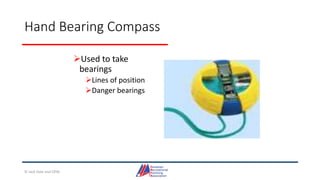
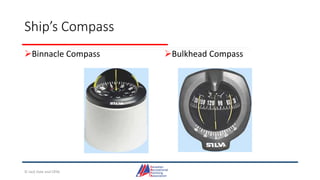
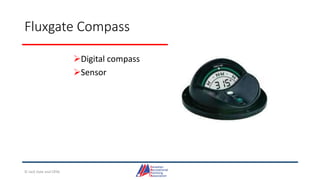

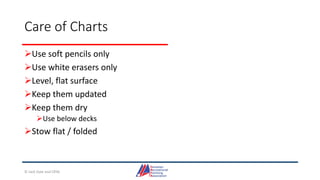
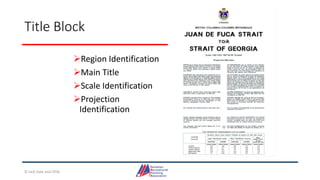
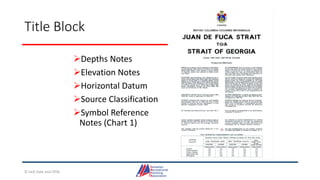
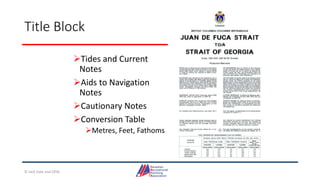
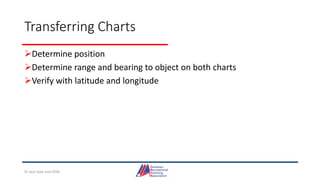
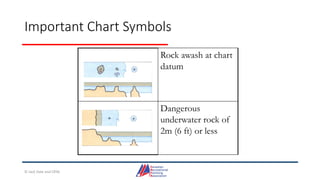
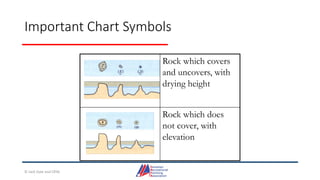
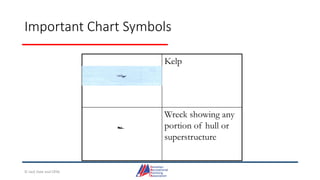
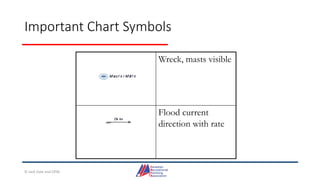
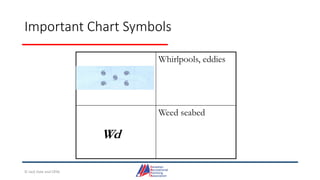
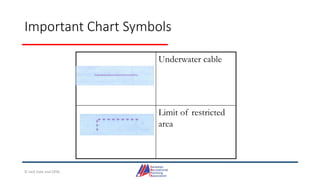
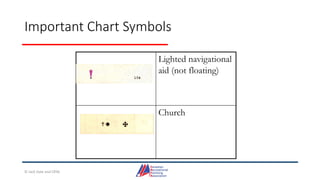
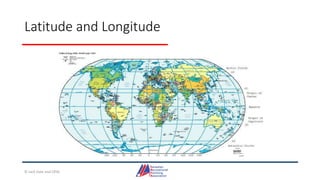
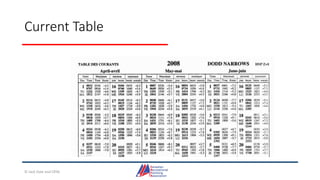
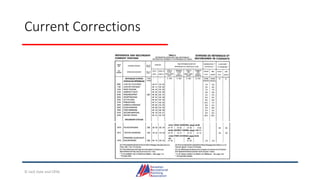
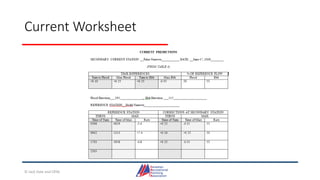
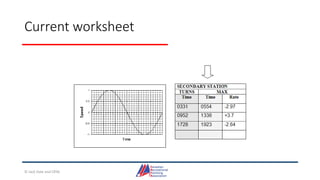
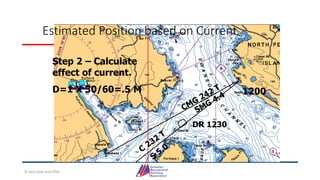

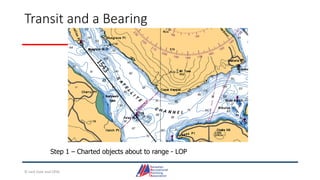
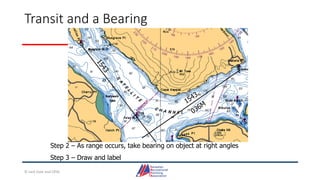
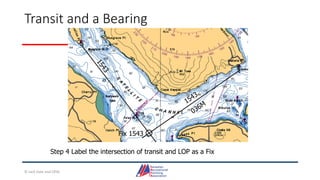
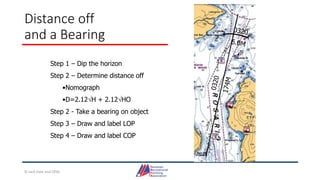


This document provides information about coastal navigation, including: - The requirements to carry official charts and keep them updated according to Canadian regulations. Paper charts meet these requirements, as do some digital charts if used with the proper systems. - An overview of tools and publications used for coastal navigation, such as plotters, compasses, tide tables, and nautical charts. - Details on reading and interpreting nautical charts, including title blocks, symbols, depth notation, and latitude and longitude coordinates. The document explains chart projections and how to transfer positions between charts.


