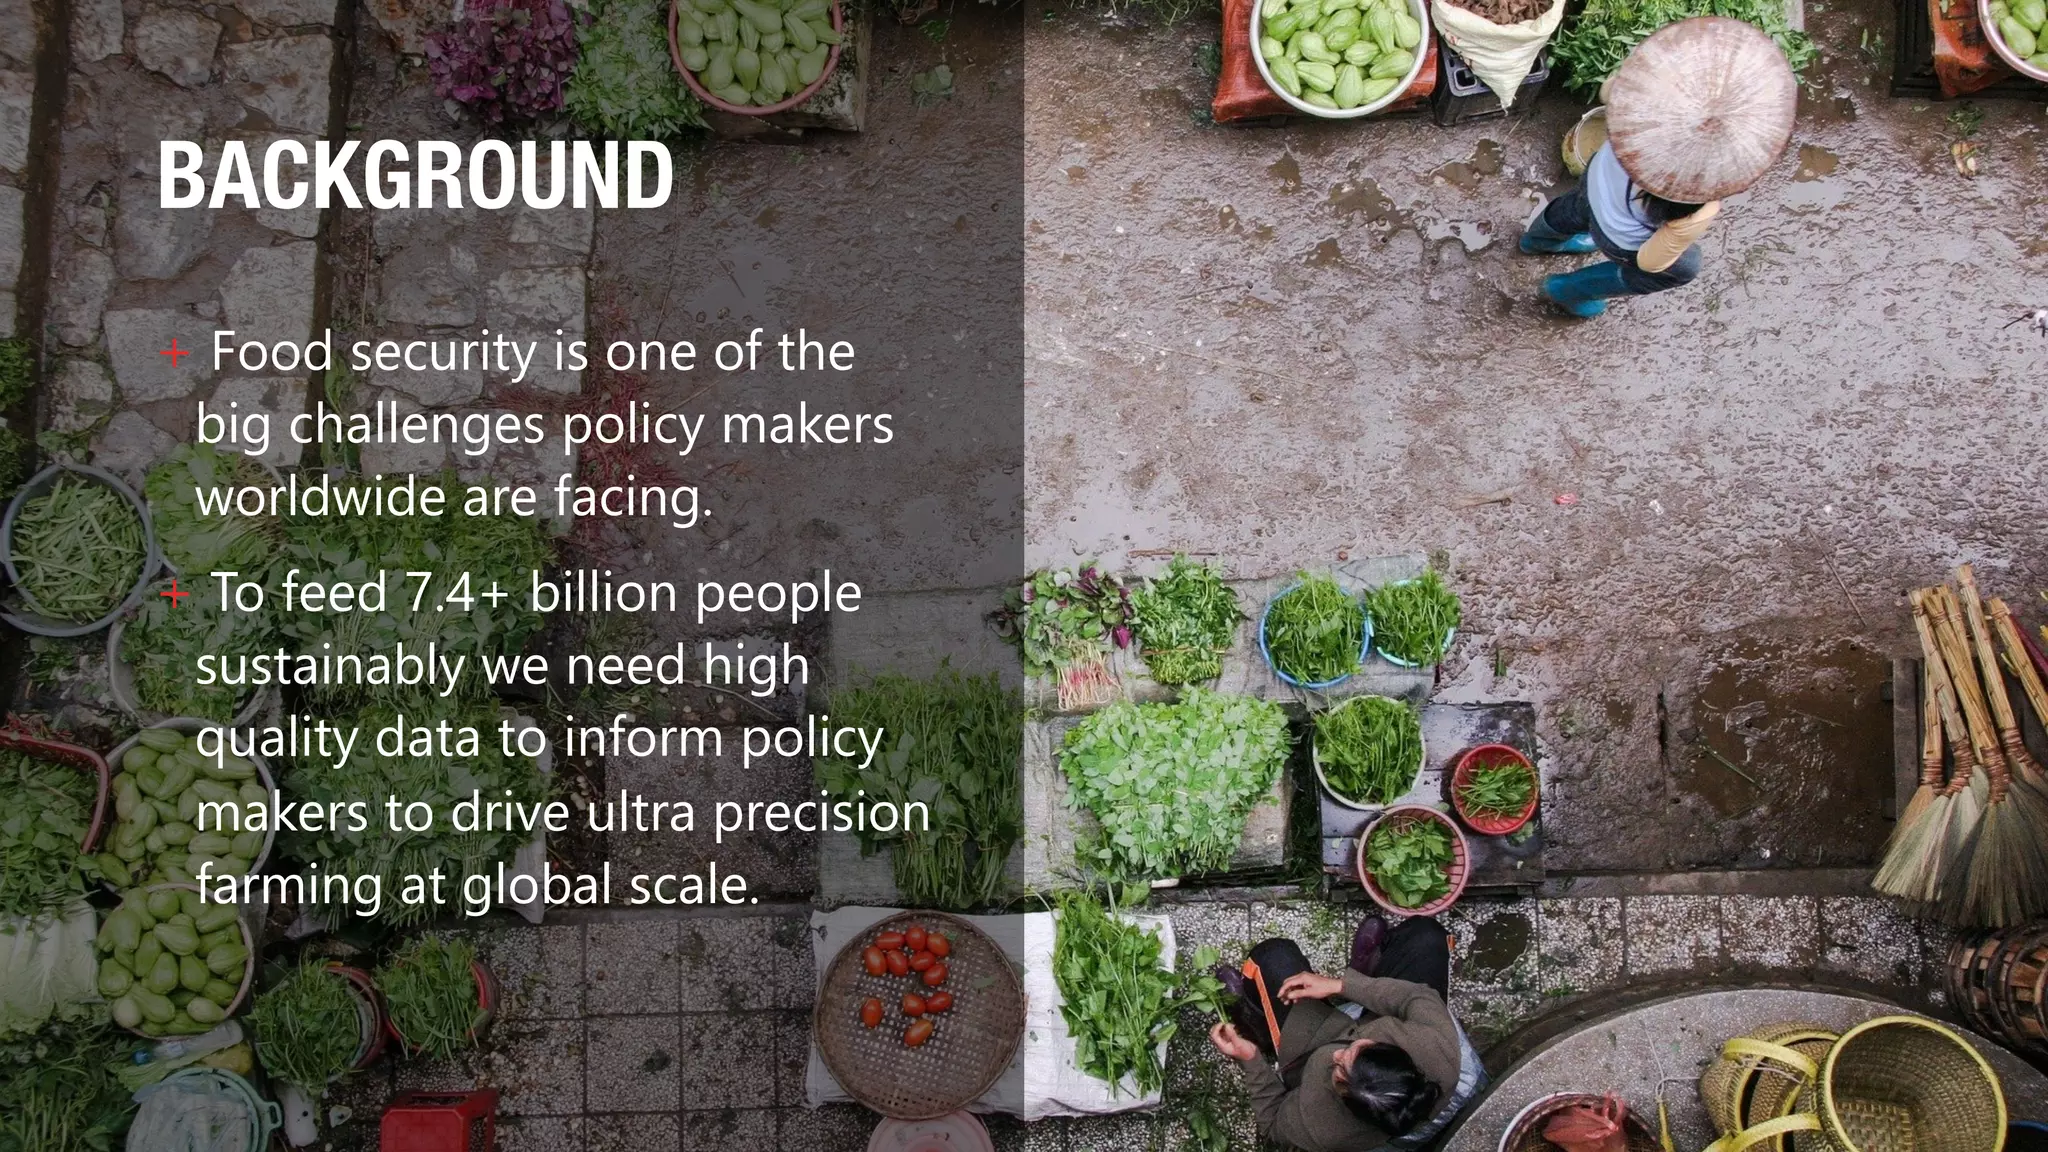
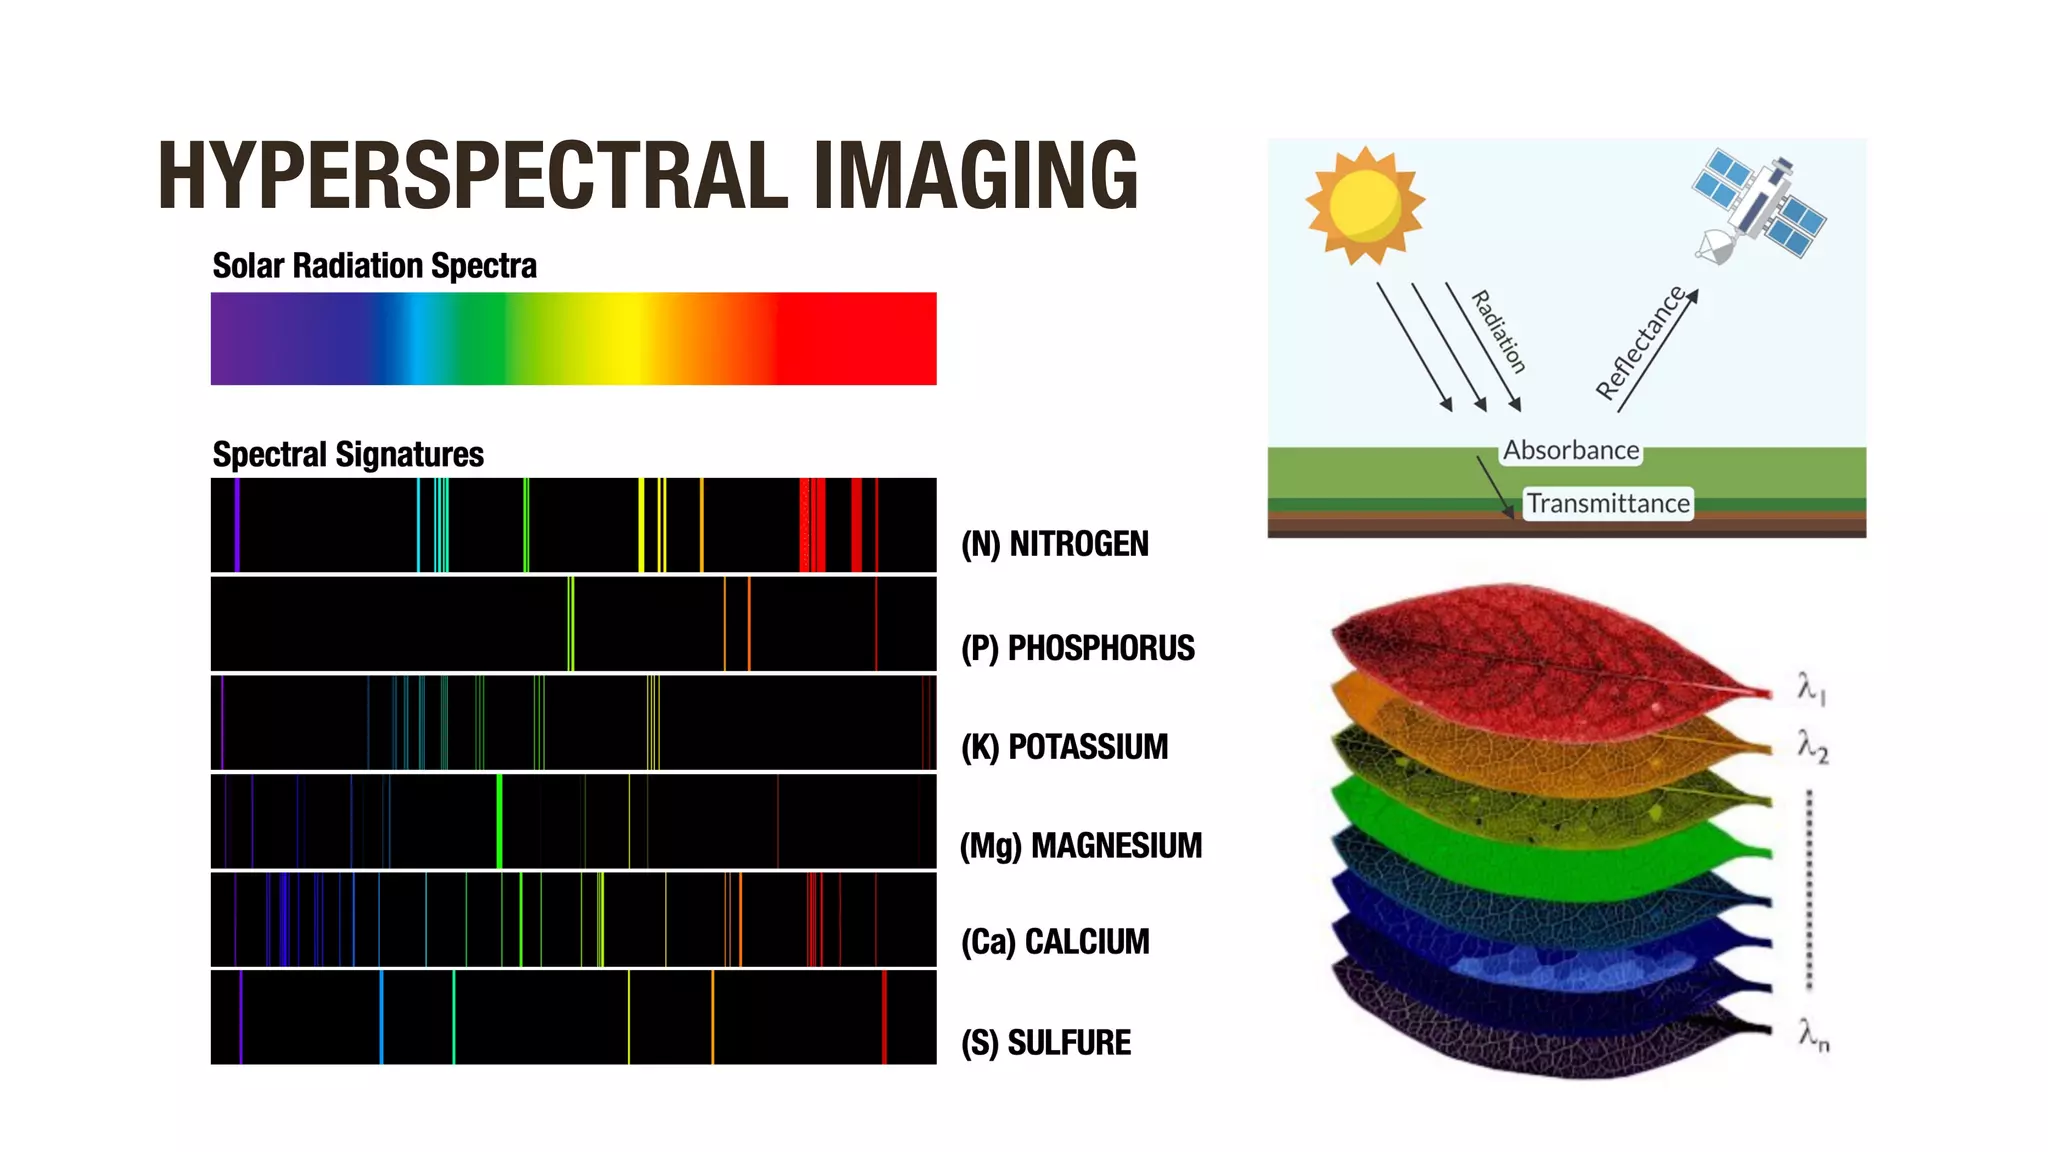
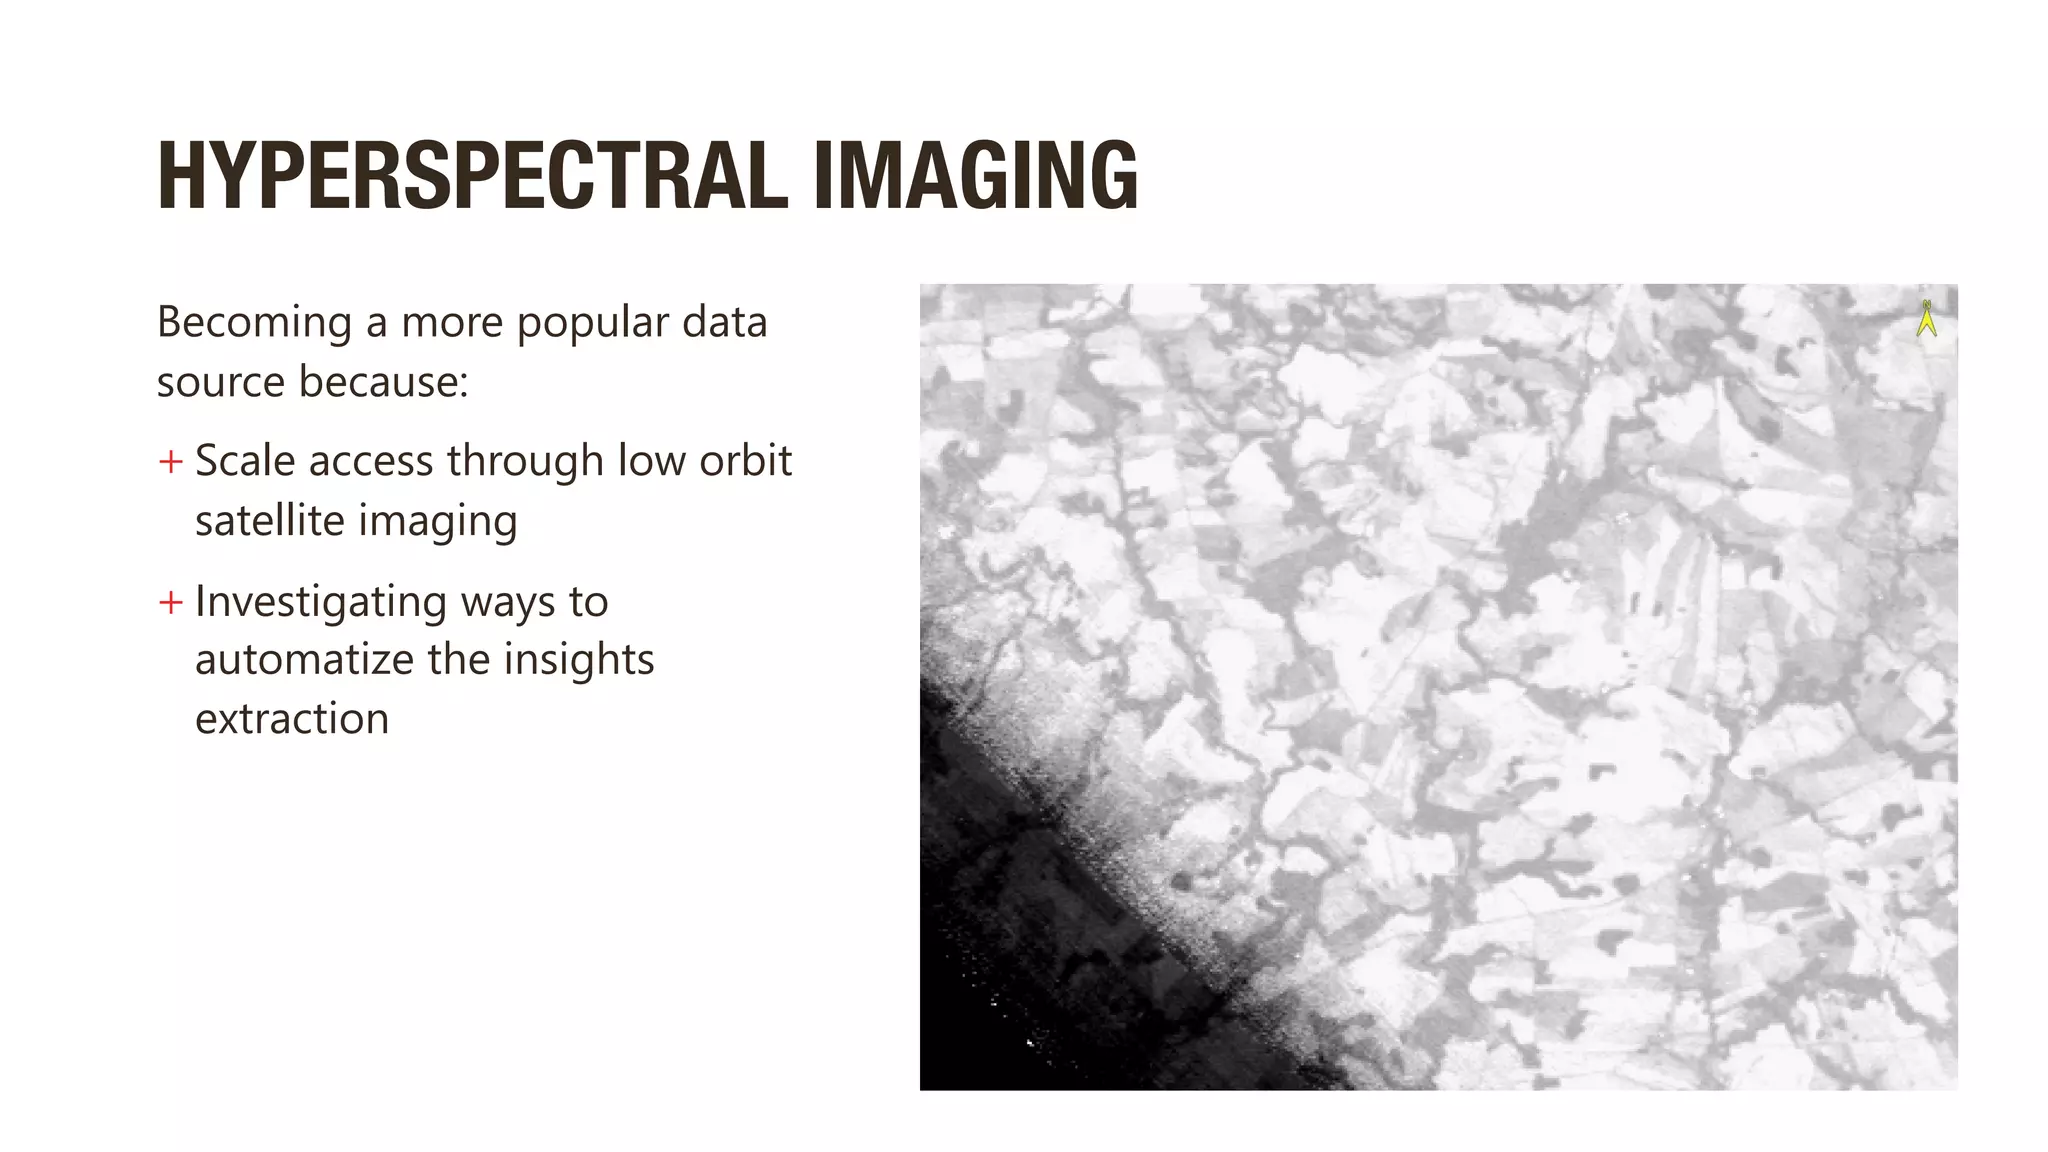
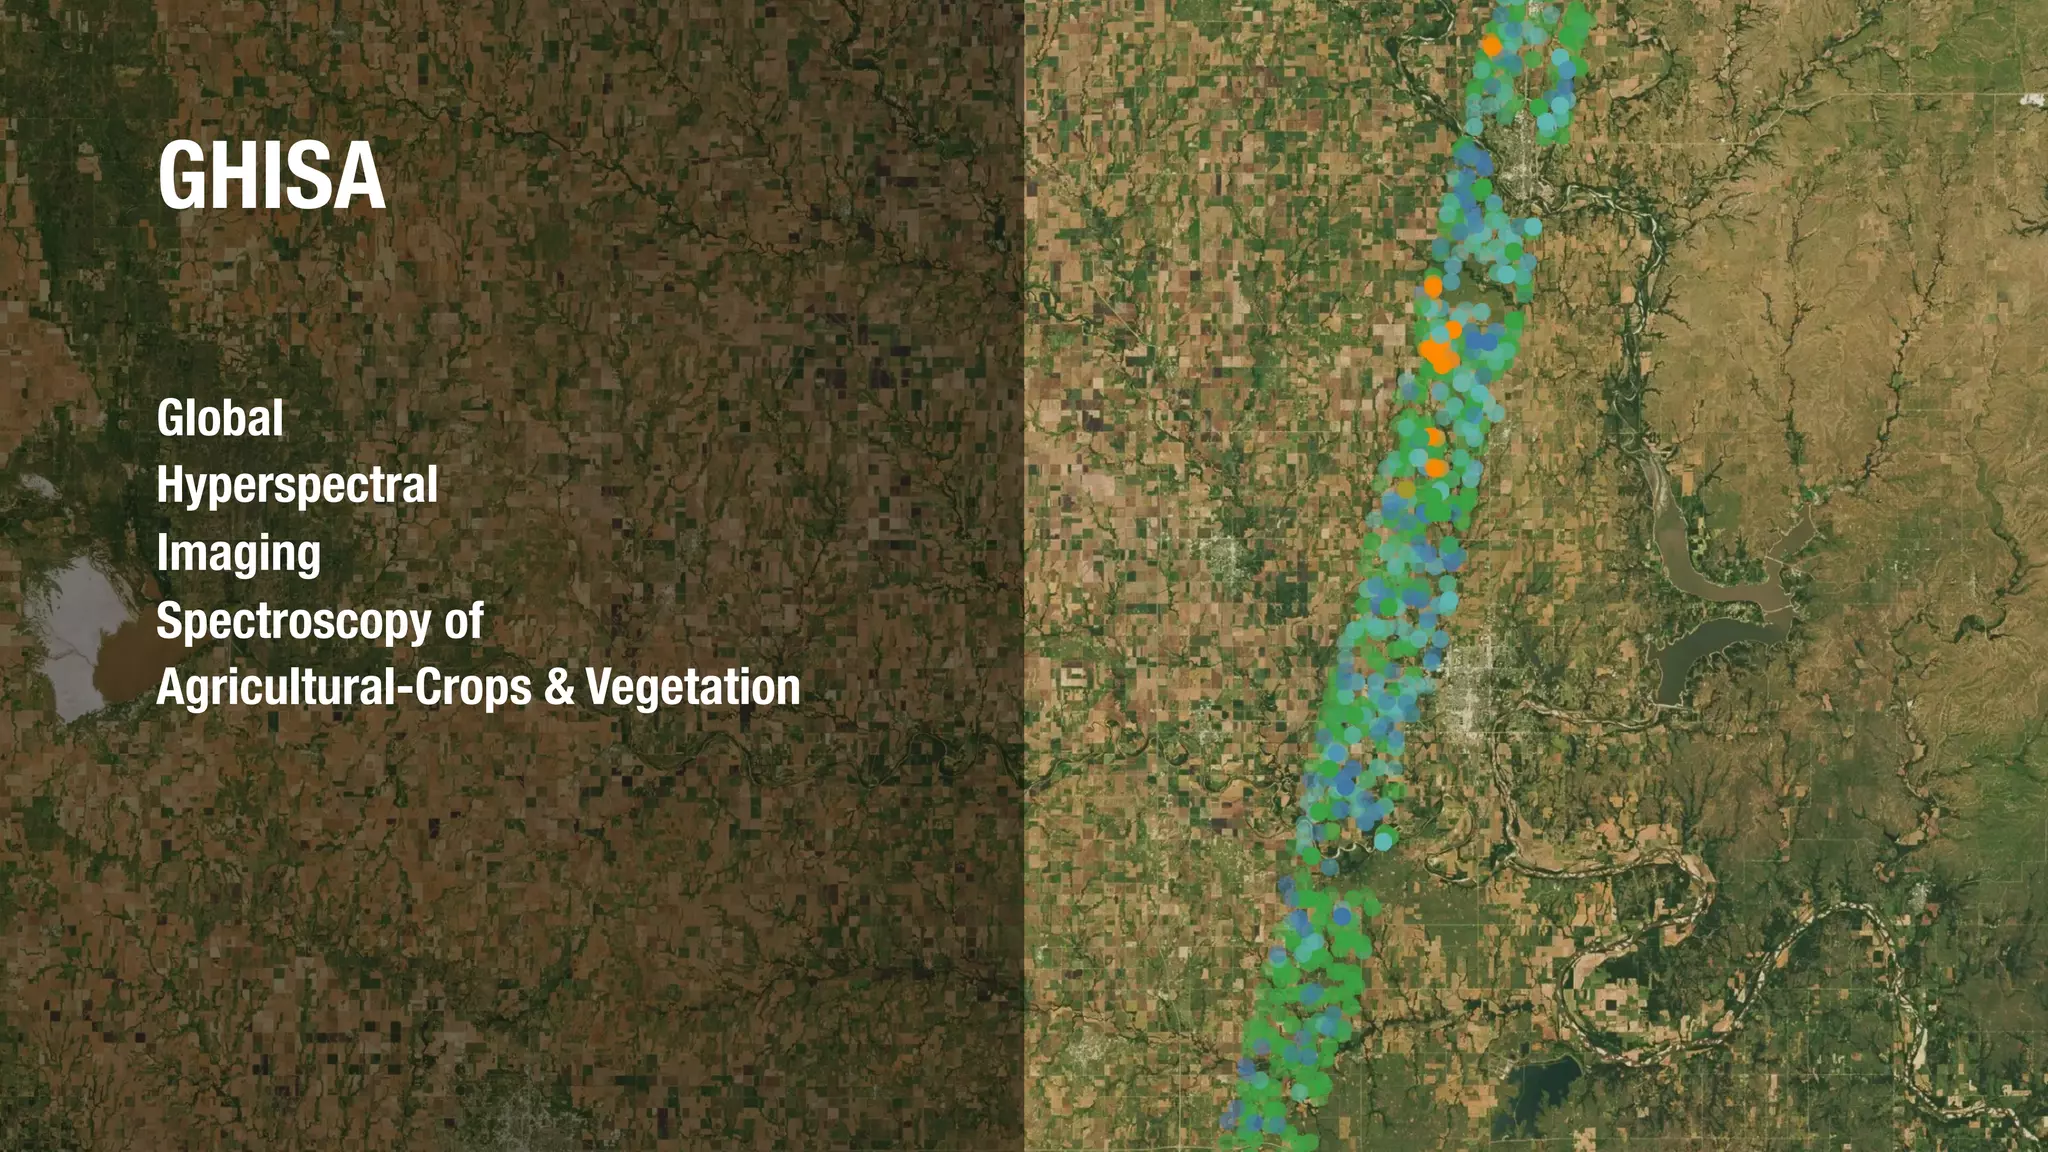
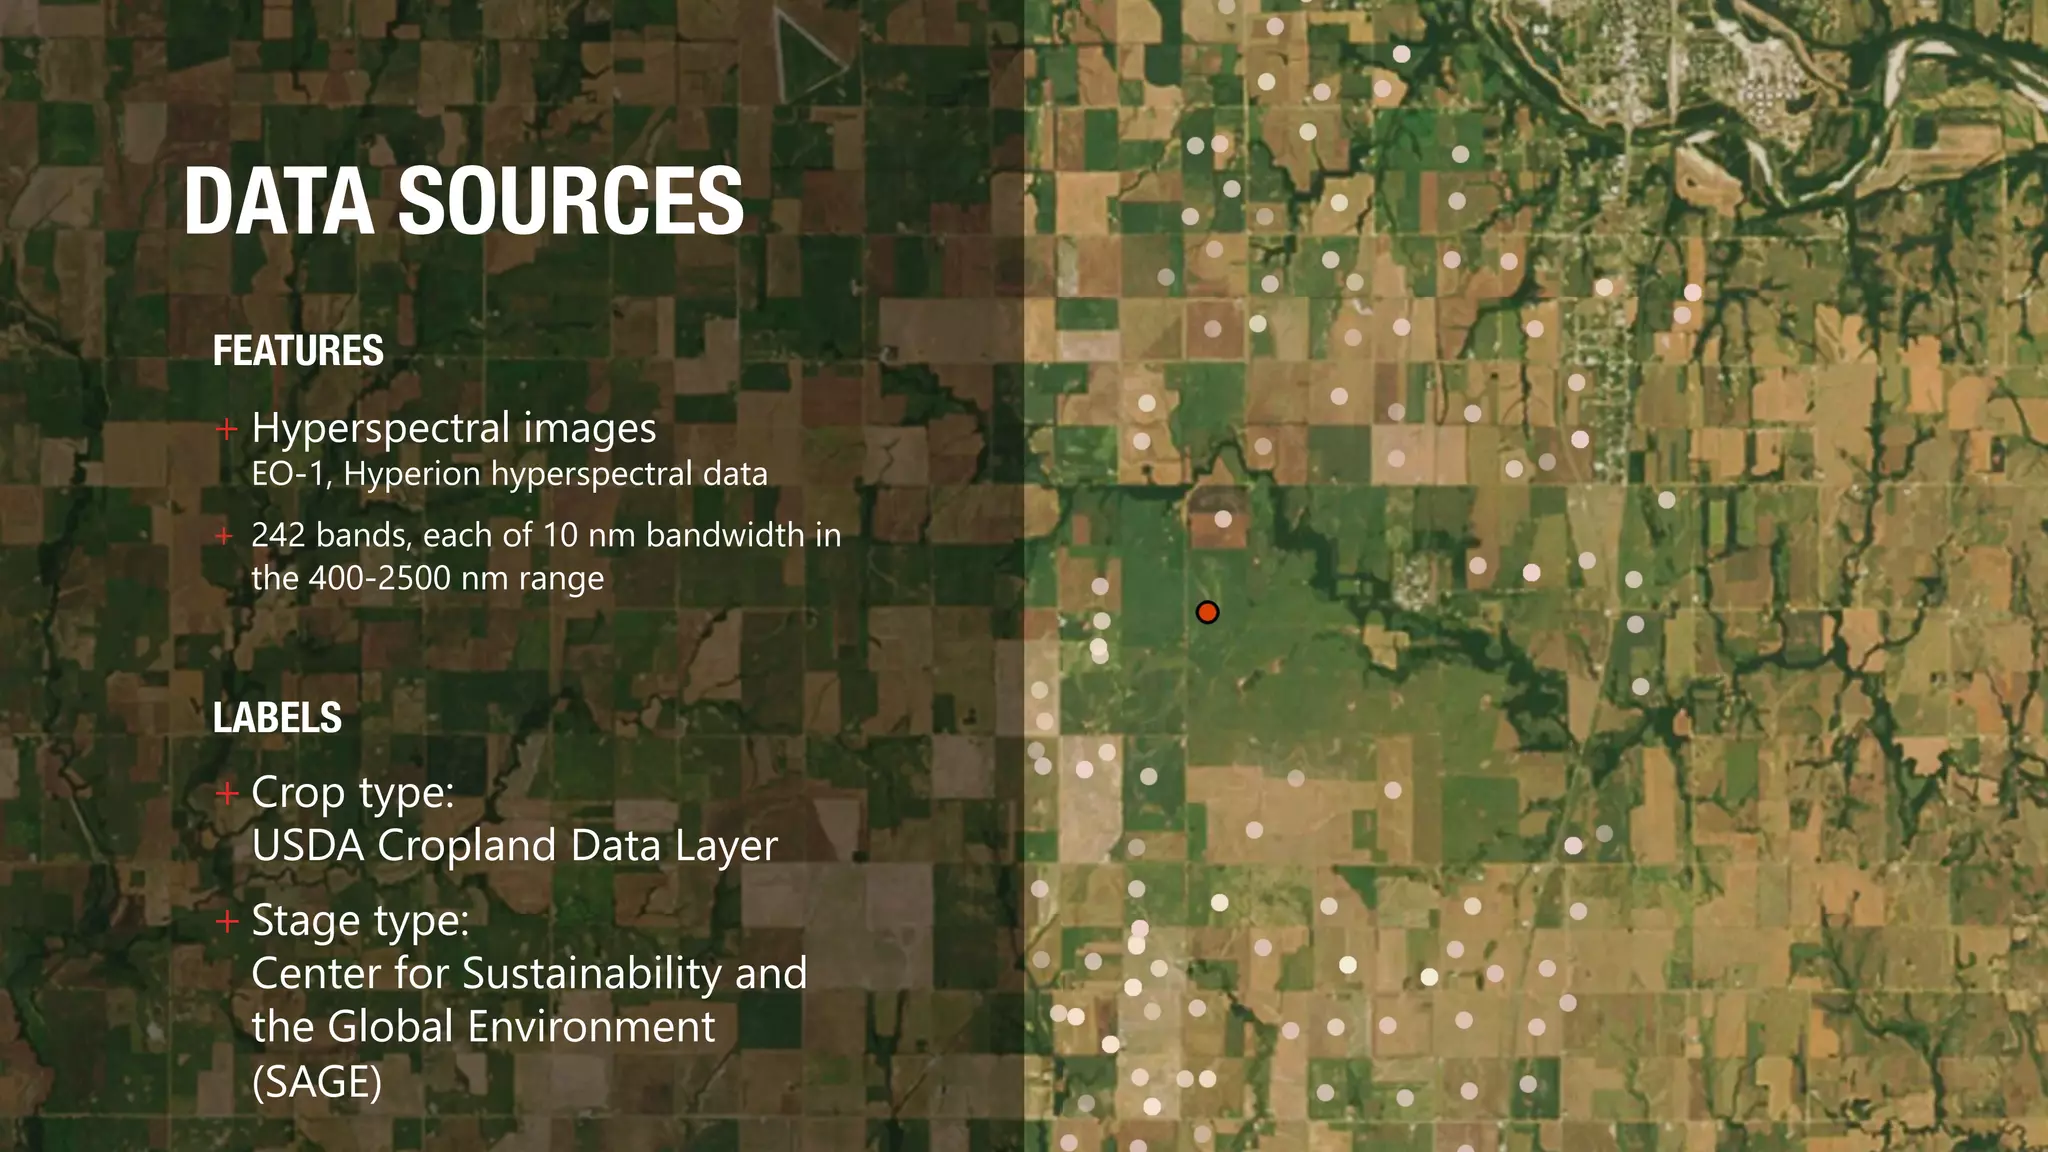
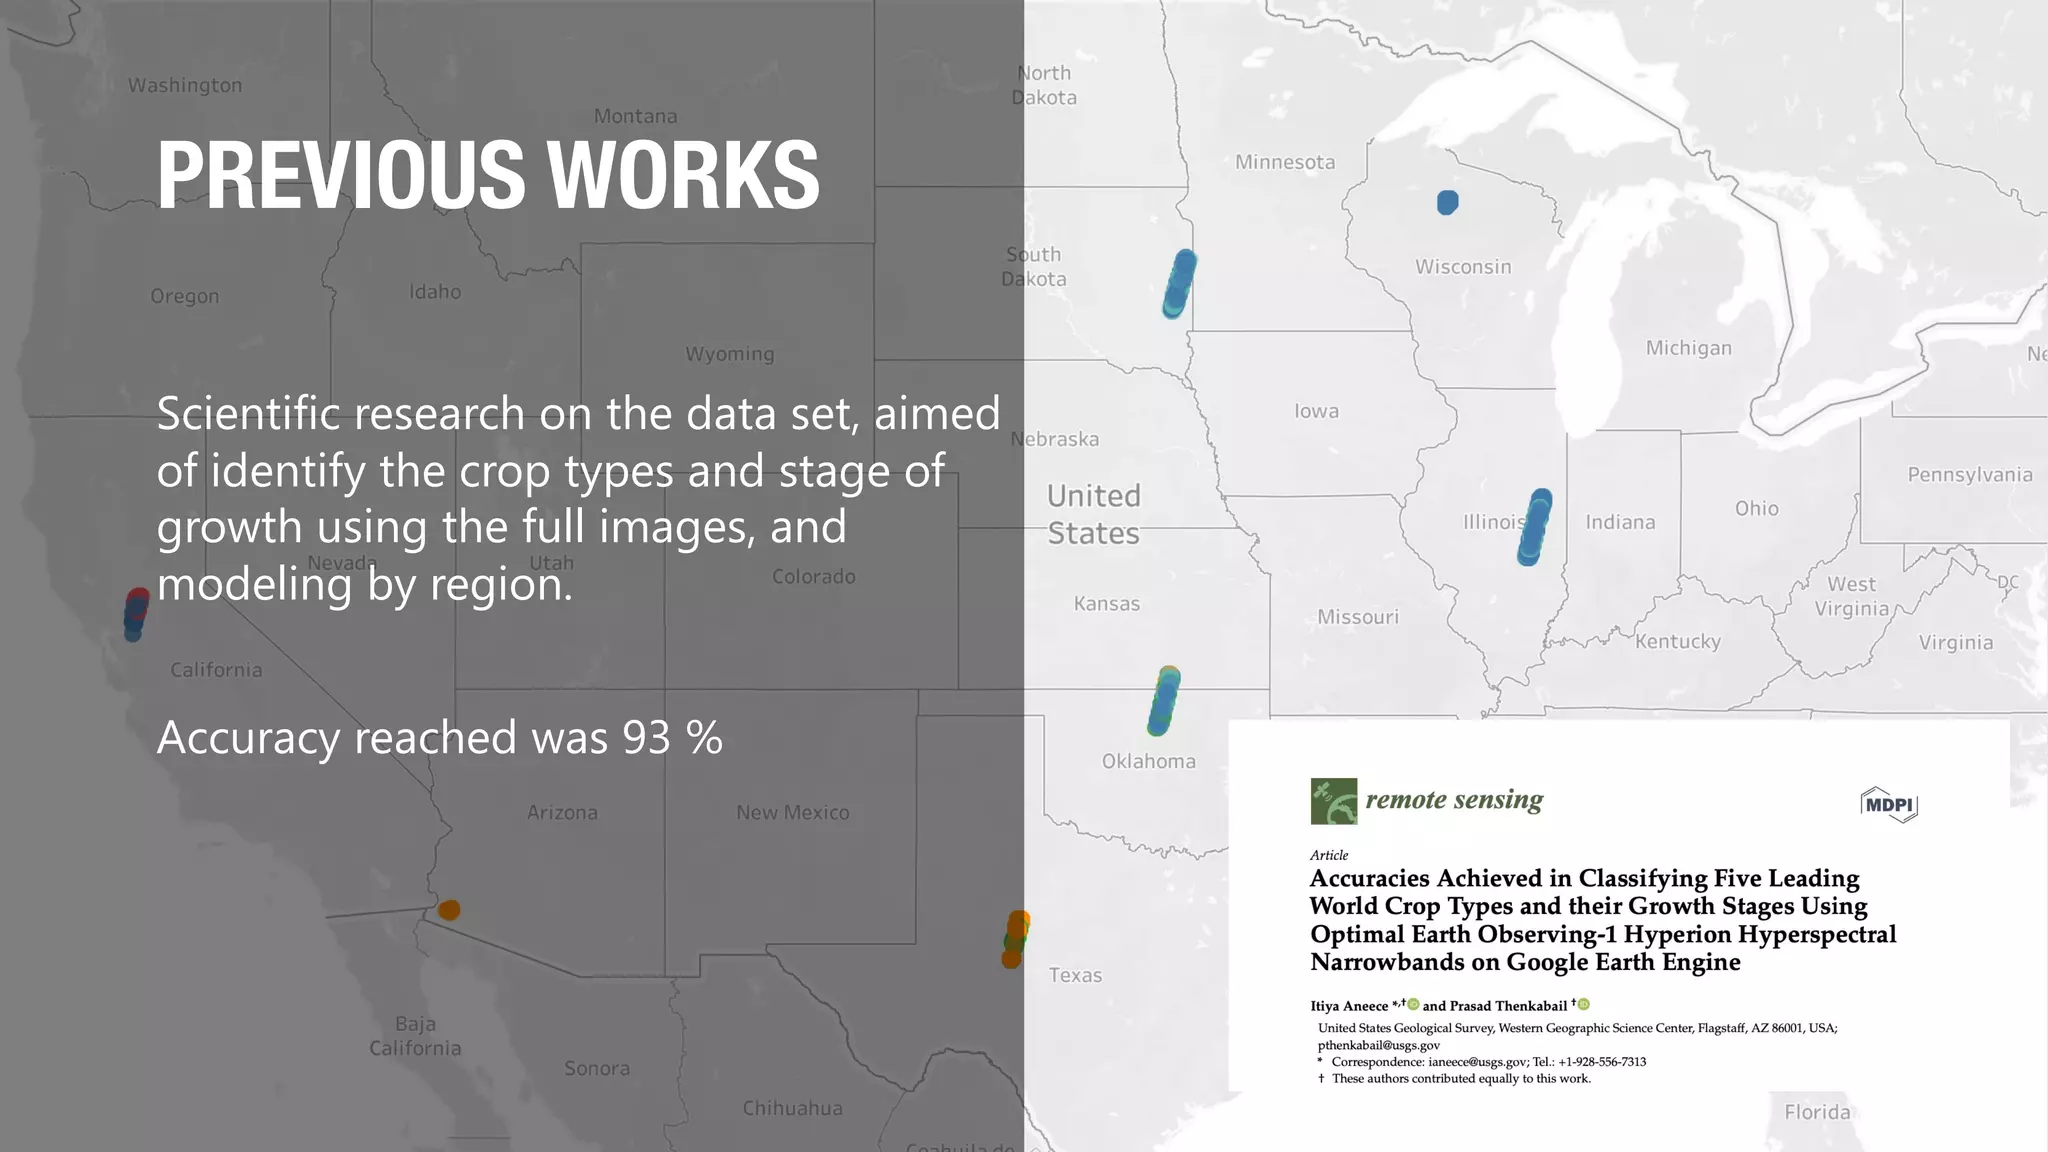
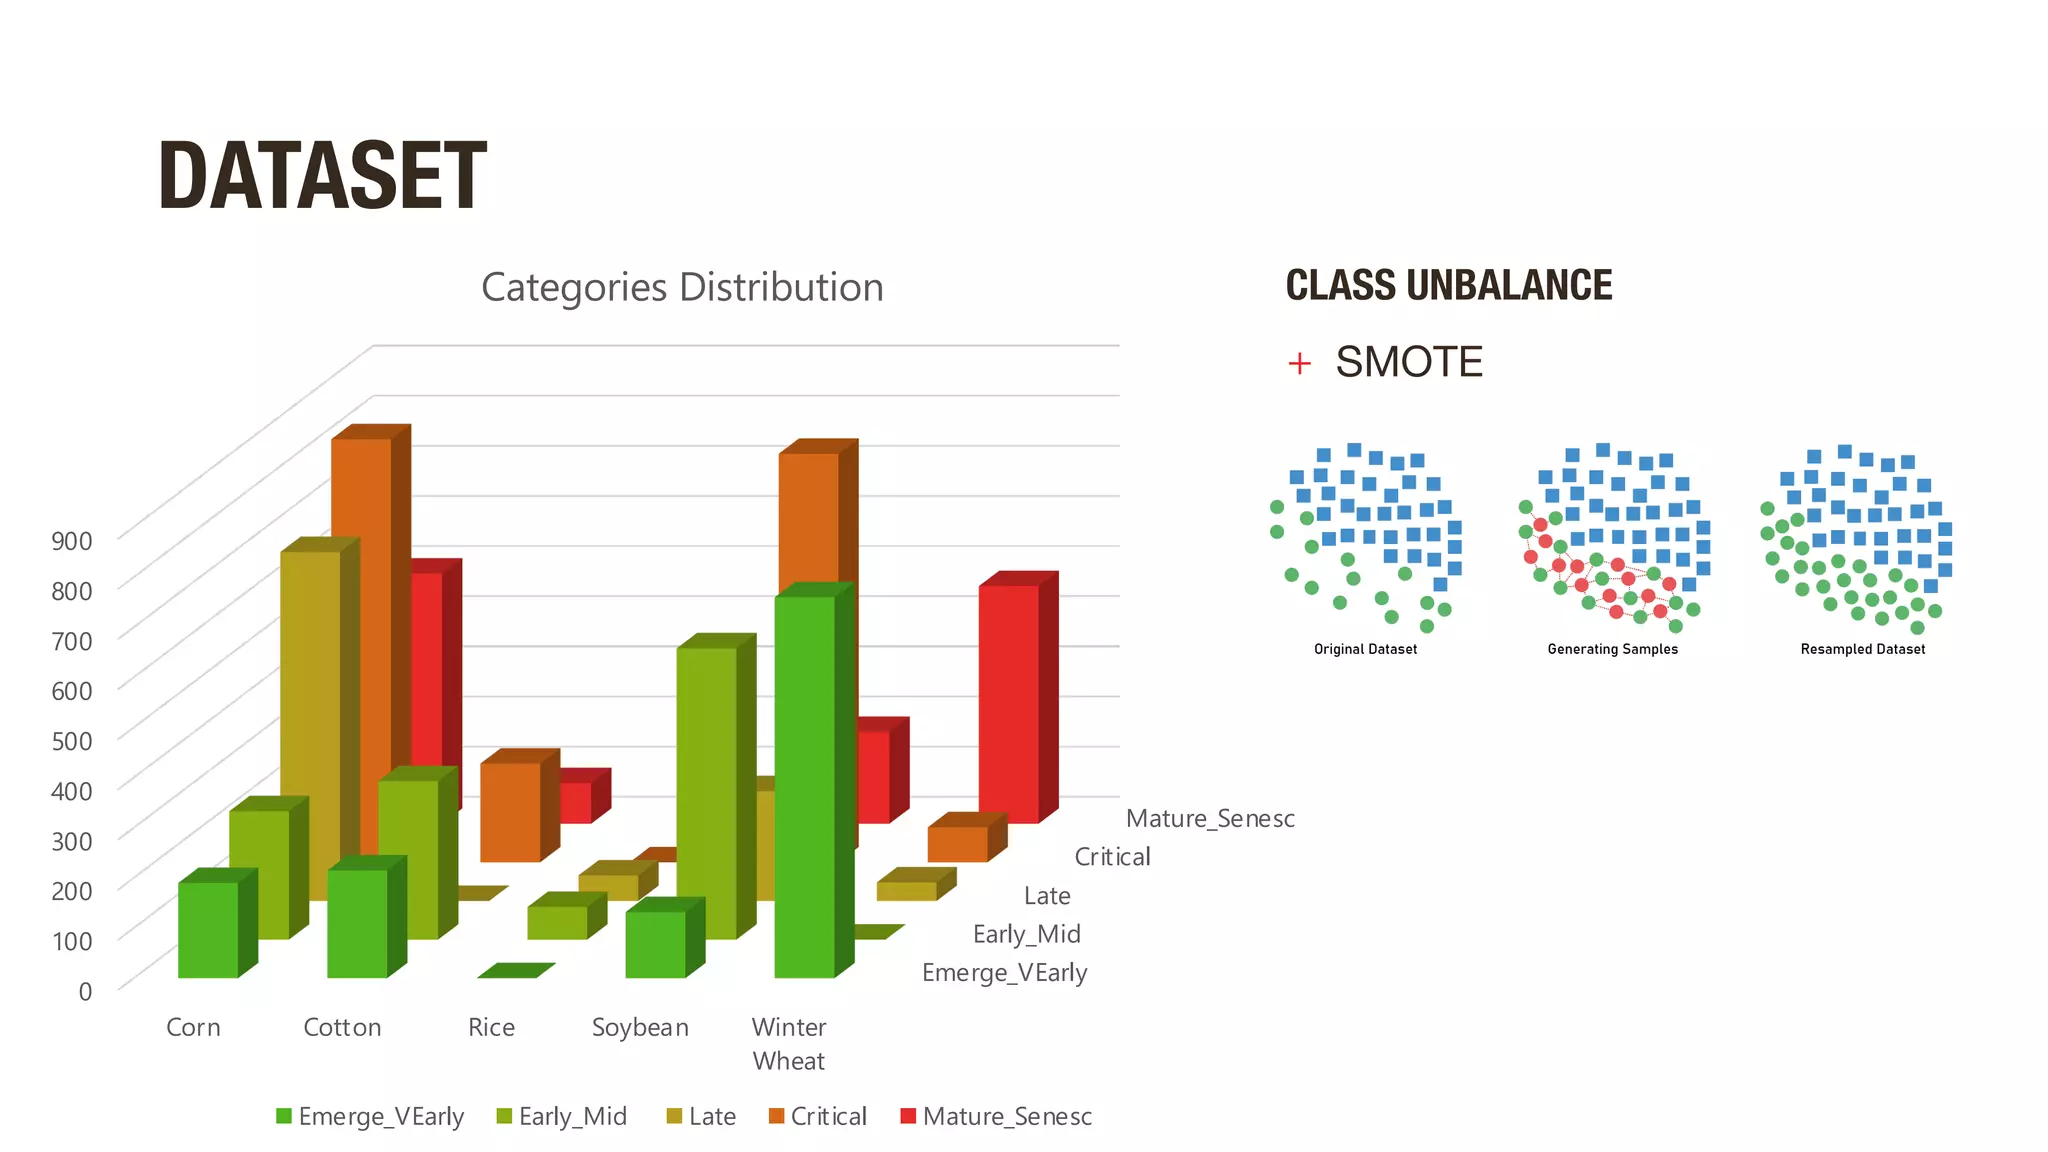
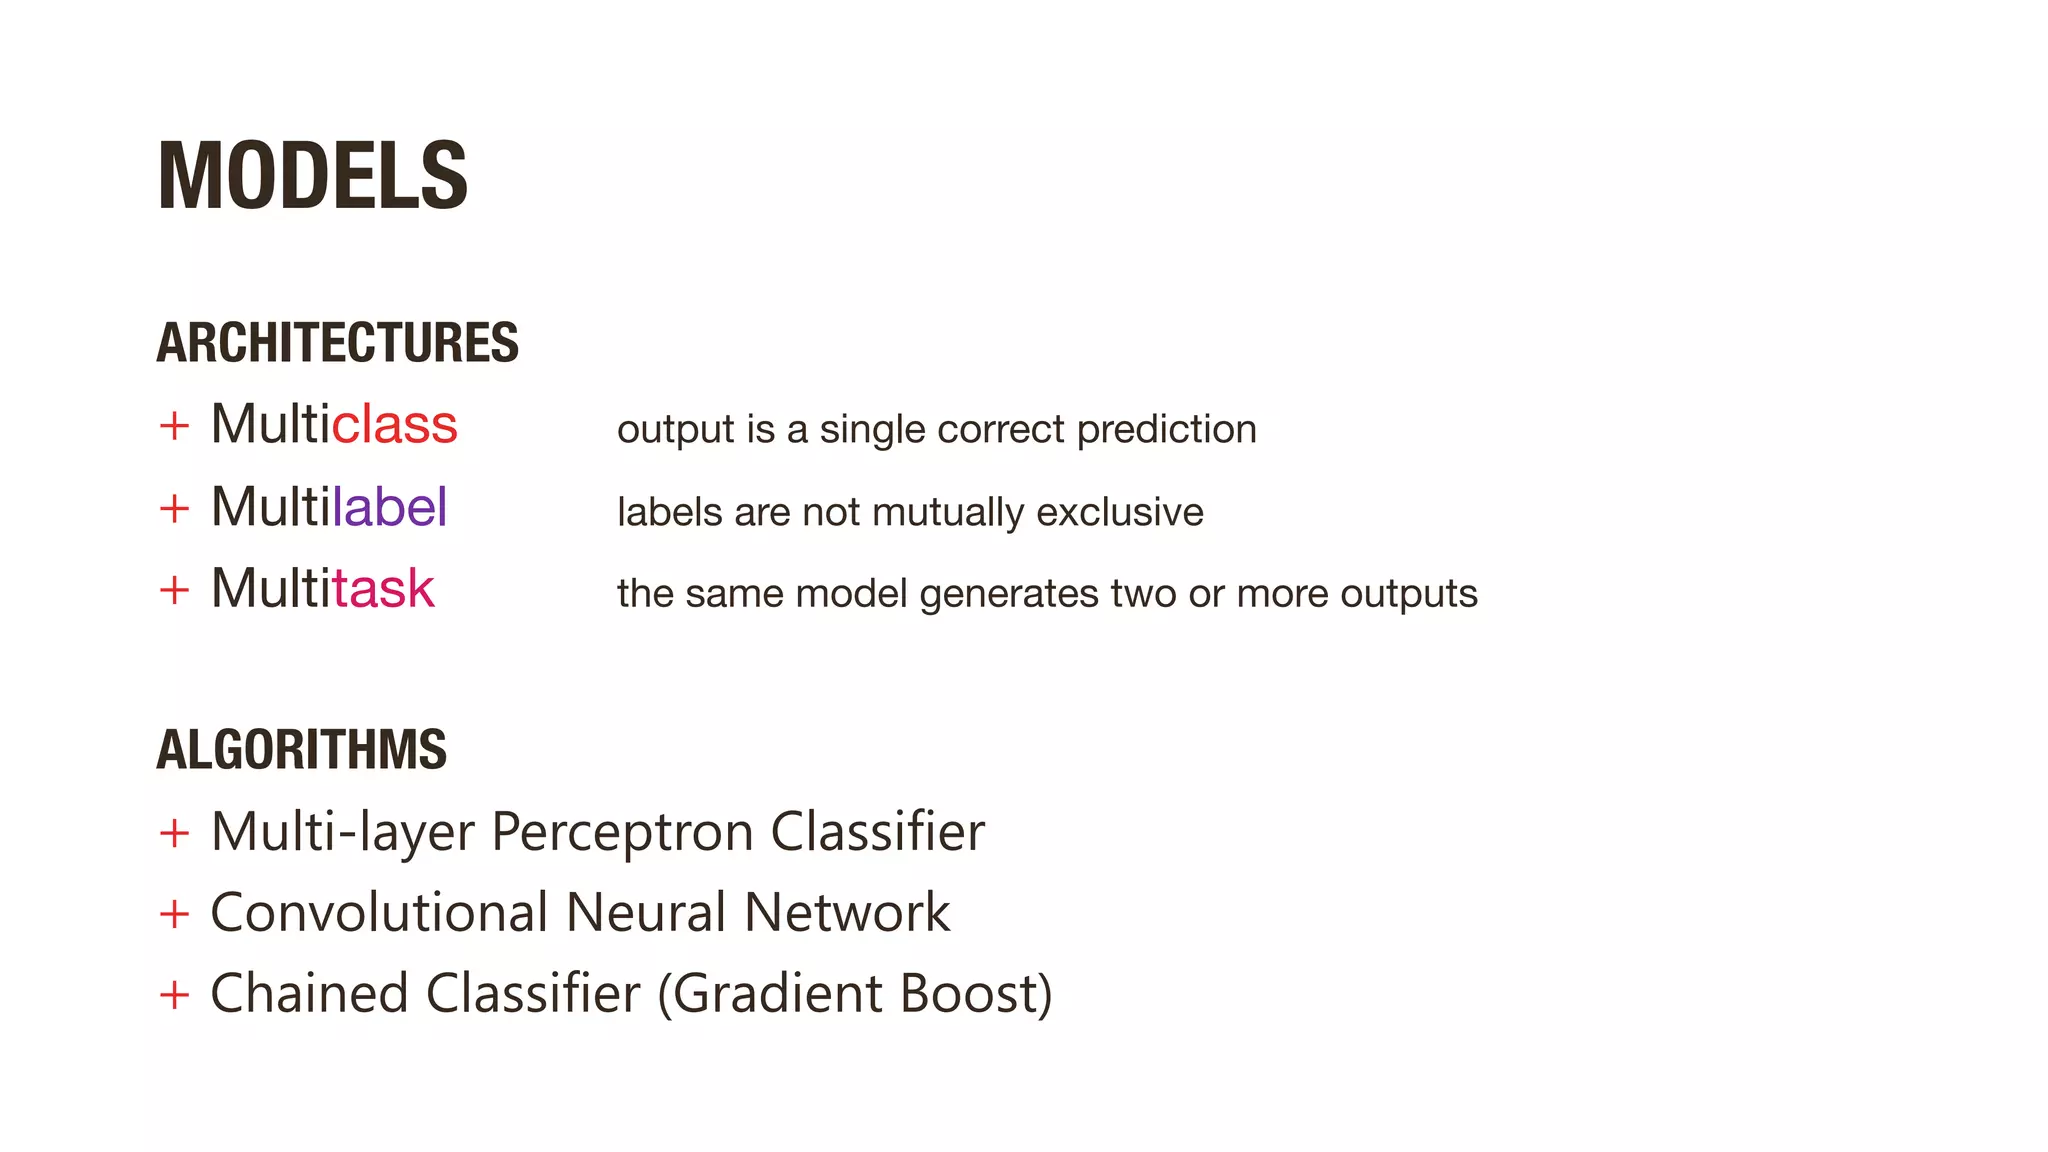
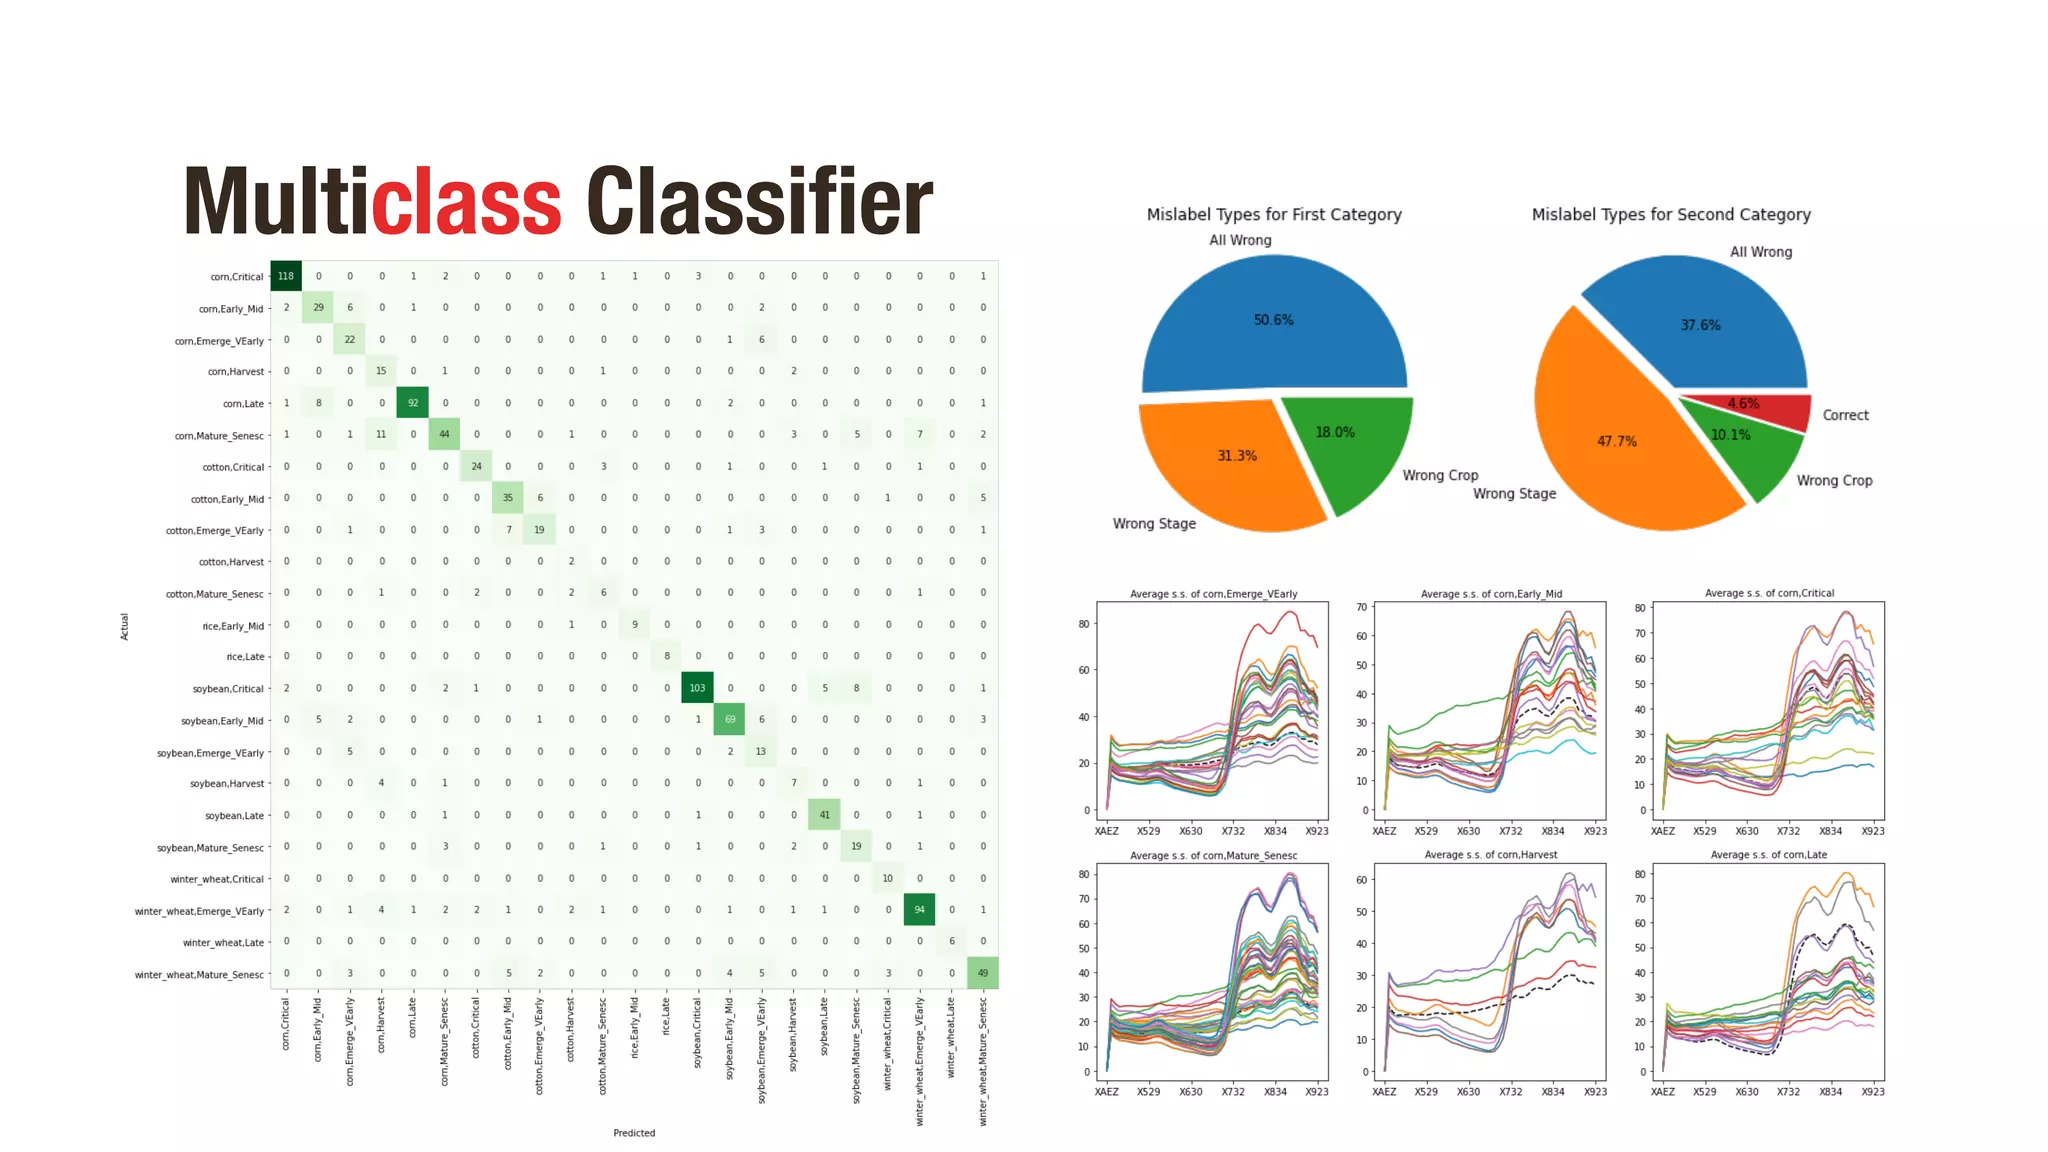
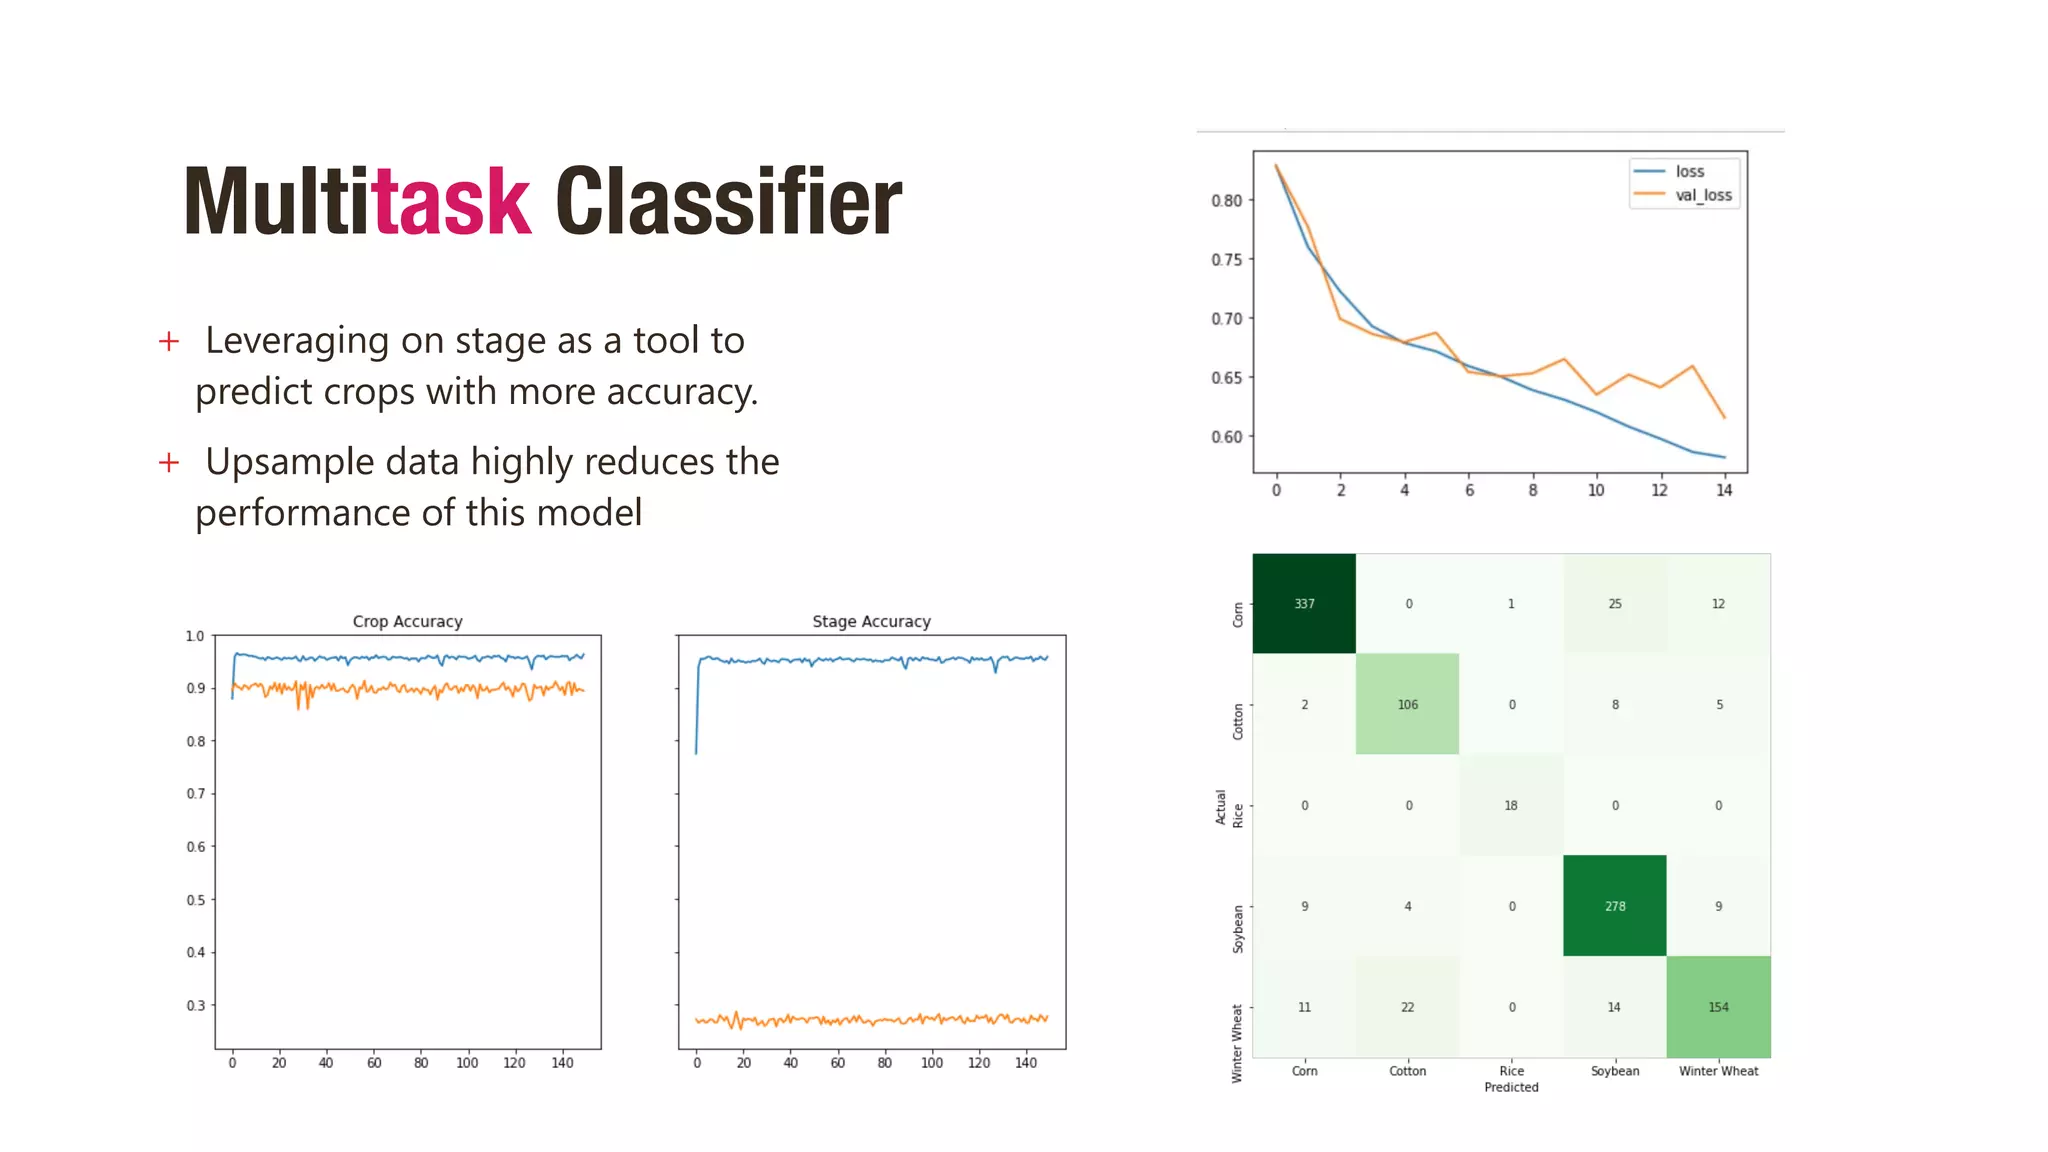
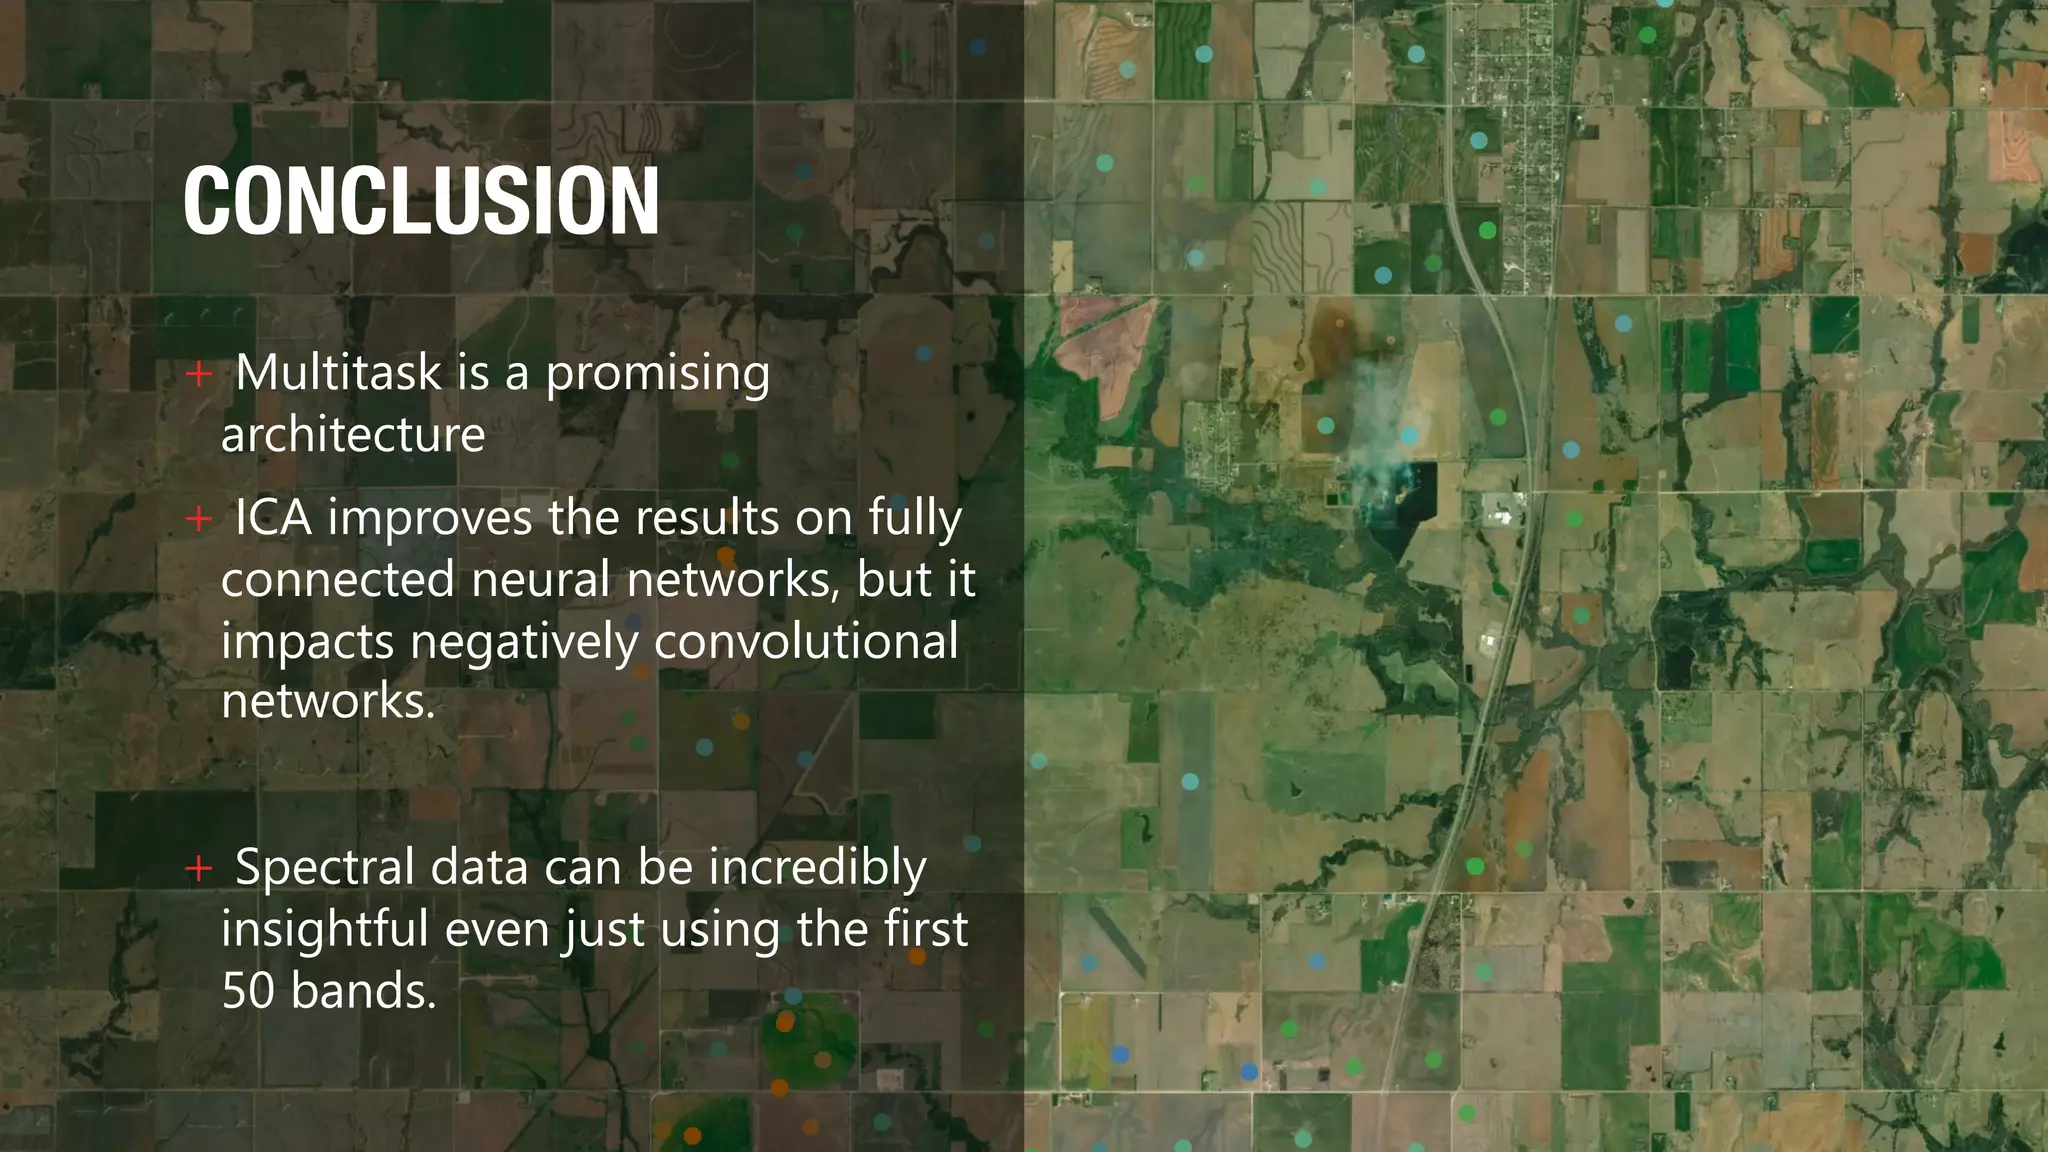
This document discusses using hyperspectral imaging and machine learning to classify crop types and growth stages from their spectral signatures in order to help address global food security issues. It presents research using a dataset containing hyperspectral images and labels of crop type and stage. Various machine learning models are tested for crop and stage classification, including multiclass, multilabel, chained, and multitask classifiers. The multitask classifier that jointly predicts crop type and stage achieved the best results, though upsampling data reduced its performance. Further improvements could come from analyzing larger geographic datasets and combining strengths of different model types.


![Predictions
Target
Multiclass Classifier
(Crop + Stage)
[0]
[…]
[23]
Input
X437
…
…
…
…
X923
[0, … 1, 0]
…
…
…
…
[0, 0, … 1]
Length = 23
Dense
Output
Activation = SoftMax
Loss = Binary Cross Entropy
Input Layer
SCORES
Balanced Accuracy score 79 %
Accuracy score 80 %](https://image.slidesharecdn.com/presentation-210326022923/75/CROP-PHENOTYPING-THROUGH-SPECTRAL-CLASSIFICATION-14-2048.jpg)
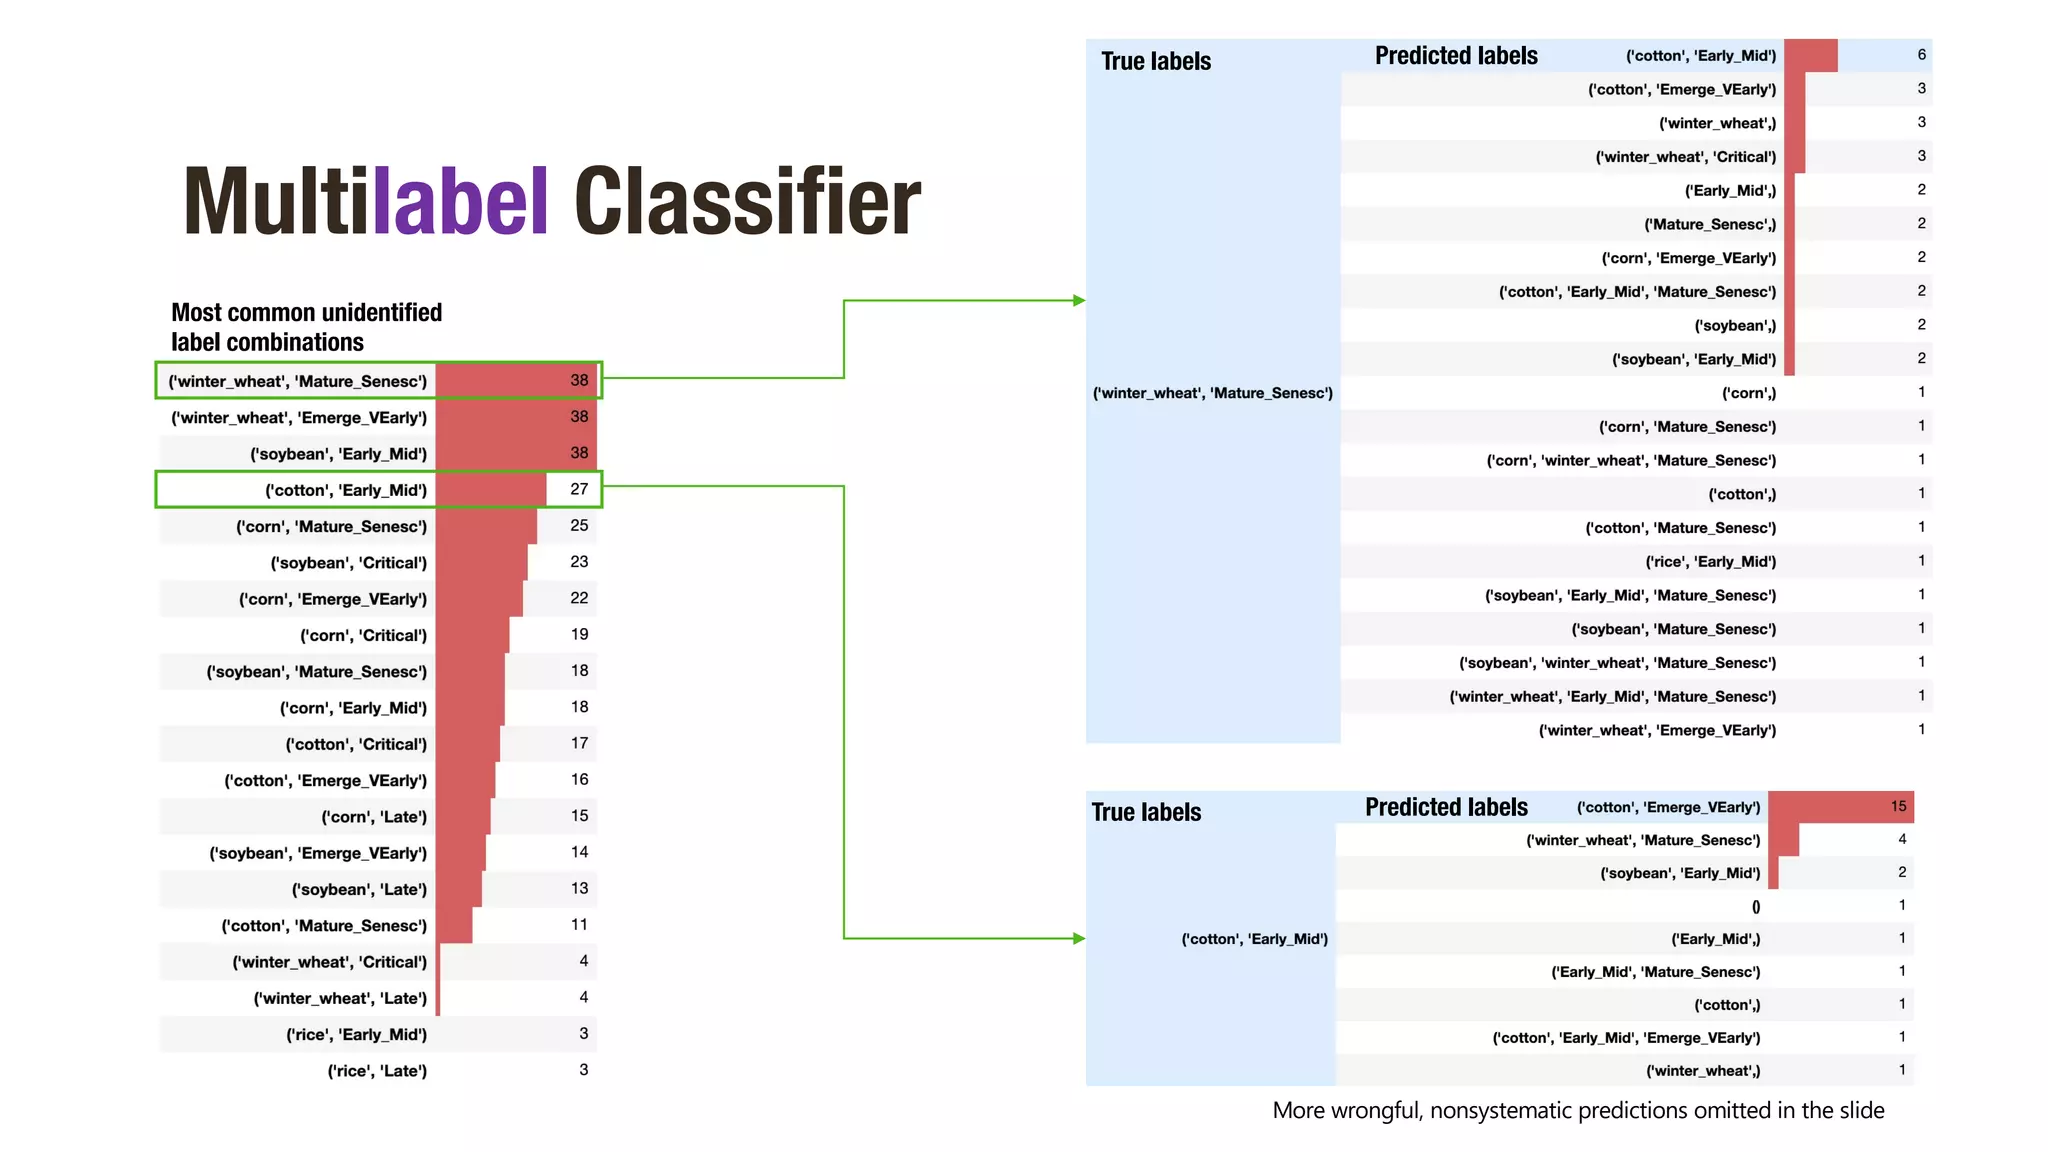
![Predictions
Target
Multilabel Classifier
Crop & Stage
[0]
[…]
[10]
[1, … 1, 0]
…
…
…
…
[0, 0, … 1]
length = 10
1dConvolutional
+
1dMaxpooling
Dense
Flatten
Input
(50, 1)
X437
…
…
X923
Output
Activation = Sigmoid
Loss = Categorical Cross Entropy
SCORES
Balanced Accuracy score 81.2 %
Accuracy score 83.1 %](https://image.slidesharecdn.com/presentation-210326022923/75/CROP-PHENOTYPING-THROUGH-SPECTRAL-CLASSIFICATION-16-2048.jpg)
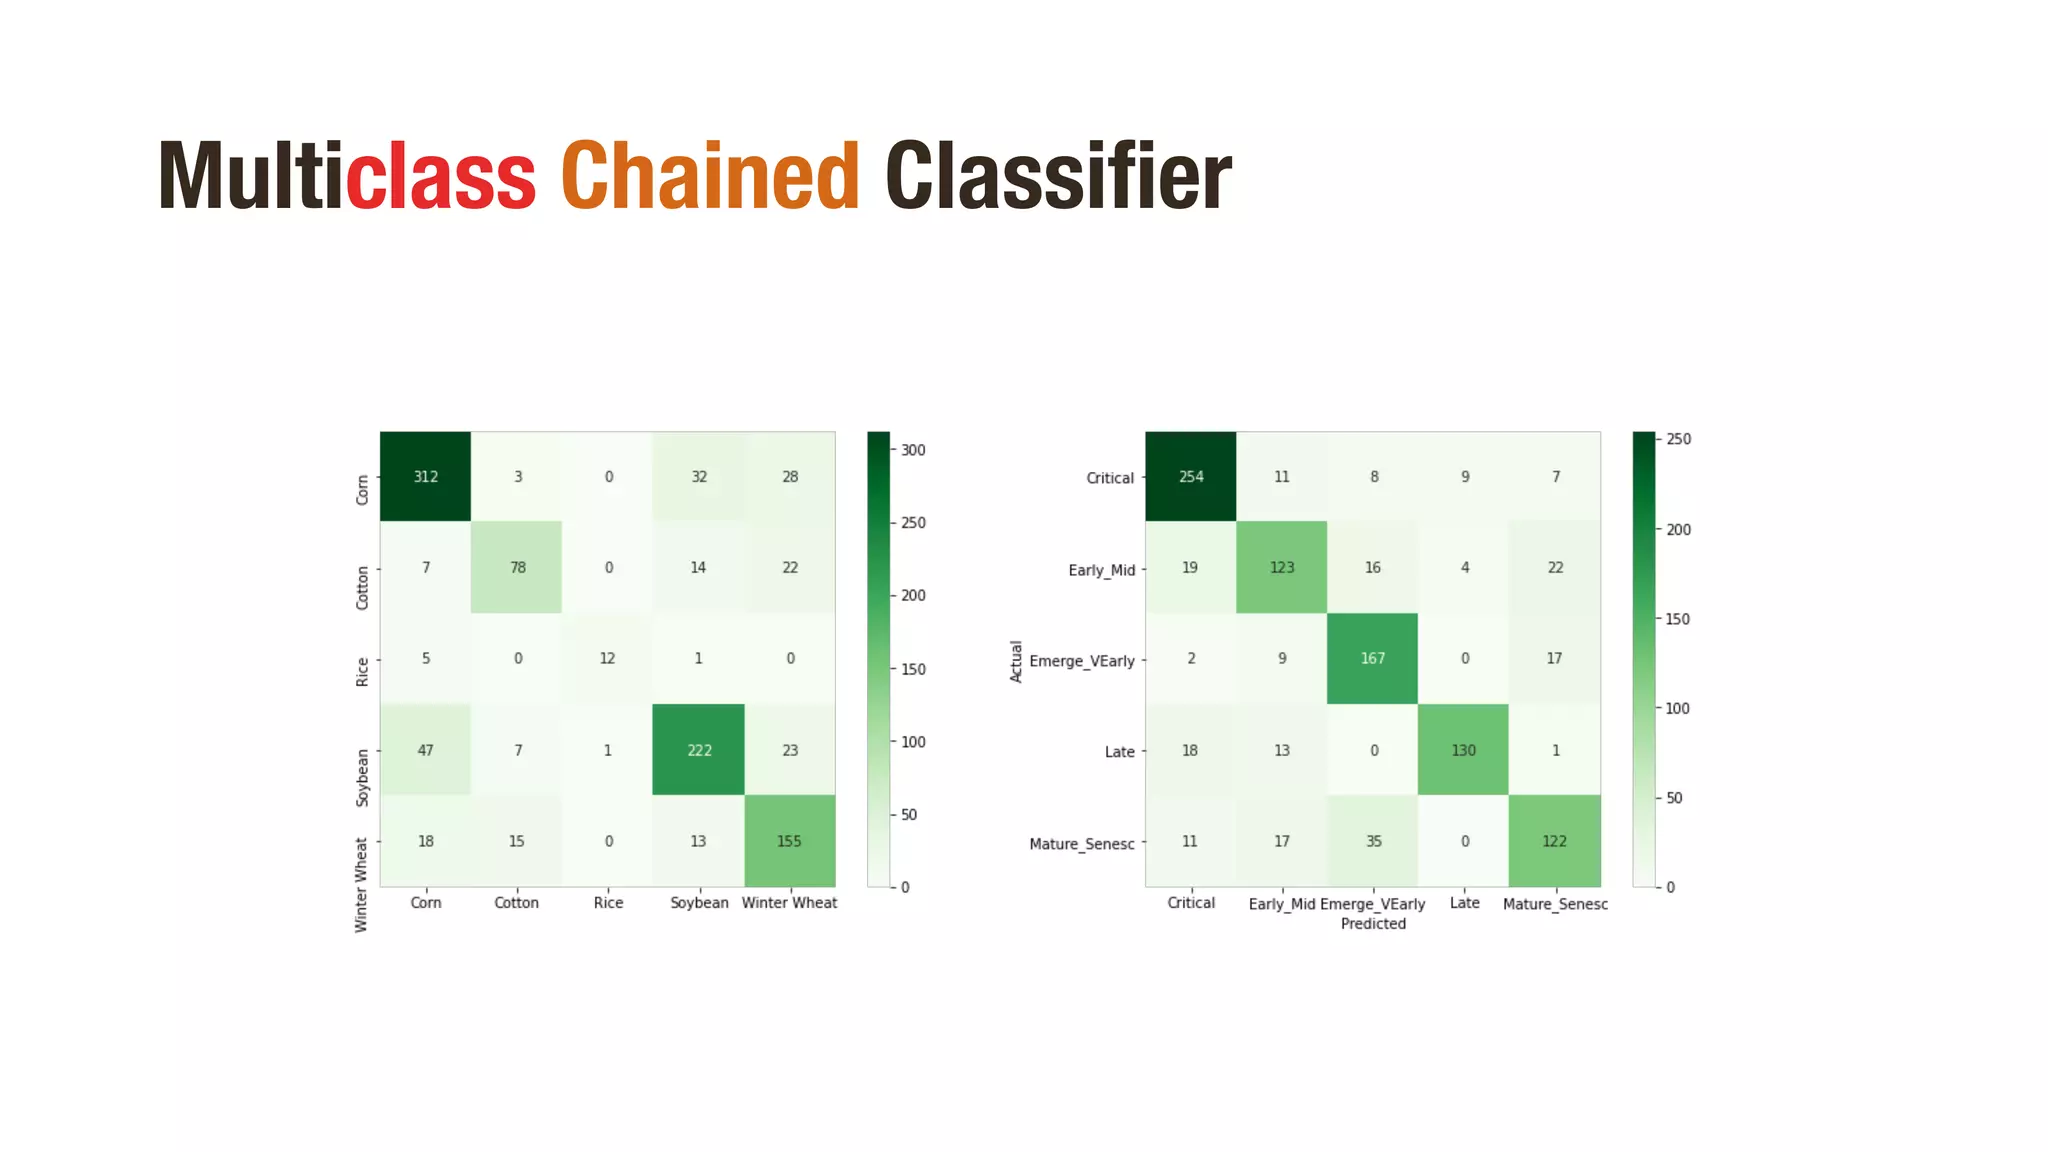
![Predictions
Target
Multiclass Chained Classifier
Crop
Crop Class
[0]
[…]
[4]
Crop
Classifier
Stage
Classifier
Stage
Stage Class
[0]
[…]
[4]
Input
X437
…
…
…
…
X923
SCORES
Crop Accuracy score 76.06 %
Stage Accuracy score 79.1 %](https://image.slidesharecdn.com/presentation-210326022923/75/CROP-PHENOTYPING-THROUGH-SPECTRAL-CLASSIFICATION-18-2048.jpg)
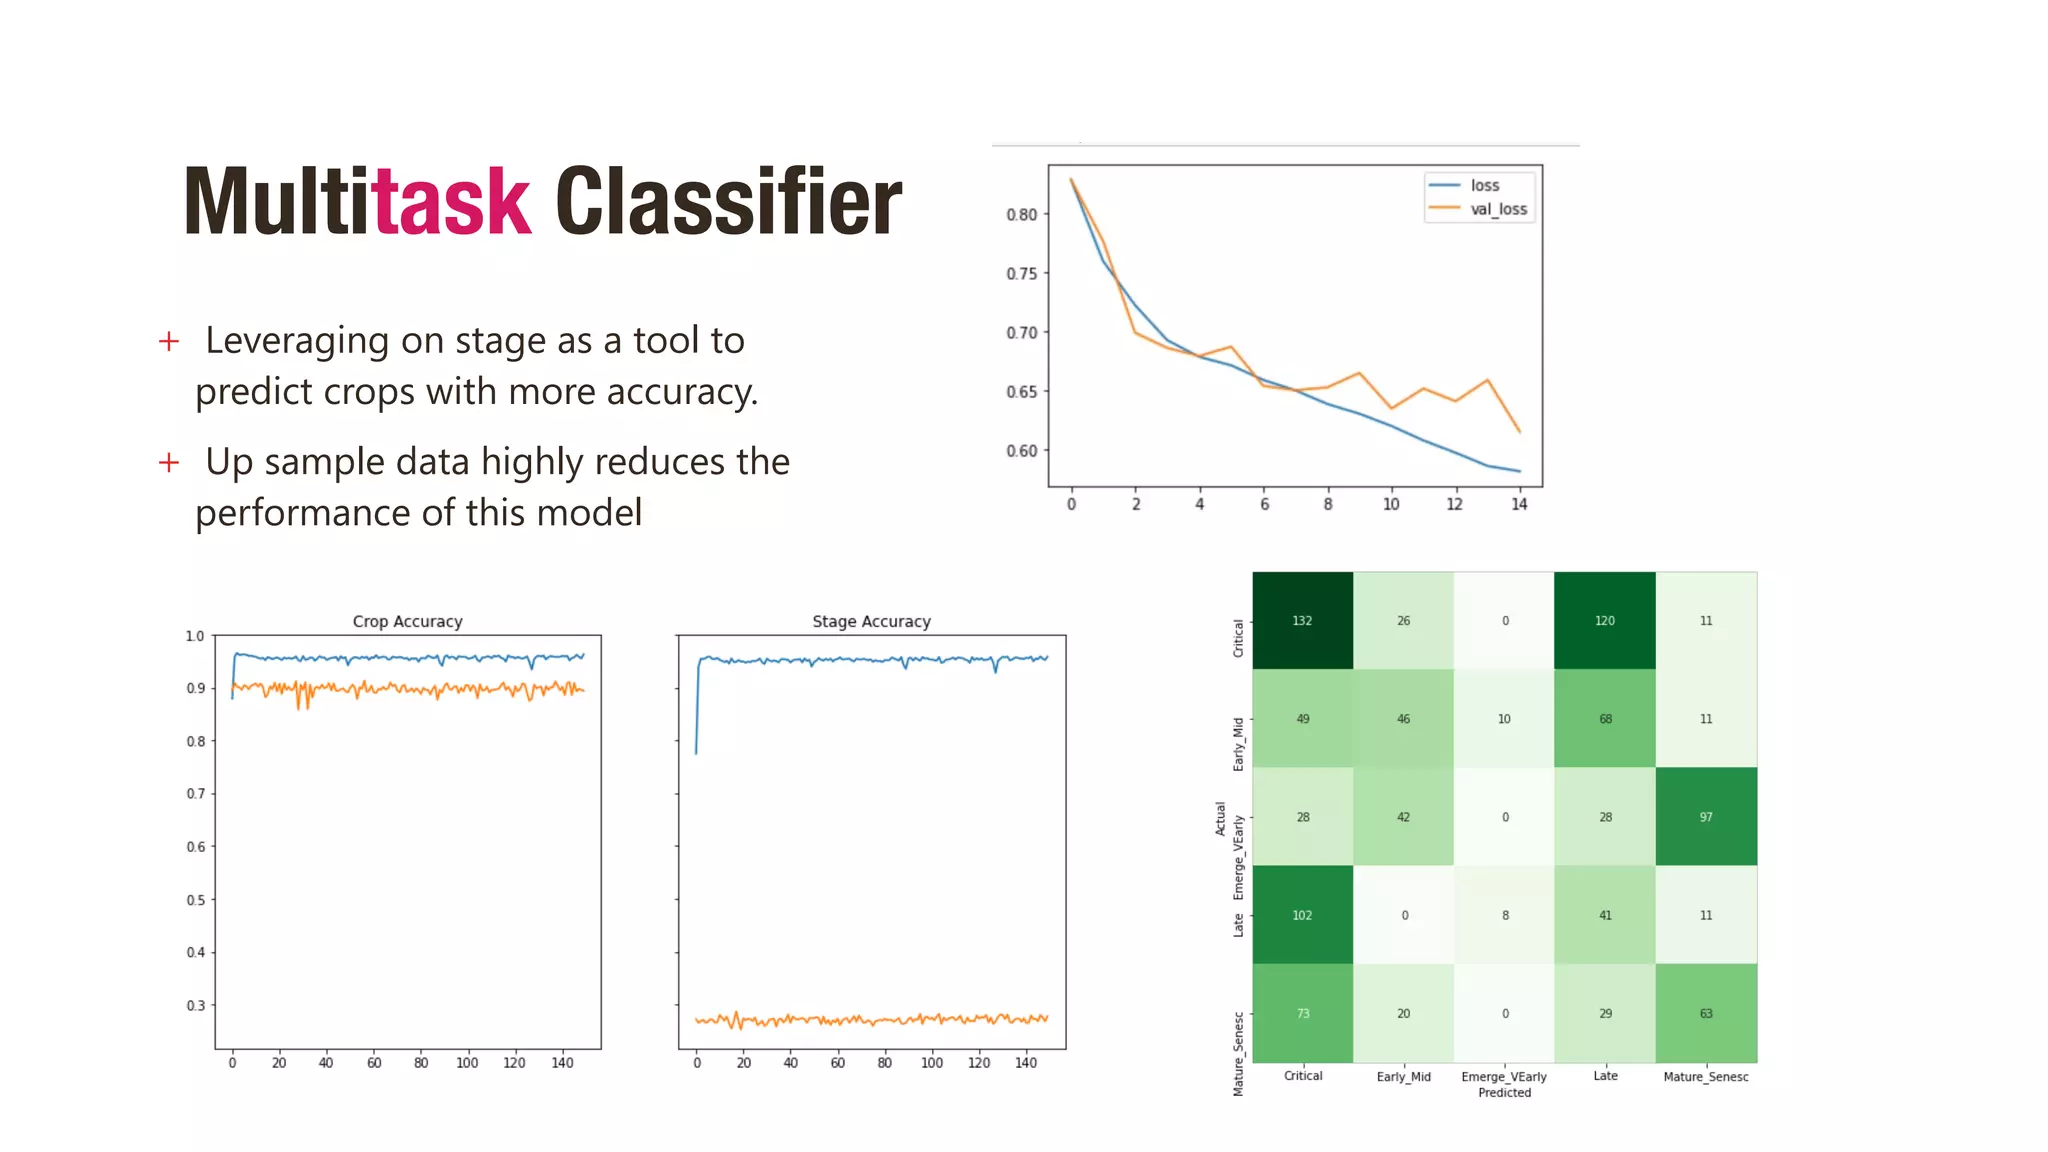
![Predictions
Target
Multitask Classifier
Crop Class
[0, 1, 0, 0]
[…]
[1, 0, 0, 0]
Stage Class
[0, 0, 1, 0]
[…]
[1, 0, 0, 0]
Input
(50, 1)
X437
…
…
X923
Crop
Crop Stage
[1, …, 0] [0, … 1]
…
…
…
…
[1, …, 0] [0, … 1]
Length = 5 * 2
Stage](https://image.slidesharecdn.com/presentation-210326022923/75/CROP-PHENOTYPING-THROUGH-SPECTRAL-CLASSIFICATION-20-2048.jpg)


![[DSC Europe 25] Djordje Hirs - Revolutionizing Telco Customer Experience with...](https://cdn.slidesharecdn.com/ss_thumbnails/zif75aur3qscnckv6tnc-djordje-hirs-cc-dsc2025-1-251219145617-679178aa-thumbnail.jpg?width=640&height=640&fit=bounds)
![[DSC Europe 25] Dobrica Cosic - From Electrons to Innovation: How Granular Da...](https://cdn.slidesharecdn.com/ss_thumbnails/h4qk69zereaumbceubgr-dobrica-cosic-from-electrons-to-innovation-how-granular-data-and-analytics-are--251218085301-b982fb14-thumbnail.jpg?width=640&height=640&fit=bounds)
![[DSC Europe 25] Mathias Halkjær Petersen - The AI workforce revolution.pptx](https://cdn.slidesharecdn.com/ss_thumbnails/3xviexv7q5gojhdsyvat-the-ai-workforce-revolution-251218084820-f3c286ed-thumbnail.jpg?width=640&height=640&fit=bounds)

![[DSC Europe 25] Behzad Hosseini - AI Agents in the Wild: Deploying Models tha...](https://cdn.slidesharecdn.com/ss_thumbnails/3qtejajvsjqrzwfept2c-10-251212103250-7f2b1068-thumbnail.jpg?width=640&height=640&fit=bounds)

![[DSC Europe 25] Ivan Petrovic - Is it really that expensive to build an AI sy...](https://cdn.slidesharecdn.com/ss_thumbnails/ybqhdwvusbg7jms3doxh-9-251216105605-7aab5a10-thumbnail.jpg?width=640&height=640&fit=bounds)


![[DSC Europe 25] Katherine Forrest - AI NOW: Understanding the Velocity of Cha...](https://cdn.slidesharecdn.com/ss_thumbnails/wvvbruqfrci0sfq9xwgb-4-251212104007-e5ad1987-thumbnail.jpg?width=640&height=640&fit=bounds)

![[DSC Europe 25] Danica Soc - The Science Behind Marketing: Experimentation me...](https://cdn.slidesharecdn.com/ss_thumbnails/c0nofsggs9gw5ucmallr-3-251216103155-56bd64d1-thumbnail.jpg?width=640&height=640&fit=bounds)

![[DSC Europe 25] Maria Kokiasmenos - AI Governance US Perspective.pptx](https://cdn.slidesharecdn.com/ss_thumbnails/eszqnbzlsqa2vch6dmci-6-251215095918-6fcdf45f-thumbnail.jpg?width=640&height=640&fit=bounds)


