This document presents a study on credit card fraud detection using hybrid machine learning algorithms, combining both supervised and unsupervised techniques. It evaluates several models, including k-nearest neighbors, logistic regression, and XGBoost, using data from European cardholders to determine the most effective method for identifying fraudulent transactions. The findings indicate that while accuracy can be misleading, the XGBoost algorithm showed the highest performance in detecting fraud.
![International Journal of Trend in Scientific Research and Development @ www.ijtsrd.com eISSN: 2456-6470
@ IJTSRD | Unique Paper ID – IJTSRD60102 | Volume – 7 | Issue – 6 | Nov-Dec 2023 Page 275
Related Work
In this paper we are defining and analyzing many
machine learning algorithms that can help us classify
abnormal transactions. The only requirement is the
past data and the suitable algorithm that can fit our
data in a better form. It helps you in the complete
end-to-end model training process and finally, we will
get the best model that can classify the transaction
into normal and abnormal types.
First, we describe what is supervised and
unsupervised modes and algorithms which we
approached for our model. Secondly, the algorithms
which we used to researched and analyzed over credit
card fraud detection
1. Supervised and Unsupervised
A. Supervised Learning-A type of machine learning
called supervised learning uses labelled data to
teach the algorithm new things. Labelled data is a
term used to describe input samples that come
with the required output labels. The purpose of
supervised learning is to build a model that
generalises and can correctly classify or predict
unknown or upcoming data.The training data
serves as a teacher in supervised learning,
instructing the algorithm on how to learn the
correspondence between input features and their
related labels. When given new, unlabeled
examples, the algorithm looks for patterns,
correlations, or decision boundaries in the data to
create predictions.
B. Unsupervised Learning- As the name implies,
unsupervised learning entails learning from
unlabeled data. Without any predefined labels or
goal outcomes, the algorithm in unsupervised
learning investigates the data to discover innate
patterns, structures, or relationships. Finding
hidden patterns or clusters in the data is the goal.
In unsupervised learning, the algorithm attempts
to cluster or group together related data points
based on their shared characteristics. It seeks to
discover the data's underlying distribution or to
isolate important features for future investigation
or decision-making.
2. Algorithms
In this paper we used some supervised and
unsupervised algorithm for the comparison and dis
A. Linear Regression- It is a simple and frequently
used algorithm, by fitting and observing data in
the model through connecting a dependent and
independent variables. Finding the best-fitting
line that reduces the discrepancy between the
anticipated and actual values of the dependent
variable is the aim of linear regression. The
equation below represents the line:
y= mx + b
where
y is the dependent variable/ response / goal variable
x is independent variable/feature/predictor variable,
The slope of the line, m, shows how much the change
in y changes when the x value changes by a unit.The
value of y when x is 0 is represented by the y-
intercept, or b.
B. Logistic Regression- the objective is to predict a
binary outcome (e.g., true/false, yes/no, 0/1)
based on a set of independent variables or
features, logistic regression is a popular
supervised learning approach. Contrary to its
name, logistic regression is typically employed to
solve classification issues as opposed to
regression issues. The logistic function, also
referred to as the sigmoid function, is used by the
logistic regression model to translate the linear
combination of independent variables to the
interval [0, 1].
p = 1 / (1 + e^(-z))
Where:
The positive class's anticipated probability is denoted
by the letter p.
The independent variables are combined linearly to
form the variable z.
The feature vector (x), learning weights (coefficients)
of the model, and an intercept term (b) are used to
create the linear combination (z).
C. Naive Bayes -The Bayes theorem of probability
serves as its foundation, and it makes the
assumption that the features are conditionally
independent given the class. Naive Bayes is a
well-liked option for text categorization tasks like
spam filtering and sentiment analysis due to its
popularity and computational efficiency despite
its simplicity and "naive" premise. Naïve Bayes
works on Data Preparation, Calculating Class
Priors, Calculating Feature Likelihoods,
Calculating Posterior Probability, Class
Prediction
D. K-Nearest Neighbors (KNN) -Machine learning
commonly uses the K-Nearest Neighbors (KNN)
algorithm for both classification and regression
problems. It is a non-parametric and instance-
based learning method, which means it depends
on the training data alone to produce predictions
rather than making firm assumptions about the
distribution of the underlying data. KNN works as
follows, Data Preparation, Choosing K,
Calculating Distances, Finding K Neighbors,](https://image.slidesharecdn.com/37creditcardfrauddetectionusinghybridmachinelearningalgorithm-240127064246-356dbe68/85/Credit-Card-Fraud-Detection-Using-Hybrid-Machine-Learning-Algorithm-2-320.jpg)
![International Journal of Trend in Scientific Research and Development @ www.ijtsrd.com eISSN: 2456-6470
@ IJTSRD | Unique Paper ID – IJTSRD60102 | Volume – 7 | Issue – 6 | Nov-Dec 2023 Page 277
Data Processing
The dataset is imbalanced towards a feature. Which
seems pretty valid for such kind of data. Because
today many banks have adopted different security
mechanisms — so it is harder for hackers to make
such moves.
Still, sometimes when there is some vulnerability in
the system — the chance of such activities can
increase.
That’s why we can see the majority of transactions
belongs to our datasets are normal and only a few
percentages of transactions are fraudulent. can also
check for null values
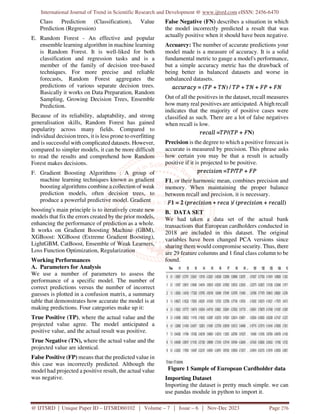
Figure 2 Sample of data types
Result Analysis
The experiment's dataset was obtained from the
Cardholders of 2018 in website. It includes credit
card transactions from 2013. The dataset has 492 out
of the 284,807 total transactions that are marked as
fake. Due to the 0.173% fraud cases, the data is
therefore deemed to be imbalanced. The distribution
of the dataset is shown in Figure 1. Without the
column labels, there are 30 columns. A PCA
projection was applied to all columns with the
exception of the time and amount features in order to
preserve privacy. All columns are therefore numerical
variables. The two classes are broken down in the
labels columns, where a genuine transaction is
represented by a value of 0 and a fraudulent
transaction by a value of 1
Figure 3 Distribution of Data Sets
Figure 4 Collection of Customer profile data’s in
30 rows
In figure 2 We can make a quick check that the
generated transactions follow the customer profile
properties:
The terminal IDs are indeed those in the list of
available terminals (0, 1, 2 and 3)
The transaction amounts seem to follow the
amount parameters of the customer
(mean_amount=62.26 and std_amount=31.13)
The number of transactions per day varies
according to the transaction frequency parameters
of the customer (mean_nb_tx_per_day=2.18).
Now produce the transactions for each and every
customer. Using the pandas groupby and apply
methods, this is simple:
“transactions_df=customer_profiles_table.
Groupby ('CUSTOMER_ID').
apply (lambda x: generate_transactions_table
(x.iloc[0], nb_days=5)).
reset_index(drop=True)
transactions_df “](https://image.slidesharecdn.com/37creditcardfrauddetectionusinghybridmachinelearningalgorithm-240127064246-356dbe68/85/Credit-Card-Fraud-Detection-Using-Hybrid-Machine-Learning-Algorithm-4-320.jpg)
![International Journal of Trend in Scientific Research and Development @ www.ijtsrd.com eISSN: 2456-6470
@ IJTSRD | Unique Paper ID – IJTSRD60102 | Volume – 7 | Issue – 6 | Nov-Dec 2023 Page 278
Figure 5 Graph of Transaction Table of
Customers
Analysis
MODELS ACCURACY F1 SCORE
DECISION TREE 0.999288 0.776255
K NEAREST
NEIGHBOURS
0.9995066 0.836538462
LOGISTIC
REGRESSION
0.9991148 0.693467337
SUPPORT VECTOR
MACHINES
0.99936154 0.77777777
RANDOM FOREST 0.999361 0.78431372
XG BOOST 0.9995211 0.842105263
Figure 6 Result Analysis
Figure 7 Graph of Accuracy and F Score
Conclusion:
In order to identify fraudulent transactions from a
sizable unbalanced dataset, we have constructed
different supervised models. Accuracy, and F1 score
comparison statistics have been provided, and the
percentage of properly recognising fraudulent
transactions is the comparison parameter. In
situations where it misrepresents a machine learning
technique, accuracy can actually be deceptive. For
instance, the local outlier factor performs poorly
based on accuracy and F1 values while having a
99.67% accuracy rate. So, when choosing the
optimum algorithm for fraud detection, precision,
recall, and F1 score values are important
considerations. The most effective supervised
learning algorithm is the XGboost algorithm, and
support vector machine outperforms all other
algorithms.
References:
[1] Abhinav Srivastava, Amlan Kundu, Shamik
Sural, Arun K. Majumdar, “Credit Card Fraud
Detection using Hidden Markov Model,” IEEE
Transactions On Dependable And Secure
Computing, vol. 5, Issue no. 1, pp.37-48,
January-March 2008
[2] Schneider, Gary (2010). Electronic Commerce.
Cambridge: Course Technology.
p. 497. ISBN 978-0-538-46924-1.
[3] S. Benson Edwin Raj, A. Annie Portia,
“Analysis on Credit Card Fraud Detection
Methods”, International Conference on
Computer, Communication and Electrical
Technology – ICCCET2011, 18th & 19th
March, 2011
[4] Seeja, K. R., and Zareapoor, M., (2014).
FraudMiner: A Novel Credit Card Fraud
Detection Model Based on Frequent Itemset
Mining, The Scientific World Journal, Hindawi
Publishing Corporation, Volume 2014, Article
ID 252797, pp. 1 – 10,
http://dx.doi.org/10.1155/2014/252797
[5] The Nilson Report. (2015). U.S. Credit & Debit
Cards 2015. David Robertson
[6] Bolton, R. J. and Hand, D. J., (2001).
Unsupervised profiling methods for fraud
detection, Conference on Credit Scoring and
Credit Control, Edinburgh.
[7] Kou, Y., Lu, C-T., Sinvongwattana, S. and
Huang, Y-P., (2004). Survey of Fraud
Detection Techniques, In Proceedings of the
2004 IEEE International Conference on
Networking, Sensing & Control, Taipei,
Taiwan, March 21-23.
[8] Bhattacharyya, S., Jha, S., Tharakunnel, K.,
Westland, J.C.: Data mining for credit card
fraud: a comparative study. Decis. Support
Syst. 50(3), 602–613 (2011)
[9] Padvekar SA, Kangane PM, Jadhav KV (2016)
Credit card fraud detection system. Int J Eng
Comput Sci 5(4):16183–16186](https://image.slidesharecdn.com/37creditcardfrauddetectionusinghybridmachinelearningalgorithm-240127064246-356dbe68/85/Credit-Card-Fraud-Detection-Using-Hybrid-Machine-Learning-Algorithm-5-320.jpg)
![International Journal of Trend in Scientific Research and Development @ www.ijtsrd.com eISSN: 2456-6470
@ IJTSRD | Unique Paper ID – IJTSRD60102 | Volume – 7 | Issue – 6 | Nov-Dec 2023 Page 279
[10] Xuan S, Liu G, Li Z, Zheng L, Wang S, Jiang C
(2018) Random forest for credit card fraud
detection. In: ICNSC 2018—15th IEEE
International conference on networking,
sensing and control, pp 1–6
[11] Fernandes, E. R., & de Carvalho, A. C.
“Evolutionary inversion of class distribution in
overlapping areas for multi-class imbalanced
learning”. Information Sciences, 2019, 494,
141–154
[12] Das, S., Datta, S., & Chaudhuri, B. B.,
“Handling data irregularities in classification:
Foundations, trends, and future challenges.
Pattern Recognition”, 2018, 81, 674–693.
[13] Lee, H. K., & Kim, S. B. “An overlap-sensitive
margin classifier for imbalanced and
overlapping data. Expert Systems with
Applications”,2018, 98, 72–83.
[14] Zhou, C., & Paffenroth, R. C. “Anomaly
detection with robust deep autoencoders”, In
Proceedings of the 23rd ACM SIGKDD
International Conference on Knowledge
Discovery and Data Mining, 2017(pp. 665–
668)](https://image.slidesharecdn.com/37creditcardfrauddetectionusinghybridmachinelearningalgorithm-240127064246-356dbe68/85/Credit-Card-Fraud-Detection-Using-Hybrid-Machine-Learning-Algorithm-6-320.jpg)