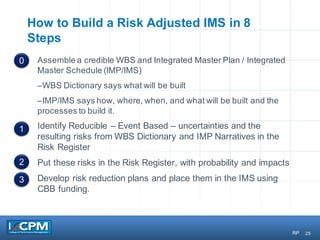
Download as PDF, PPTX
![9
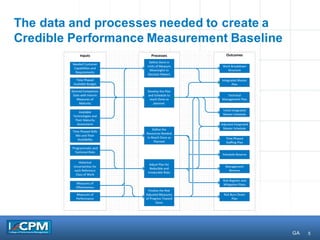
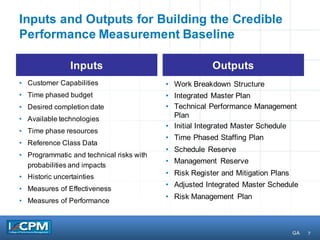
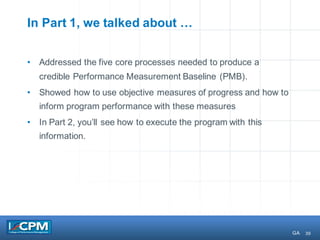
Systems Engineering Concepts Used By
The Wright Brothers [1]
SE Concept Wright BrothersActivities
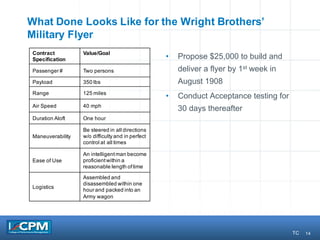
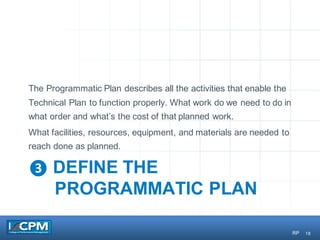
Operational
Concept
Vision: clear concept of the system they were developing
MissionRequirements: powered flight for substantial timeand distance
Scenarios: recognitionof a key scenarioinvolvinglateral control during flight
Define the System
Boundary
Understoodthe need for the pilot to be part of the system
Objectives Definitionof distanceand time objectives
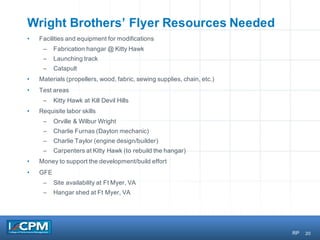
Derived
Requirements
Horsepower and weight of the engine
Thrust of the propellers
Requirements
Management
Managed weight requirement of the engine carefully
Functional
Analysis
Understood the functions of the airplane, which drove their design process
Further understood the functions of the propulsionsubsystem
Physical
Architecture&
Interfaces
Matched the physical architecture tothe functions of the airplane
Interfaces between the pilot and the control surfaces
Interfacebetween the engine and propellers TC](https://image.slidesharecdn.com/alleman-coonce-pricefinalv1-160202214942/85/Credible-Plans-Integrated-Reporting-and-Control-Systems-9-320.jpg)
![10
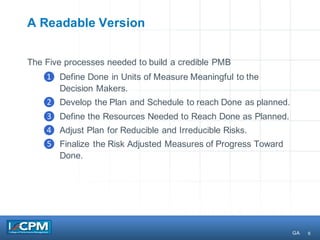
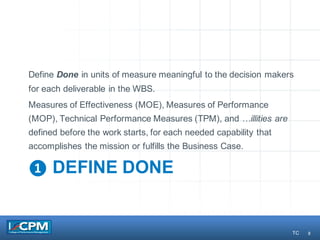
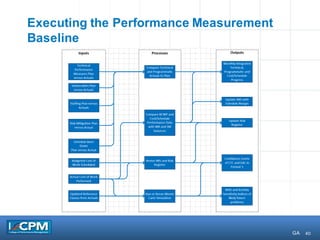
Systems Engineering Concepts Used By
The Wright Brothers [1]
SE Concept Wright BrothersActivities
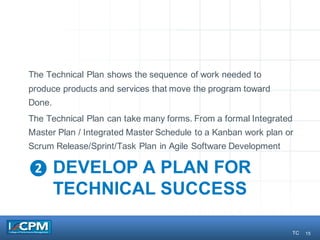
Prototypes and
Testing
Built a successfullymorecomplex set of gliders before building the airplane
First airplane was successful,due to the series of gliders and kites
Employed sophisticatedtestingwitheach prototype, atypical of others at the
time
Trade-Off
Decisions
Design favoredcontrol of the airplane over stability
Test System
Extensiveevenduring glider tests
Allowed problem identificationand solvingduring all test phases
Created wind tunnel to address discrepancy between their test data and the
literature
Included the careful selectionof the test site
Included in the first airplane
Verification
Best illustratedby testingof the engine to determine whether it met its
requirements
Validation The final test that proved flight was possible
Team Activities Two brothers formed a design-build team TC](https://image.slidesharecdn.com/alleman-coonce-pricefinalv1-160202214942/85/Credible-Plans-Integrated-Reporting-and-Control-Systems-10-320.jpg)
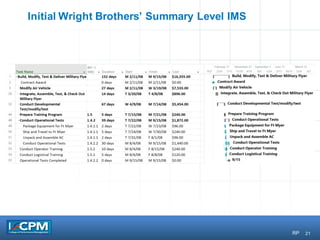
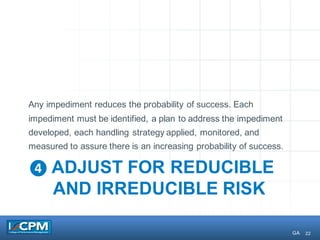
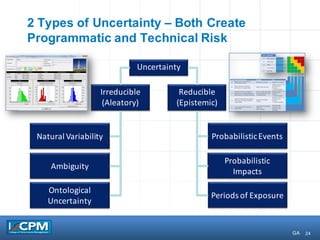
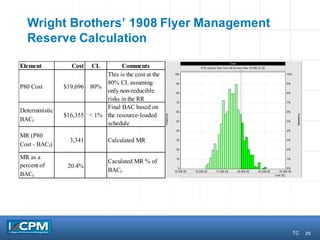
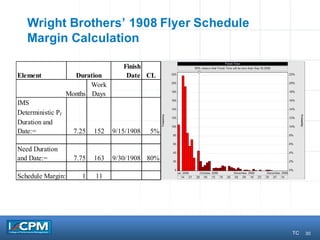
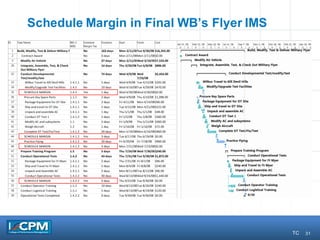
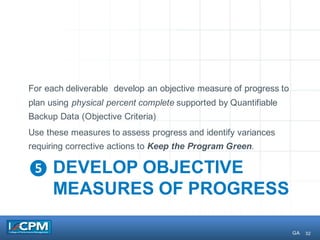
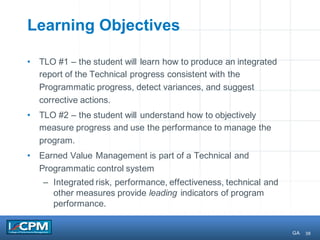
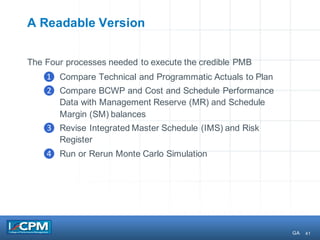


The document discusses the creation of a credible performance measurement baseline (PMB) through five core processes, utilizing the Wright brothers' flying machine as a case study. It outlines methods for defining success, developing technical and programmatic plans, adjusting for risks, and measuring progress with objective metrics. The latter sections emphasize the importance of executing the PMB by comparing actual performance against plans, and revising schedules and risk assessments based on performance data.