Downloaded 345 times


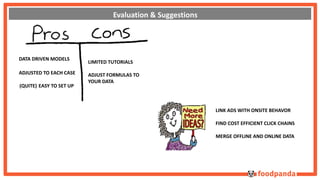


- The document discusses attribution modeling approaches used by Foodpanda, an online food delivery marketplace, to attribute orders and calculate the customer acquisition cost (CAC) of their marketing campaigns. - It covers the Shapley value approach, survival analysis, and suggests these data-driven models can be adjusted to their specific data to accurately attribute orders across channels like search, display, social media and link online and offline behavior. - The models help Foodpanda evaluate campaign efficiency, find the most cost-effective click chains, and merge online and offline data.


![제 23회 보아즈(BOAZ) 빅데이터 컨퍼런스 - [MBOAX] : ABSA를 활용한 소비자 반응 분석 기반 운영 효율화 대시보드 설계](https://cdn.slidesharecdn.com/ss_thumbnails/3-1boaz23rdconferencemboax-260203102709-9d519923-thumbnail.jpg?width=640&height=640&fit=bounds)


