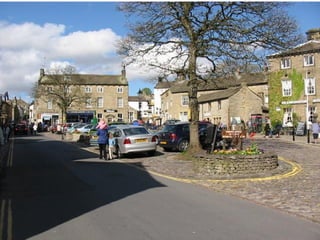
Grassington Coursework Dot to dot guide of how to do your coursework
 
Introduction Visit Grassington by clicking on the link below to remind you of your trip. For photos, maps and other information K drive:Geography/
Introduction  Title:  What impact has tourism had on Grassington?   Aim: An investigation into the impact of tourism on Grassington, a honeypot site in the Yorkshire Dales. Write out the title and aim, then explain the terms impact   and honeypot.
Objectives Key questions 1. Do  Shops and services cater for tourists rather than residents ?  2. Is transport in Grassington threatening the qualities that attract people to the town. 3. How has tourism been managed? 4. Are the aims of the NP being met?
Objectives Write out the objectives.  For each objective explain what it means and how it will help you do your enquiry.
Location Where is Grassington. Include a map. Why was Grassington chosen for your enquiry?
Method Describe the data you are going to collect Take each key question in turn and describe the data you need and how you will collect it.  State if you are using secondary data rather than the collecting it yourself. Clearly describe how you collected the data. Justify the way in which you gathered the data e.g. why were the sites chosen for the traffic count.
Data collection Show the data you have collected in the form of tables, original sketches and annotated maps.  Collate all the questionnaire results and present them in a table.
Problems  List any problems you encountered on the day when collecting the data. How did you overcome these.
Data presentation  Select data to be presented Use appropriate presentation techniques Field sketches labelled; photographs labelled: Bar graphs; flow line graph; pie Chart; Line graph; proportional bar; isoline graph; overlay diagrams Use your imagination Demonstrate your skills neatly.  You must use some ICT
Analysis & Conclusion Describe what the data shows On each graph/sketch etc where you have show the results of your field work.  State what it shows you, even label the graph etc Each graph/diagram must be fully labelled or you lose marks.
Links Make links between data. A link means that one piece of data that you collected is connected to something else e.g. number of visitors could be connected to the number of cars arriving in Grassington.
Analysis  Take each Key question – what does the data show?  Does it answer the question?  If so say why.  If not say why. Does this relate to any theory?
Conclusion Look at the aim of the project – have you successfully completed the aim How have you done this? Prove in a couple of paragraphs that you have done this.
Evaluation  Did your study have any limitations.  How could you have improved your study? Could it have been done better?  Explain your answers.
Planning and organisation Make sure you have done the following things . The project is in order. It is easy to read  All sketches graphs etc have titles and labels ICT is part of the project ( include diagrams as part of the text You have checked your spellings, punctuation and grammar You have numbered the pages You have a contents page You have a bibliography

Courseworkguide Grassington

  • 1.
    Grassington Coursework Dotto dot guide of how to do your coursework
  • 2.
  • 3.
    Introduction Visit Grassingtonby clicking on the link below to remind you of your trip. For photos, maps and other information K drive:Geography/
  • 4.
    Introduction Title: What impact has tourism had on Grassington? Aim: An investigation into the impact of tourism on Grassington, a honeypot site in the Yorkshire Dales. Write out the title and aim, then explain the terms impact and honeypot.
  • 5.
    Objectives Key questions1. Do Shops and services cater for tourists rather than residents ? 2. Is transport in Grassington threatening the qualities that attract people to the town. 3. How has tourism been managed? 4. Are the aims of the NP being met?
  • 6.
    Objectives Write outthe objectives. For each objective explain what it means and how it will help you do your enquiry.
  • 7.
    Location Where isGrassington. Include a map. Why was Grassington chosen for your enquiry?
  • 8.
    Method Describe thedata you are going to collect Take each key question in turn and describe the data you need and how you will collect it. State if you are using secondary data rather than the collecting it yourself. Clearly describe how you collected the data. Justify the way in which you gathered the data e.g. why were the sites chosen for the traffic count.
  • 9.
    Data collection Showthe data you have collected in the form of tables, original sketches and annotated maps. Collate all the questionnaire results and present them in a table.
  • 10.
    Problems Listany problems you encountered on the day when collecting the data. How did you overcome these.
  • 11.
    Data presentation Select data to be presented Use appropriate presentation techniques Field sketches labelled; photographs labelled: Bar graphs; flow line graph; pie Chart; Line graph; proportional bar; isoline graph; overlay diagrams Use your imagination Demonstrate your skills neatly. You must use some ICT
  • 12.
    Analysis & ConclusionDescribe what the data shows On each graph/sketch etc where you have show the results of your field work. State what it shows you, even label the graph etc Each graph/diagram must be fully labelled or you lose marks.
  • 13.
    Links Make linksbetween data. A link means that one piece of data that you collected is connected to something else e.g. number of visitors could be connected to the number of cars arriving in Grassington.
  • 14.
    Analysis Takeeach Key question – what does the data show? Does it answer the question? If so say why. If not say why. Does this relate to any theory?
  • 15.
    Conclusion Look atthe aim of the project – have you successfully completed the aim How have you done this? Prove in a couple of paragraphs that you have done this.
  • 16.
    Evaluation Didyour study have any limitations. How could you have improved your study? Could it have been done better? Explain your answers.
  • 17.
    Planning and organisationMake sure you have done the following things . The project is in order. It is easy to read All sketches graphs etc have titles and labels ICT is part of the project ( include diagrams as part of the text You have checked your spellings, punctuation and grammar You have numbered the pages You have a contents page You have a bibliography