Download to read offline
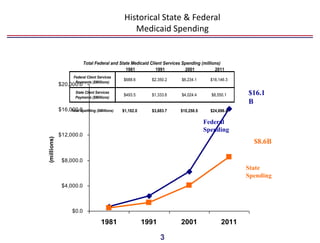
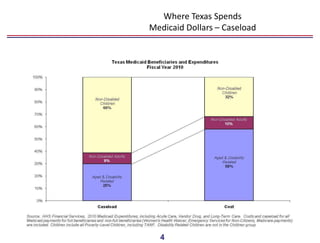
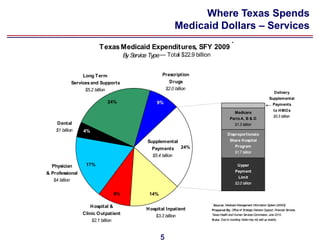
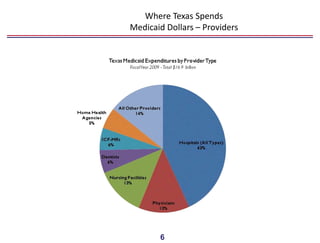
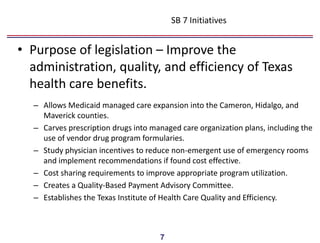
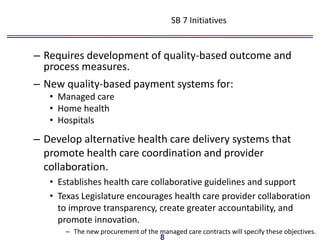

This document summarizes Representative John Zerwas's presentation on state legislative issues to the American Academy of Family Physicians. It shows how Texas Medicaid spending has shifted over time from institutions to managed care and outlines initiatives in Senate Bill 7 to improve quality and efficiency, such as expanding managed care, carving out prescription drugs, studying emergency room use, and creating a quality-based payment system. The bill also aims to develop alternative delivery systems through healthcare collaboratives and alternative payment methodologies like bundled payments.


![United Health Group [PDF Document] Form 8-K Related to Preliminary Earnings R...](https://cdn.slidesharecdn.com/ss_thumbnails/1016604-thumbnail.jpg?width=640&height=640&fit=bounds)


