This document provides an overview of cooling tower fundamentals, including:
1. It describes different types of cooling towers such as atmospheric, mechanical draft, hybrid draft, counterflow, and crossflow towers.
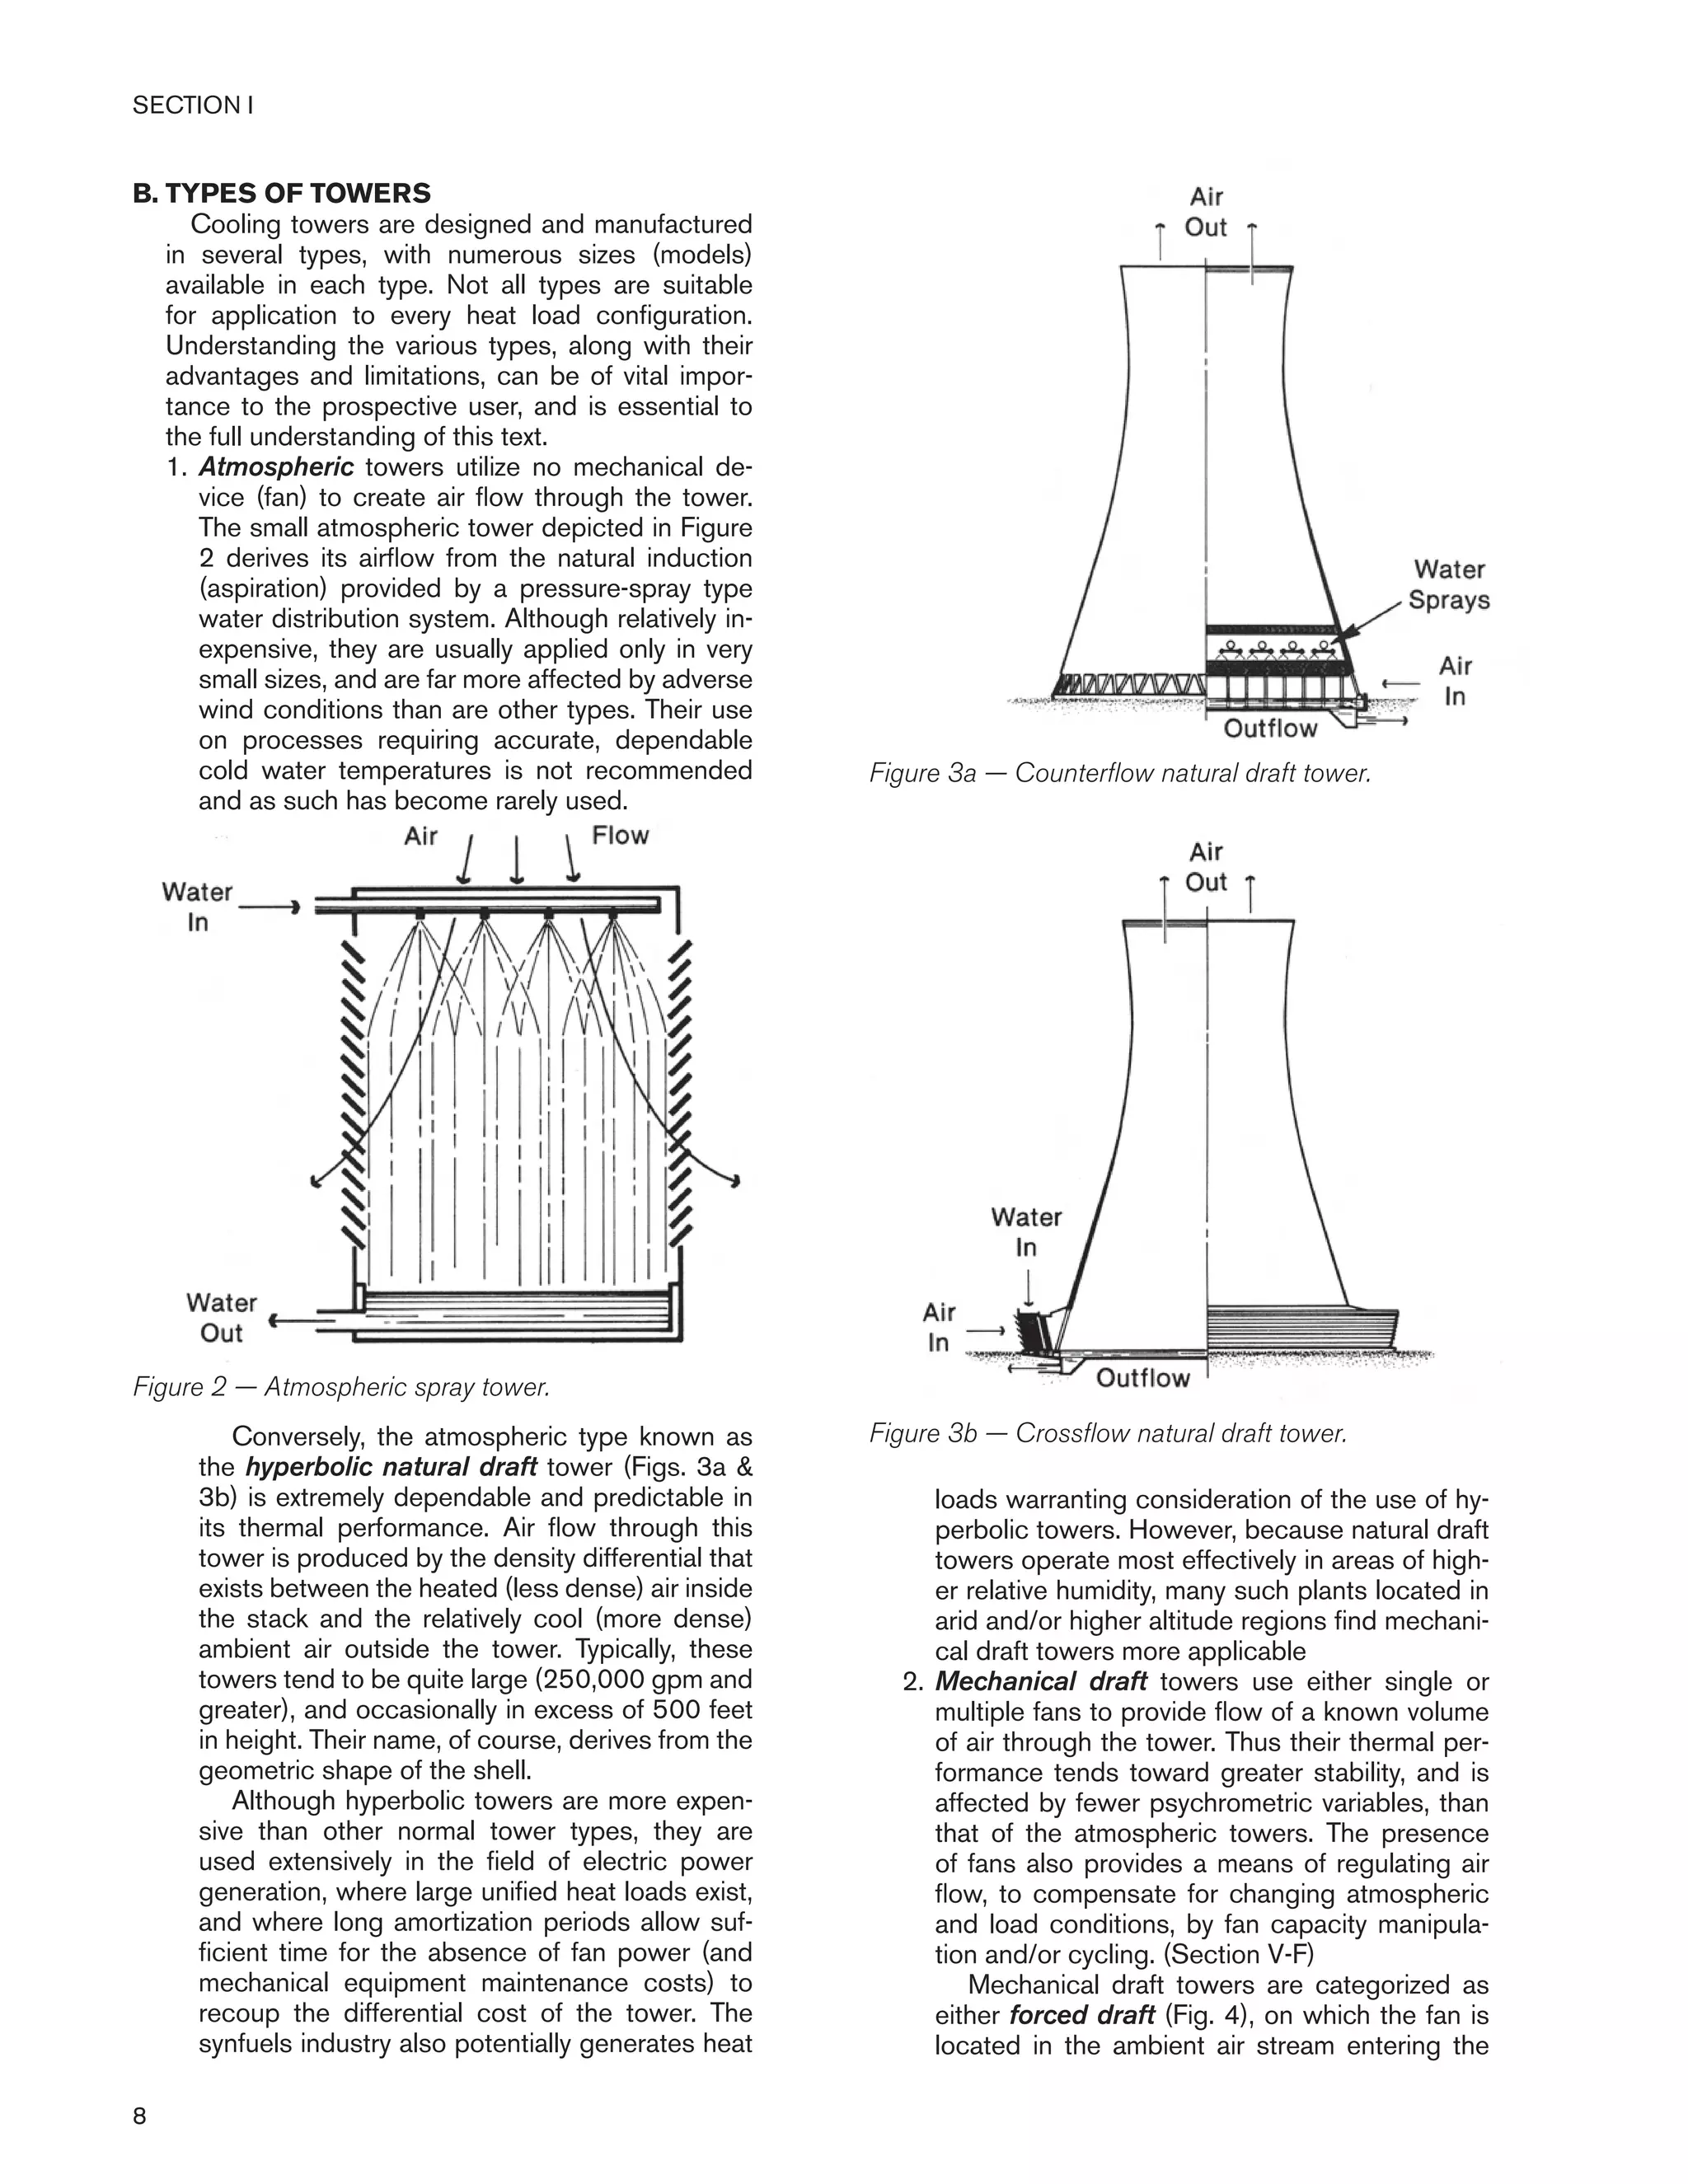
2. Towers are also characterized by their construction, including field-erected and factory-assembled towers.
3. The document outlines key components of towers including fans, distribution systems, basins, and casing. It also discusses factors that influence tower performance.


![31
SECTION I
tion, and the following transposition of Formula
(2) is used:
For example, let us assume that a given cool-
ing tower is designed to reduce the incoming
temperature of 10,000 gpm by 25°F (range).
Let us further assume that the level of chlorides
in the make-up water is 250 ppm, and we do
not want that level to go beyond 750 ppm in the
circulating water. Allowable concentrations are
750/250 = 3. The approximate evaporation rate
would be 10,000 x 25 x 0.0008 = 200 gpm. The
approximate drift rate would be 10,000 x 0.0002
= 2 gpm. Applying these values to Formula (5),
blowdown would be:
Even if the assumed evaporation and drift
rates were perfectly accurate, the calculated
blowdown rate of 98 gpm might still not be quite
enough because of the effects of the afore-
mentioned airborne contaminants, which are
usually incalculable. Once the approximate level
of blowdown has been determined, the circulat-
ing water quality should be regularly monitored
and appropriate adjustments made.
the circulating water will increase tremendously,
jeopardizing not only the cooling tower, but the
heat exchanger and all other water circuit related
components as well.
The proper method for controlling TDS con-
centrations is called “blowdown”, where a portion
of the circulating water flow (along with its TDS
burden) is continuously wasted and replenished
with relatively pure make-up water.
The approximate level to which contaminants
can concentrate in the circulating water is deter-
mined by the following formula:
Where: E = Rate of evaporation; gpm (If not ac-
curately known, evaporation can be
approximated by multiplying total
water flow rate in gpm times the
cooling range (°F) times 0.0008 (3)
D = Rate of drift loss; gpm (If not ac-
curately known, drift rate can be
approximated by multiplying to-
tal water flow rate in gpm times
0.0002) (4)
B = Rate of blowdown; gpm
However, because an acceptable level of con-
centration has usually been predetermined, the
operator is more concerned with the amount of
blowdown necessary to maintain that concentra-
C =
E + D + B
D + B
(2)
200 – [(3–1) x 2]
=
200 – (2x2)
=
200 – 4
=
196
(3 – 1) 2 2 2
= 98 gpm
B =
E – [(C – 1) x D]
(C – 1)
(5)
Figure 40 — Cooling tower blowdown versus number of concentrations.](https://image.slidesharecdn.com/cooling-tower-fundamentals2-201210081009/75/Cooling-tower-fundamentals-2-32-2048.jpg)


![56
SECTION III
tower than enters it. The actual cfm handled by
the fan is the product of mass flow rate times the
specific volume of dry air corresponding to the
temperature at which the air leaves the tower.
This volumetric flow rate is the “Q” used in the
following formulas, and it must be sufficient to
produce the correct mass flow rate or the tower
will be short of thermal capacity.
Utilizing appropriate cross-sectional flow ar-
eas, velocity through the fan and fan cylinder can
be calculated as follows:
It must be understood that “A” will change
with the plane at which velocity is being calcu-
lated. Downstream of the fan, “A” is the gross
cross-sectional area of the fan cylinder. At the
fan, “A” is the area of the fan less the area of the
hub or hub cover.
Velocity pressure is calculated as follows:
If “V” in Formula (10) represents the velocity
through the fan, then hv represents the velocity
pressure for the fan itself (hvf). Moreover, if the
fan is operating within a non-flared-discharge
fan cylinder, this effectively represents the total
velocity pressure because of no recovery having
taken place.
However, if the fan is operating within a flared,
velocity-recovery type fan cylinder (Fig. 68), hv
must be recalculated for the fan cylinder exit
(hve), at the appropriate velocity, and applied in
the following formula to determine total velocity
pressure:
hv = hvf – [(hvf - hve) x vr] (11)
Although the value of vr will vary with de-
sign expertise, and is empirically established, a
value of 0.75 (75 percent recovery) is normally
assigned for purposes of anticipating fan per-
formance within a reasonably well-designed
velocity-recovery cylinder.
The power output of a fan is expressed in
terms of air horsepower (ahp) and represents
work done by the fan:
Static air horsepower is obtained by substi-
tuting static pressure (hs) for total pressure (ht)
in Formula (12).
A great deal of research and development
goes into the improvement of fan efficiencies,
and those manufacturers that have taken a sys-
tems approach to this RD effort have achieved
results which, although incrementally small, are
highly significant in the light of current energy
costs. Static efficiencies and overall mechanical
(total) efficiencies are considered in the selec-
tion of a particular fan in a specific situation, with
the choice usually going to the fan which deliv-
ers the required volume of air at the least input
horsepower:
It must be understood that input hp is mea-
sured at the fan shaft and does not include the
drive-train losses reflected in actual motor brake
horsepower (bhp). Input hp will normally average
approximately 95 percent of motor bhp on larger
fan applications.
C. SPEED REDUCERS
The optimum speed of a cooling tower fan sel-
dom coincides with the most efficient speed of the
driver (motor). This dictates that a speed reduction,
power transmission unit of some sort be situated
between the motor and the fan. In addition to reduc-
ing the speed of the motor to the proper fan speed
(at the least possible loss of available power) the
power transmission unit must also provide primary
support for the fan, exhibit long term resistance to
wear and corrosion, and contribute as little as pos-
sible to overall noise level.
Speed reduction in cooling towers is accom-
plished either by differential gears of positive
engagement, or by differential pulleys (sheaves)
connected through V-belts. Typically, gear reduc-
tion units are applied through a wide range of
horsepower ratings, from the very large down to as
little as 5 hp. V-belt drives, on the other hand, are
usually applied at ratings of 50 hp or less.
V =
Q
A x 60
(9)
hv =
V2 x 12 x d
2 x g x D
(10)
aph =
Q x ht x D
33,000 x 12
(12)
Static Efficiency =
static ahp
input hp
(13)
Total Efficiency =
ahp
input hp
(13)
Figure 86 — Geareducer® type used for applied
horsepowers above 75 hp.
1. Gear Reduction Units: Geareducers are avail-
able in a variety of designs and reduction ratios to
accommodate the fan speeds and horsepowers
encountered in cooling towers. (Fig. 86) Because
of their ability to transmit power at minimal loss,
spiral bevel and helical gear sets are most widely](https://image.slidesharecdn.com/cooling-tower-fundamentals2-201210081009/75/Cooling-tower-fundamentals-2-57-2048.jpg)


![108
SECTION IX
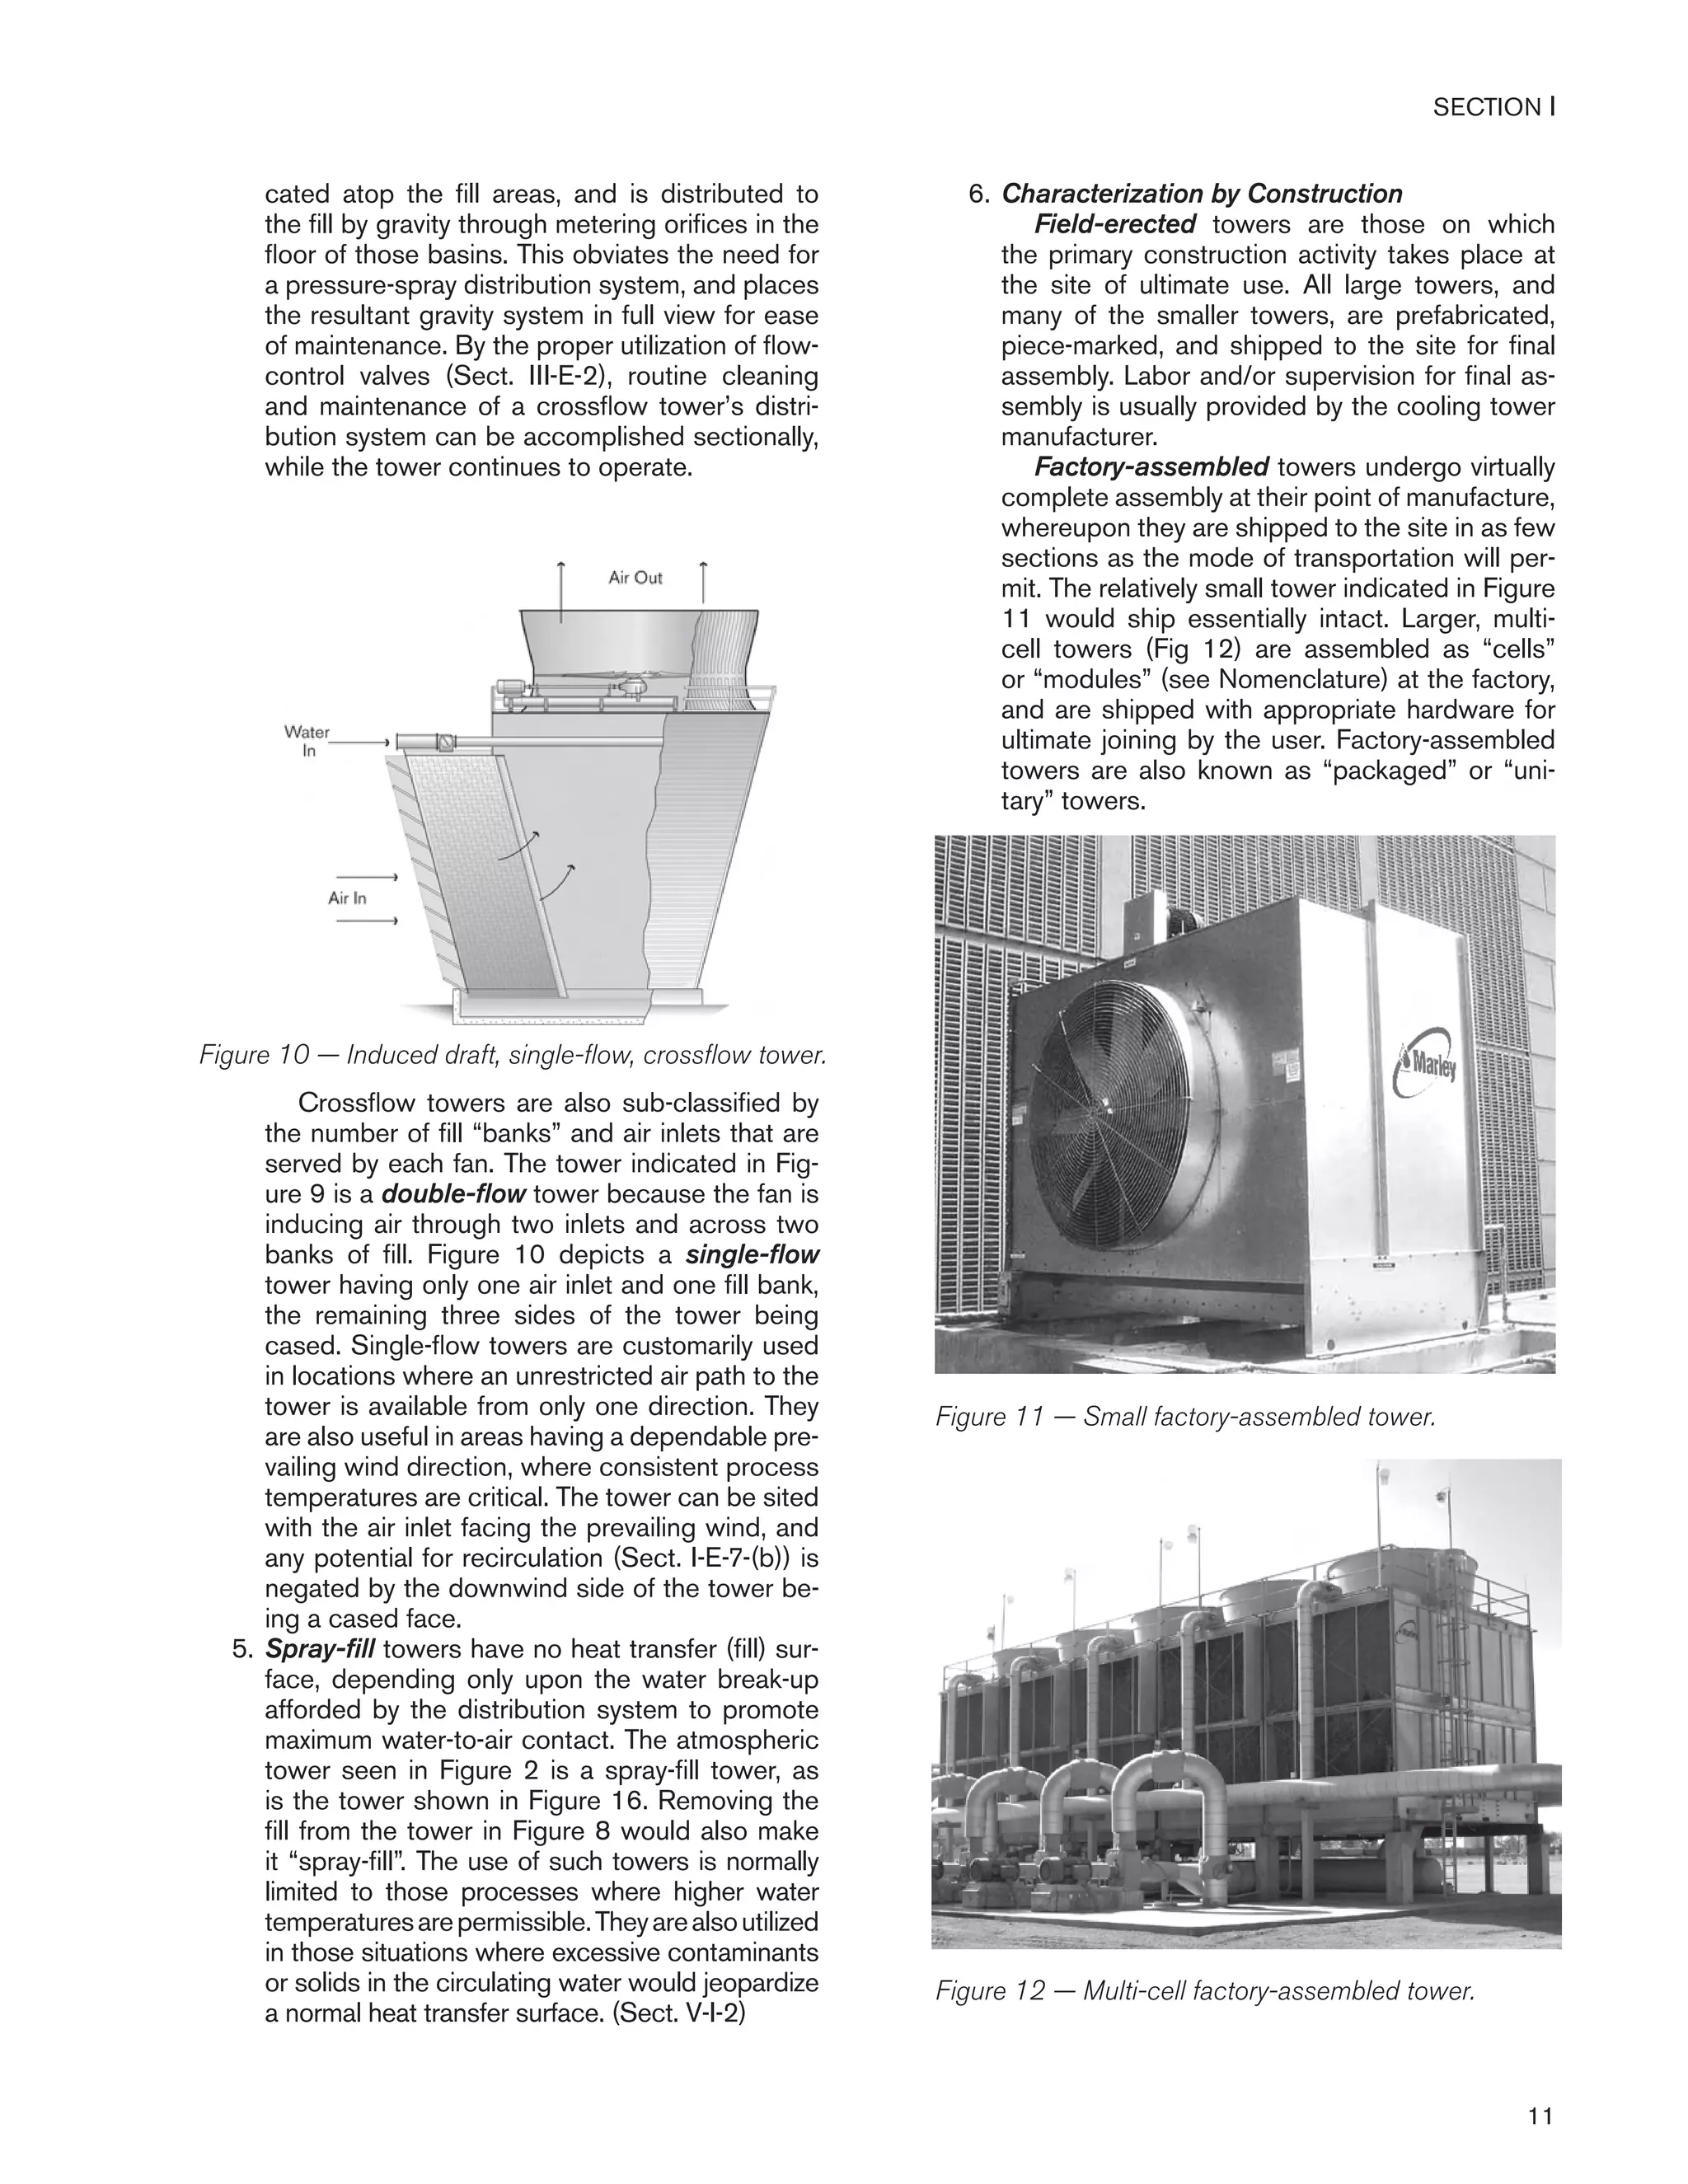
Table 2 — Data for Rapid Calculation of Saturation
and Stability Indexes (based on Langelier
formulas, Larson-Buswell residue, tempera-
ture adjustments and arranged by Eskel
Nordell).
Table 3 — Water Properties at Saturation
A B
Total Solids
ppm A
Temperature
°F B
50-300 0.1 32-34 2.6
400-1000 0.2 36-42 2.5
44-48 2.4
50-56 2.3
58-62 2.2
64-70 2.1
72-80 2.0
82-88 1.9
90-98 1.8
100-110 1.7
112-122 1.6
124-132 1.5
134-146 1.4
148-160 1.3
162-178 1.2
Temperature
°F
Density
lb/cu ft
Weight
lb/gal
Enthalpy
Btu/lb
39 62.43* 8.35 7.04
41 62.43 8.35 9.05
43 62.42 8.34 11.05
45 62.42 8.34 13.06
47 62.42 8.34 15.06
49 62.41 8.34 17.07
51 62.41 8.34 19.07
53 62.40 8.34 21.07
55 62.39 8.34 23.08
57 62.38 8.34 25.08
59 62.37 8.34 27.08
61 62.37 8.34 29.08
63 62.36 8.34 31.08
65 62.34 8.33 33.08
67 62.33 8.33 35.07
69 62.31 8.33 37.07
71 62.31 8.33 39.07
73 62.28 8.33 41.07
75 62.27 8.32 43.06
77 62.25 8.32 45.06
79 62.23 8.32 47.06
81 62.21 8.32 49.05
83 62.19 8.31 51.05
85 62.17 8.31 53.05
87 62.15 8.31 55.04
89 62.13 8.31 57.04
91 62.11 8.30 59.03
93 62.08 8.30 61.03
95 62.06 8.30 63.03
97 62.04 8.29 65.02
99 62.01 8.29 67.02
101 61.98 8.29 69.01
103 61.95 8.28 71.01
105 61.92 8.28 73.01
107 61.89 8.27 75.00
109 61.86 8.27 77.00
111 61.83 8.27 79.00
113 61.87 8.27 80.99
115 61.79 8.26 82.99
117 61.76 8.26 84.99
119 61.74 8.25 86.98
121 61.71 8.25 88.98
123 61.67 8.24 90.98
125 61.64 8.24 92.98
127 61.60 8.23 94.97
C D
Calcium Hardness
ppm or CaCO3 C
M.O. Alkalinity
ppm or CaCO3 D
10-11 0.6 10-11 1.0
12-13 0.7 12-13 1.1
14-17 0.8 14-17 1.2
18-22 0.9 18-22 1.3
23-27 1.0 23-27 1.4
29-34 1.1 28-34 1.5
35-43 1.2 35-43 1.6
44-55 1.3 44-55 1.7
56-69 1.4 56-69 1.8
70-87 1.5 70-87 1.9
88-110 1.6 88-110 2.0
111-138 1.7 111-138 2.1
139-174 1.8 139-174 2.2
175-220 1.9 175-220 2.3
230-270 2.0 230-270 2.4
280-340 2.1 280-340 2.5
350-430 2.2 350-430 2.6
440-550 2.3 440-550 2.7
560-690 2.4 560-690 2.8
700-870 2.5 700-870 2.9
880-1000 2.6 880-1000 3.0
Saturation Index = pH(actual) – (9.3 + A + B) + (C + D)
Stability Index = 2[(9.3 + A + B) – (C + D)] – pH (actual)
*Maximum water density occurs at 39.2°F
Notes:
1. Absolute constants (US Units) are 231 cu in = 1 gal
and 7.4805 gal = 1 cu ft
2. Unless accurate scientific treatment demands oth-
erwise, arbitrary constants utilized in the cooling
tower industry are:
• Water density = 62.34 lb/cu ft
• Water weight = 8.33 lb/gal
• 2.31 ft of water column = 1 lb/sq in pressure](https://image.slidesharecdn.com/cooling-tower-fundamentals2-201210081009/75/Cooling-tower-fundamentals-2-109-2048.jpg)