Download to read offline

![remotely powers and communicates with the inserted sensor to
initiate and receive the measurements. This information is com-
municated wirelessly via Bluetooth™
to a Handheld Application
running on a secondary display and can be downloaded and
configured through a Universal Serial Bus (USB) port. A web
interface has also been developed for plotting and sharing of
uploaded data.
2.1.1. Subcutaneously insertable fluorescent sensor
The sensor (Fig. 2A) is a micro-fluorometer that is encased in a
rigid, translucent and biocompatible polymer capsule 3.3 mm
[0.13″] in diameter and 15 mm [0.62″] in length (Colvin and
Jiang, 2013). Glucose concentration is measured by means of
fluorescence from the glucose-indicating hydrogel, which is poly-
merized onto the capsule surface over the optical cavity. The
optical system contained within the capsule is comprised of a
light-emitting diode (LED), which serves as the excitation source
for the fluorescent hydrogel; two spectrally filtered photodiodes,
which measure the glucose-dependent fluorescence intensity; an
integrated circuit with onboard temperature sensor; and an
antenna, which receives power from and communicates with the
transmitter.
The glucose-indicating hydrogel (Fig. 2B) consists primarily of
poly(2-hydroxyethyl methacrylate) (pHEMA) into which a fluor-
escent indicator (Fig. 2C) is copolymerized. In contrast to other
CGMs, which utilize electrochemical enzyme-based glucose sen-
sors, no chemical compounds are consumed (i.e., glucose, oxygen)
or formed (i.e., hydrogen peroxide) during use, and the glucose-
indicating hydrogel is not subject to the instability characteristics
of enzymes. Instead, glucose reversibly binds to the indicator
boronic acids groups (which act as glucose receptors) in an
equilibrium binding reaction (James et al., 2006). Subsequent
disruption of photoinduced electron transfer (PET) results in an
increased fluorescence intensity upon glucose-binding. When
glucose is not present, anthracene fluorescence is quenched by
intermolecular electron transfer (indicated by the curved arrows in
Fig. 2c) from the unpaired electrons on the indicator tertiary
amines. When glucose is bound to the boronic acids, the Lewis
acidity of boron is increased, and weak boron-nitrogen bonds are
formed. This weak bonding prevents electron transfer from the
amines and consequently prevents fluorescence quenching. Of
note, the indicator is not chemically altered as a result of the
PET quenching process. Fluorescence increases with increasing
glucose concentrations until all indicator binding sites are filled at
which point the signal reaches a plateau (James et al., 2006;
Shibata et al., 2010). The measurement of a given glucose con-
centration can be modeled by the following equation:
Glucose ¼ Kd
Fmeas ÀFmin
Fmax ÀFmeas
; ð1Þ
where Fmin is the integrated fluorescence in the absence of glucose,
Fmax is the integrated fluorescence when all of the accessible
indicator is bound to glucose, Fmeas is the integrated fluorescence
at a given concentration of glucose, and Kd is the dissociation
constant for the indicator. Eq. (1) serves as the core of the CGM
system glucose algorithm that also incorporates kinetic and
temperature dependences, as previously described (Wang et al.,
2012). Since self-monitored blood glucose (i.e., finger-stick) mea-
surements are used to calibrate the CGM system, a time and glucose
dependent lag time model is used in the algorithm to correct for
differences between blood glucose and interstitial fluid (ISF) glucose
concretions (Rebrin et al., 1999). A 10-nm layer of platinum,
deposited onto the sensor by sputter coating, serves to prevent
in vivo oxidation of the indicator phenylboronic acids groups.
Platinum catalytically degrades the reactive oxygen species that
are otherwise generated by the body's normal wound healing
response to sensor insertion and by the body's response to a foreign
body (Colvin and Jiang, 2013). A glucose-permeable membrane
covers the hydrogel and provides a biocompatible interface.
The sensor contains a custom integrated circuit (Dehennis
et al., 2013) that has been fabricated specifically for this applica-
tion. Additionally, it includes on-board electrically erasable pro-
grammable memory (EEPROM) for local configuration storage and
production traceability. Its ability to communicate is mediated by a
near field communication interface to the external transmitter.
The sensor consists of only six electrical parts encased within the
Fig. 1. Continuous glucose monitoring system components.
Fig. 2. Implantable optical-based glucose sensor. (A) Photograph of the implantable
glucose sensor (shown without glucose-indicator hydrogel coating); (B) scanning
electron microscope (SEM) images of the glucose indicator hydrogel grafted onto
the outside of the PMMA sensor encasement; and (C) chemical structure and
glucose binding mode of indicator moiety. R2 shown in the figure denotes
connectivity to the hydrogel backbone, while R1 represents a propionic acid
side chain.
M. Mortellaro, A. DeHennis / Biosensors and Bioelectronics 61 (2014) 227–231228](https://image.slidesharecdn.com/continuous-glucose-150504105959-conversion-gate02/85/Continuous-glucose-2-320.jpg)
![PMMA capsule: the application specific integrated circuit (ASIC),
the ferrite antenna, three capacitors for tuning and regulation, and
an on board ultraviolet (UV) LED. The sensor does not contain a
battery or other stored power source; instead, it is remotely and
discretely powered, as needed, by a simple inductive magnetic link
between the sensor and the transmitter. On power-up, the LED
source is energized for approximately 4 ms to excite the fluores-
cent indicator. Between readings, the sensor remains electrically
dormant and fully powered down.
2.1.2. Body-worn transmitter
The body-worn transmitter is a rechargeable, external device
that is worn over the sensor implantation site and that supplies
power to the proximate sensor, calculates glucose concentration
from data received from the sensor, and transmits the glucose
calculation to a smartphone. The wearable transmitter supplies
power to the sensor through an inductive link of 13.56 MHz. The
transmitter is placed using an adhesive patch or band (i.e.,
armband, waistband, and wristband). The external transmitter
reads measured glucose data from the subcutaneous sensor up
to a depth of approximately 2–3 cm. The transmitter powers and
activates a measurement sequence every 2 min and then calcu-
lates glucose concentrations and trends. This information also
enables the transmitter to determine if an alert condition exists,
which is communicated to the wearer through vibration and the
transmitter's LED. The information from the transmitter is then
transmitted for display to a smartphone via a Bluetooth™
low
energy link.
2.2. in vivo performance trial
2.2.1. Clinical study design
The study was designed to provide a preliminary evaluation of
the sensor in vivo accuracy and CGM system performance. An
institutional review board approved the protocol, and all study
procedures were conducted in accordance with the principles of
Guideline for Good Clinical Practice (1996). Written informed
consent was obtained from all patients before study enrollment.
Twelve adult subjects with type 1 diabetes participated. Four
subjects underwent placement of one sensor in the wrist as well
as placement of another sensor in the contralateral upper arm
(identification [ID] numbers 1–4). Another four subjects (ID
numbers 5–8) underwent placement of one sensor in the upper
arm. The remaining four subjects (ID numbers 9–12) underwent
placement of one sensor in the upper arm as well as placement of
another sensor in the abdomen. All subjects had sensors inserted
on day 0 and removed on approximately day 28. Subjects attended
six in-clinic read sessions (8þ hours each) within that time
interval. During the in-clinic visits, a transmitter was placed over
each sensor for the collection of sensor data every 2 min. Further, a
catheter was placed into an antecubital vein during the in-clinic
visits, and venous blood was obtained every 15 min for blood
glucose measurements with an YSI blood glucose analyzer (YSI;
Model 2300, Yellow Springs, Ohio). Subjects were provided meals
and snacks at the clinical site.
Sensor glucose values were not displayed to the subjects or
clinicians throughout the duration of this study. All subjects
completed the entire 28-day study period. One sensor (in subject
9) failed to send readable data to the transmitter post-insertion
due to disconnect of an electrical component (i.e., ASIC pin) within
the sensor, and the decision was made to remove the sensor on
the next follow-up clinic visit. Therefore, data from a total of
19 sensors among 12 subjects were analyzed in this study.
Glucose measurements were collected via: (1) CGM every
2 min; (2) venous blood sampling and YSI blood glucose analyzer
measurements every 15 min and (3) finger-stick glucose measure-
ments pre-prandially and post-prandially. CGM sensor glucose
accuracy was assessed by comparison with the YSI blood glucose
measurements. A subset of subjects wore the transmitter at home
for up to 2 weeks to appraise CGM performance in an ambulatory
setting.
2.2.2. Subjects
Enrolled subjects ranged in age from 23 to 64 years (mean¼4474
years) and included 11 men and one woman. All individuals had been
diagnosed with type 1 diabetes for at least 2 years, and BMI ranged
from 19.8 to 32.1 kg/m2
(mean¼27.871.0 kg/m2
). Baseline HbA1c
ranged from 7.0 to 9.0 (mean¼8.170.2).
2.2.3. Sensor insertion and removal
The sensors were inserted into the subcutaneous space using
aseptic technique via a small incision ($0.8–1.0 cm) made under
local anesthesia with lidocaine. Two 5-0 nylon sutures were used
to close the wound. A typical insertion time was less than 5 min.
Removal of the device (upon completion of the study) was also
performed using aseptic techniques under local anesthesia with
lidocaine. A small incision was made at the proximal end of the
sensor location, and manual pressure was applied to the distal end
to extrude the sensor from the subcutaneous space through the
incision. A thin adhesive strip or suture was applied to assure
closure at the removal site. Typical excision times were also less
than 5 min.
2.2.4. Sensor calibration
The clinical trial was conducted with the glucose display
blinded to the subject and clinician. For calibration, the sensor
measurements were downloaded from the transmitter along with
the subject's finger-stick (SMBG) meter blood glucose measure-
ments. Those finger-stick measurements were prospectively used
to calibrate the sensor following the identical calibration regimen
as that used for the unblinded system. The calibration regimen for
this trial had three phases:
(1) A blinded warm up phase, which comprised the first 24 h after
implantation during which glucose levels were not calculated.
(2) Initialization phase, which started at 24 h after implantation
and ended after acquiring four calibration points separated by
a minimum of 2 h.
(3) Calibration-update phase, which started after the initialization
phase and ended after acquiring two calibration points within
a single day separated by a minimum of 8 h.
Calibration points were also limited to glucose readings
460 mg/dL and o300 mg/dL during rates of glucose change less
than 2.5 mg/dL/min.
3. Results
3.1. in vivo accuracy
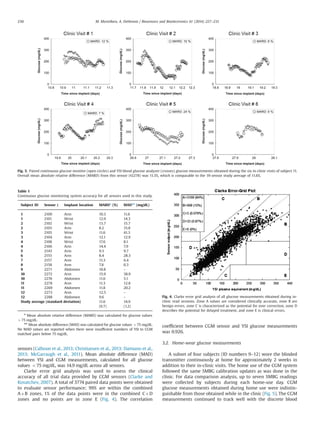
The mean absolute relative difference (MARD) between CGM and
time-matched YSI blood glucose measurements were calculated for
all sensors at each in-clinic session and cumulatively over the entire
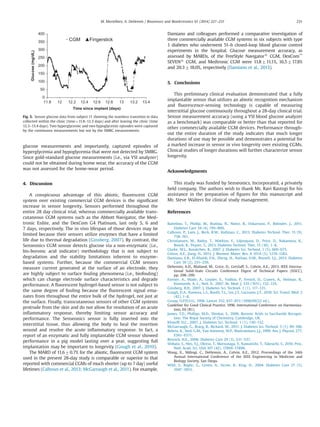
28-day trial. Glucose data from the six in-clinic sessions of subject 11
(Fig. 3) illustrates how CGM sensor glucose measurements tracked
with blood glucose measurements from the YSI. Quantitative com-
parison of time-matched CGM versus YSI-based glucose measure-
ments (every 15 min) for the in-clinic sessions across all sensors
showed a MARD of 11.670.7% (Table 1), which is comparable to or
lower than the MARDs reported for other commercially available
M. Mortellaro, A. DeHennis / Biosensors and Bioelectronics 61 (2014) 227–231 229](https://image.slidesharecdn.com/continuous-glucose-150504105959-conversion-gate02/85/Continuous-glucose-3-320.jpg)

An implantable, fluorescent-based continuous glucose monitoring (CGM) system was evaluated in 12 patients with type 1 diabetes over 28 days. The system consists of a subcutaneously implanted sensor and external transmitter. The sensor uses a fluorescent, boronic acid-based hydrogel coating to detect glucose levels in interstitial fluid. Accuracy was evaluated by comparing sensor readings to venous blood glucose measurements taken every 15 minutes. The mean absolute relative difference was 11.6%, and 99% of readings were in zones A and B of the Clarke error grid, indicating accurate performance over 28 days of implantation.