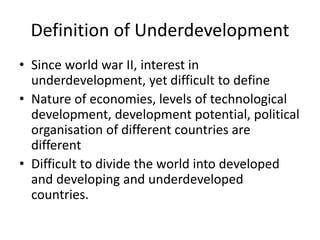
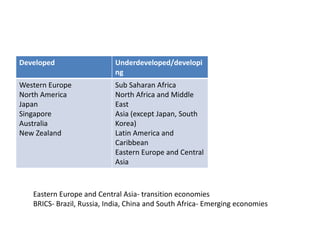
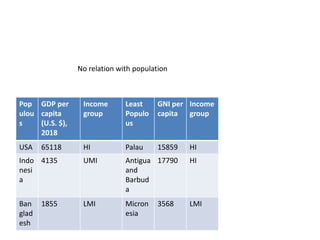
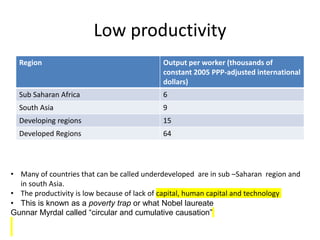
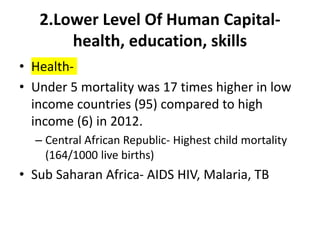
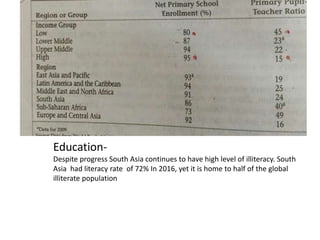
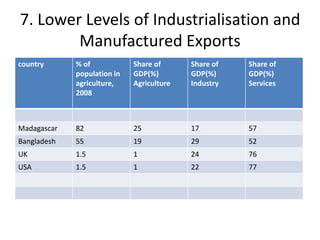
Concept of Underdevelopment
Definition of Underdevelopment
• Since world war II, interest in
underdevelopment, yet difficult to define
• Nature of economies, levels of technological
development, development potential, political
organisation of different countries are
different
• Difficult to divide the world into developed
and developing and underdeveloped
countries.
Developed Underdeveloped/developi
ng
Western Europe
North America
Japan
Singapore
Australia
New Zealand
Sub Saharan Africa
North Africa and Middle
East
Asia (except Japan, South
Korea)
Latin America and
Caribbean
Eastern Europe and Central
Asia
Eastern Europe and Central Asia- transition economies
BRICS- Brazil, Russia, India, China and South Africa- Emerging economies
• North-South, Third world, underdeveloped, developing, less developed,
least developed, Newly Industrialised countries
• HDI Classification
• Least Developed countries recognised by UN- lowest indicators of socio-
economic development
• low income
• Low Human capital
• High Economic vulnerability
• 2018- 47 countries, mostly in Sub Saharan Africa, some in Asia
(Afghanistan among others) and Pacific Islands).
• Vast differences within Developing. World bank’s income categories -
LI,LMI, UMI, HI World Bank (2018)
• LI-<$995
• LMI- $996- $3895
• UMI – $3896- $12055
• HI - >$12055
Various definitions
• Occupational Distribution and Sectoral distribution of
income
• objective criteria, measureable
• But not absolute- Pakistan , India- Agrarian, Brazil
, Chile not agrarian, Norway, Denmark- agrarian
• Indicate direction of economic growth or of the
direction of economic change but not always
help in measuring level of development
• Low per capita Income as indicator of
underdevelopment-
• UN experts have defined an underdeveloped country
as one whose per capital real income is less than that
of USA, Western Europe.
• But economic growth depends upon potential
resources, so comparison is not justified.
• Joan Robinson rightly asserts, “For several of the Arab
States, GNP per capita suddenly jumped to levels which
exceed that of the richest Western States, yet in these
countries are found some of the poorest and least
developed communities in the world.”
• Poverty based concept of underdevelopment
• Modern development economists now define development as a
process involving elimination of poverty, income inequalities and
unemployment. In this framework, underdevelopment is a situation
characterized by the worst kinds of deprivation.
• GOULET
“Underdevelopment is shocking: the squalor, disease, unnecessary
deaths, and hopelessness of it all! No man understands if
underdevelopment remains for him a mere statistics reflecting low
income, poor housing, premature mortality or underemployment.
The most emphatic observer can speak objectively about
underdevelopment only after undergoing, personally or vicariously,
the ‘shock of underdevelopment’.
• Development Potential and underdevelopment
• According to Jacob Viner, development potential of a country is a
much better criterion to judge the extent of its underdevelopment.
Therefore, he defines an underdeveloped country as the one
“which has good potential prospects for using more capital or more
labour or more available natural resources, or all of these, to
support its population on a higher level of living, or if its per capita
income level is already fairly high, to support a larger population on
a not lower level of living.”
• The Indian Planning Commission defines an underdeveloped
country as “one which is characterized by the coexistence, in
greater or less degree, of unutilized or underutilized manpower on
the one hand, and of unexploited natural resources on the other.”
Common Characteristics of
Underdeveloped Countries
1.Lower level of living and
productivity
• 84%of population ( including India and China
who progressed in recent past) received 46%
of world’s income in 2011.
• Ex. Nepal (2017)-$1048
• Somalia (2021)-$130
• Medagaskar (2021)- $520
Burkina Faso-(2021)- 780
Niger 600
Pop
ulou
s
GDP per
capita
(U.S. $),
2018
Income
group
Least
Populo
us
GNI per
capita
Income
group
USA 65118 HI Palau 15859 HI
Indo
nesi
a
4135 UMI Antigua
and
Barbud
a
17790 HI
Ban
glad
esh
1855 LMI Micron
esia
3568 LMI
No relation with population
Low productivity
Region Output per worker (thousands of
constant 2005 PPP-adjusted international
dollars)
Sub Saharan Africa 6
South Asia 9
Developing regions 15
Developed Regions 64
• Many of countries that can be called underdeveloped are in sub –Saharan region and
in south Asia.
• The productivity is low because of lack of capital, human capital and technology
• This is known as a poverty trap or what Nobel laureate
Gunnar Myrdal called “circular and cumulative causation”
2.Lower Level Of Human Capital-
health, education, skills
• Health-
• Under 5 mortality was 17 times higher in low
income countries (95) compared to high
income (6) in 2012.
– Central African Republic- Highest child mortality
(164/1000 live births)
• Sub Saharan Africa- AIDS HIV, Malaria, TB
Education-
Despite progress South Asia continues to have high level of illiteracy. South
Asia had literacy rate of 72% In 2016, yet it is home to half of the global
illiterate population
3. Higher Levels of Inequality and
Absolute Poverty
 Absolute Poverty- 1.2 billion people live in
extreme poverty (less than $1.25 per day). Top
priority of International development.
 Extreme poverty- highest in Africa and South
Asia, due to low human capital and political
and social exclusion
 Large majority of extremely poor live in sub
Saharan Africa and South Asia
• Political exclusion can include the denial of citizenship rights such as political
participation and the right to organise, and also of personal security, the rule of law,
freedom of expression and equality of opportunity. The political exclusion also
involves the notion that the state, which grants basic rights and civil liberties, is not
a neutral agency but a vehicle of a society’s dominant classes, and may thus
discriminate between social groups) –
– Myanmar's (Burma's) government excluded hundreds of thousands of
members of Burma's minorities from citizenship with a 1982
citizenship law. In the 1990s more than 250,000 Rohingya Muslims
denied citizenship fled to seek refuge in neighboring Bangladesh.
• Citizenship is restricted to the children of male nationals in many
countries of the Middle East, North Africa, and parts of Sub-
Saharan Africa, discouraging female citizens from marrying men
of a distinct ethnicity or nationality because their children would
be denied citizenship.
•
Absolute Poverty-Population (%)below
minimum level of existence
% of
population
with less than
$1.25
East Asia and
Pacific
9.1% South Asia 31.7
Latin America
and Caribbean
8.6 Sub Saharan 41.1
Middle East
and North
Africa
1.5
Extreme poverty represents great human misery, and so redressing it is
a top priority of international development. Development economists
have also increasingly focused on ways in which poverty and inequality
can lead to slower growth. That is, not only do poverty and inequality
result from distorted growth, but they can also cause it.
• Inequality - Poorest 20% receive 1.5% of world’s
income
• Difference in income (GDP per capita)
– Highest Income-Monaco $185741(2020)
– Lowest- Burundi $253 (2020)
• Myrdal- Vicious circle of Poverty
• Inequality within nations
– GINI Index 0 to 100
• Lesotho-63.2 (least developed country)
• South Africa 57.8 (high income country)
• Sierra Leone- 62.9 (least developed country)
• Parentage of consumption by poorest
10percent of the population
Lesotho-0.5%, South Africa-1.4, Sierra-o.5%
• Inequality is lower in South Asia.
• Inequality is more in all developing countries
than in developed but it is increasing in
Developed countries (USA in 2019-GINI index-
41.5%)
4. High Population Growth Rate
• Growth rate of Population-5/6th of population
live in developing countries.From 1990 to
2008, the population in low income countries
grew at 2.2%, middle income countries at1.3%
and High Income at 0.7%.
• High birth rate- Birth rate in Sub Sahara was
39 per 1000 population, four times that of the
high income countries.
• Consequence of high birth rate is high
dependency rate
Income group Childr
en/1
00
adult
s
Elderly per 100 adults Total
dependency
ratio
LI 66 6 72
MI 41 10 51
HI 26 23 41
No public support for children, savings and pension for elderly in high income categ
5.Greater Social Fractionalisation
• Low Income countries- ethnic, linguistic and other form of social
fractionalisation
• Civil strife
• Sub Saharan Africa- low schooling, political instability, underdeveloped
financial, insufficient infrastructure can be statistically explained by ethnic
diversity
• There are over 3,000 different ethnic groups speaking more than 2,100
different languages in all of Africa. The people there practice a variety of
religions, including Christianity, Islam, Judaism, Hinduism, and traditional
religions specific to their ethnic group. HAUSA, HUTU, IGBO
• Rohinga conflict in Mayanmar
• Inter ethnic conflicts- Afghanistan, Rwanda,
Mozambique, Somalia, Ethiopia, DRC
• Advanced societies that are culturally
homogeneous- Singapore, Taiwan
• Malaysia-Economic and social integration of
minorities- 50.1% Malay, 11.8% Indigenous,
22.6% Chinese, 6.8% Indian.
• Indigenous population remain
underdeveloped in Latin America
6.Larger Rural Populations but Rapid
Rural to Urban Migrations
Urban Population % (2018)
Underdeveloped
Countries/least developed
Afghanistan 25
Madagascar 24
Burundi 6
Chad
Developed Countries USA 82
Japan 91
Income groups LI 25
HI 74
7. Lower Levels of Industrialisation and
Manufactured Exports
country % of
population in
agriculture,
2008
Share of
GDP(%)
Agriculture
Share of
GDP(%)
Industry
Share of
GDP(%)
Services
Madagascar 82 25 17 57
Bangladesh 55 19 29 52
UK 1.5 1 24 76
USA 1.5 1 22 77
• Industrialisation is related with high productivity and
has been hall mark of modernisation national
economic power
• Structural transformation of employment
• Share of employment in industry in many developed
country is smaller than developing country. Shift to
service sector
• Lower industrialisation+ higher dependence on
primary exports- many underdeveloped countries
especially in Africa remain highly dependent on and
relatively small number of agricultural and mineral
export
8.Adverse Geography- Location and
resources
• Tropical vs Subtropical location
• Resource endowment
– Favourable- oil rich Persian Gulf states
– DRC- Rich mineral wealth but no development-
’curse of natural resources’
– Bangladesh, Chad, Yemen- little resources
(mineral and fertile land)
• Singapore- adverse geography but
development
9. Underdeveloped Markets
• Imperfect market and incomplete information
• Lack favourable atmosphere for businesses
– A stable and trustworthy currency
– A legal system that enforces contracts and
validates property rights
– Well developed and regulated system of banking
– Infrastructure of roads and utilities
10. Lingering Colonial Impact and
Unequal International Relations
• Colonial legacy- exploitation of resources and people
(forced labour)- eg mita system in Peru and Bolivia.
• Legal and other institution build to exploit local people
• European colonisation created or reinforced different
degrees of inequality mainly based on ethnicity- stable
over centuries.
• After decolonisation, the postcolonial elites took over
the exploitative role.
• Long lasting effect on political and institutional
structure- India’s political and judicial system
• External Dependence
• Economic dependence- less influence in international
relations, policies of international agencies in favour of
developed countries- agricultural subsidies to rich
countries, one-sided regulation of intellectual property
rights
• Cultural dependence– news, entertainment, life style,
social values
• Environmental dependence

Concept of Underdevelopment and development.pptx

  • 1.
  • 2.
    Definition of Underdevelopment •Since world war II, interest in underdevelopment, yet difficult to define • Nature of economies, levels of technological development, development potential, political organisation of different countries are different • Difficult to divide the world into developed and developing and underdeveloped countries.
  • 3.
    Developed Underdeveloped/developi ng Western Europe NorthAmerica Japan Singapore Australia New Zealand Sub Saharan Africa North Africa and Middle East Asia (except Japan, South Korea) Latin America and Caribbean Eastern Europe and Central Asia Eastern Europe and Central Asia- transition economies BRICS- Brazil, Russia, India, China and South Africa- Emerging economies
  • 4.
    • North-South, Thirdworld, underdeveloped, developing, less developed, least developed, Newly Industrialised countries • HDI Classification • Least Developed countries recognised by UN- lowest indicators of socio- economic development • low income • Low Human capital • High Economic vulnerability • 2018- 47 countries, mostly in Sub Saharan Africa, some in Asia (Afghanistan among others) and Pacific Islands). • Vast differences within Developing. World bank’s income categories - LI,LMI, UMI, HI World Bank (2018) • LI-<$995 • LMI- $996- $3895 • UMI – $3896- $12055 • HI - >$12055
  • 6.
    Various definitions • OccupationalDistribution and Sectoral distribution of income • objective criteria, measureable • But not absolute- Pakistan , India- Agrarian, Brazil , Chile not agrarian, Norway, Denmark- agrarian • Indicate direction of economic growth or of the direction of economic change but not always help in measuring level of development
  • 7.
    • Low percapita Income as indicator of underdevelopment- • UN experts have defined an underdeveloped country as one whose per capital real income is less than that of USA, Western Europe. • But economic growth depends upon potential resources, so comparison is not justified. • Joan Robinson rightly asserts, “For several of the Arab States, GNP per capita suddenly jumped to levels which exceed that of the richest Western States, yet in these countries are found some of the poorest and least developed communities in the world.”
  • 8.
    • Poverty basedconcept of underdevelopment • Modern development economists now define development as a process involving elimination of poverty, income inequalities and unemployment. In this framework, underdevelopment is a situation characterized by the worst kinds of deprivation. • GOULET “Underdevelopment is shocking: the squalor, disease, unnecessary deaths, and hopelessness of it all! No man understands if underdevelopment remains for him a mere statistics reflecting low income, poor housing, premature mortality or underemployment. The most emphatic observer can speak objectively about underdevelopment only after undergoing, personally or vicariously, the ‘shock of underdevelopment’.
  • 9.
    • Development Potentialand underdevelopment • According to Jacob Viner, development potential of a country is a much better criterion to judge the extent of its underdevelopment. Therefore, he defines an underdeveloped country as the one “which has good potential prospects for using more capital or more labour or more available natural resources, or all of these, to support its population on a higher level of living, or if its per capita income level is already fairly high, to support a larger population on a not lower level of living.” • The Indian Planning Commission defines an underdeveloped country as “one which is characterized by the coexistence, in greater or less degree, of unutilized or underutilized manpower on the one hand, and of unexploited natural resources on the other.”
  • 10.
  • 11.
    1.Lower level ofliving and productivity • 84%of population ( including India and China who progressed in recent past) received 46% of world’s income in 2011. • Ex. Nepal (2017)-$1048 • Somalia (2021)-$130 • Medagaskar (2021)- $520 Burkina Faso-(2021)- 780 Niger 600
  • 12.
    Pop ulou s GDP per capita (U.S. $), 2018 Income group Least Populo us GNIper capita Income group USA 65118 HI Palau 15859 HI Indo nesi a 4135 UMI Antigua and Barbud a 17790 HI Ban glad esh 1855 LMI Micron esia 3568 LMI No relation with population
  • 13.
    Low productivity Region Outputper worker (thousands of constant 2005 PPP-adjusted international dollars) Sub Saharan Africa 6 South Asia 9 Developing regions 15 Developed Regions 64 • Many of countries that can be called underdeveloped are in sub –Saharan region and in south Asia. • The productivity is low because of lack of capital, human capital and technology • This is known as a poverty trap or what Nobel laureate Gunnar Myrdal called “circular and cumulative causation”
  • 14.
    2.Lower Level OfHuman Capital- health, education, skills • Health- • Under 5 mortality was 17 times higher in low income countries (95) compared to high income (6) in 2012. – Central African Republic- Highest child mortality (164/1000 live births) • Sub Saharan Africa- AIDS HIV, Malaria, TB
  • 15.
    Education- Despite progress SouthAsia continues to have high level of illiteracy. South Asia had literacy rate of 72% In 2016, yet it is home to half of the global illiterate population
  • 16.
    3. Higher Levelsof Inequality and Absolute Poverty  Absolute Poverty- 1.2 billion people live in extreme poverty (less than $1.25 per day). Top priority of International development.  Extreme poverty- highest in Africa and South Asia, due to low human capital and political and social exclusion  Large majority of extremely poor live in sub Saharan Africa and South Asia
  • 17.
    • Political exclusioncan include the denial of citizenship rights such as political participation and the right to organise, and also of personal security, the rule of law, freedom of expression and equality of opportunity. The political exclusion also involves the notion that the state, which grants basic rights and civil liberties, is not a neutral agency but a vehicle of a society’s dominant classes, and may thus discriminate between social groups) – – Myanmar's (Burma's) government excluded hundreds of thousands of members of Burma's minorities from citizenship with a 1982 citizenship law. In the 1990s more than 250,000 Rohingya Muslims denied citizenship fled to seek refuge in neighboring Bangladesh. • Citizenship is restricted to the children of male nationals in many countries of the Middle East, North Africa, and parts of Sub- Saharan Africa, discouraging female citizens from marrying men of a distinct ethnicity or nationality because their children would be denied citizenship. •
  • 18.
    Absolute Poverty-Population (%)below minimumlevel of existence % of population with less than $1.25 East Asia and Pacific 9.1% South Asia 31.7 Latin America and Caribbean 8.6 Sub Saharan 41.1 Middle East and North Africa 1.5 Extreme poverty represents great human misery, and so redressing it is a top priority of international development. Development economists have also increasingly focused on ways in which poverty and inequality can lead to slower growth. That is, not only do poverty and inequality result from distorted growth, but they can also cause it.
  • 19.
    • Inequality -Poorest 20% receive 1.5% of world’s income • Difference in income (GDP per capita) – Highest Income-Monaco $185741(2020) – Lowest- Burundi $253 (2020) • Myrdal- Vicious circle of Poverty • Inequality within nations – GINI Index 0 to 100 • Lesotho-63.2 (least developed country) • South Africa 57.8 (high income country) • Sierra Leone- 62.9 (least developed country)
  • 20.
    • Parentage ofconsumption by poorest 10percent of the population Lesotho-0.5%, South Africa-1.4, Sierra-o.5% • Inequality is lower in South Asia. • Inequality is more in all developing countries than in developed but it is increasing in Developed countries (USA in 2019-GINI index- 41.5%)
  • 21.
    4. High PopulationGrowth Rate • Growth rate of Population-5/6th of population live in developing countries.From 1990 to 2008, the population in low income countries grew at 2.2%, middle income countries at1.3% and High Income at 0.7%. • High birth rate- Birth rate in Sub Sahara was 39 per 1000 population, four times that of the high income countries.
  • 23.
    • Consequence ofhigh birth rate is high dependency rate Income group Childr en/1 00 adult s Elderly per 100 adults Total dependency ratio LI 66 6 72 MI 41 10 51 HI 26 23 41 No public support for children, savings and pension for elderly in high income categ
  • 24.
    5.Greater Social Fractionalisation •Low Income countries- ethnic, linguistic and other form of social fractionalisation • Civil strife • Sub Saharan Africa- low schooling, political instability, underdeveloped financial, insufficient infrastructure can be statistically explained by ethnic diversity • There are over 3,000 different ethnic groups speaking more than 2,100 different languages in all of Africa. The people there practice a variety of religions, including Christianity, Islam, Judaism, Hinduism, and traditional religions specific to their ethnic group. HAUSA, HUTU, IGBO • Rohinga conflict in Mayanmar
  • 25.
    • Inter ethnicconflicts- Afghanistan, Rwanda, Mozambique, Somalia, Ethiopia, DRC • Advanced societies that are culturally homogeneous- Singapore, Taiwan • Malaysia-Economic and social integration of minorities- 50.1% Malay, 11.8% Indigenous, 22.6% Chinese, 6.8% Indian. • Indigenous population remain underdeveloped in Latin America
  • 26.
    6.Larger Rural Populationsbut Rapid Rural to Urban Migrations
  • 27.
    Urban Population %(2018) Underdeveloped Countries/least developed Afghanistan 25 Madagascar 24 Burundi 6 Chad Developed Countries USA 82 Japan 91 Income groups LI 25 HI 74
  • 28.
    7. Lower Levelsof Industrialisation and Manufactured Exports country % of population in agriculture, 2008 Share of GDP(%) Agriculture Share of GDP(%) Industry Share of GDP(%) Services Madagascar 82 25 17 57 Bangladesh 55 19 29 52 UK 1.5 1 24 76 USA 1.5 1 22 77
  • 29.
    • Industrialisation isrelated with high productivity and has been hall mark of modernisation national economic power • Structural transformation of employment • Share of employment in industry in many developed country is smaller than developing country. Shift to service sector • Lower industrialisation+ higher dependence on primary exports- many underdeveloped countries especially in Africa remain highly dependent on and relatively small number of agricultural and mineral export
  • 30.
    8.Adverse Geography- Locationand resources • Tropical vs Subtropical location • Resource endowment – Favourable- oil rich Persian Gulf states – DRC- Rich mineral wealth but no development- ’curse of natural resources’ – Bangladesh, Chad, Yemen- little resources (mineral and fertile land) • Singapore- adverse geography but development
  • 31.
    9. Underdeveloped Markets •Imperfect market and incomplete information • Lack favourable atmosphere for businesses – A stable and trustworthy currency – A legal system that enforces contracts and validates property rights – Well developed and regulated system of banking – Infrastructure of roads and utilities
  • 32.
    10. Lingering ColonialImpact and Unequal International Relations • Colonial legacy- exploitation of resources and people (forced labour)- eg mita system in Peru and Bolivia. • Legal and other institution build to exploit local people • European colonisation created or reinforced different degrees of inequality mainly based on ethnicity- stable over centuries. • After decolonisation, the postcolonial elites took over the exploitative role. • Long lasting effect on political and institutional structure- India’s political and judicial system
  • 33.
    • External Dependence •Economic dependence- less influence in international relations, policies of international agencies in favour of developed countries- agricultural subsidies to rich countries, one-sided regulation of intellectual property rights • Cultural dependence– news, entertainment, life style, social values • Environmental dependence