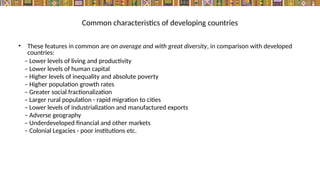
Common characteristics ofdeveloping countries
• These features in common are on average and with great diversity, in comparison with developed
countries:
– Lower levels of living and productivity
– Lower levels of human capital
– Higher levels of inequality and absolute poverty
– Higher population growth rates
– Greater social fractionalization
– Larger rural population - rapid migration to cities
– Lower levels of industrialization and manufactured exports
– Adverse geography
– Underdeveloped financial and other markets
– Colonial Legacies - poor institutions etc.
4.
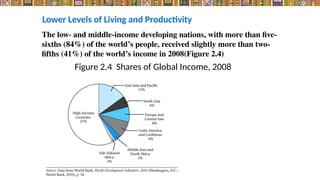
Figure 2.4 Sharesof Global Income, 2008
The low- and middle-income developing nations, with more than five-
sixths (84%) of the world’s people, received slightly more than two-
fifths (41%) of the world’s income in 2008(Figure 2.4)
Lower Levels of Living and Productivity
5.
• Income leadsto low investment in education and
health as well as plant and equipment and
infrastructure, which in turn leads to low
productivity and economic stagnation.
6.
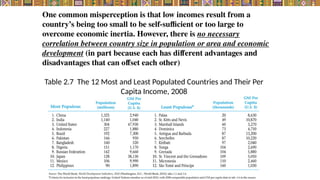
Table 2.7 The12 Most and Least Populated Countries and Their Per
Capita Income, 2008
One common misperception is that low incomes result from a
country’s being too small to be self-sufficient or too large to
overcome economic inertia. However, there is no necessary
correlation between country size in population or area and economic
development (in part because each has different advantages and
disadvantages that can offset each other)
7.
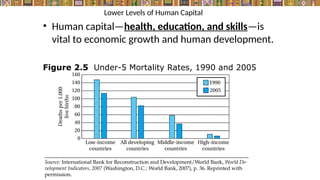
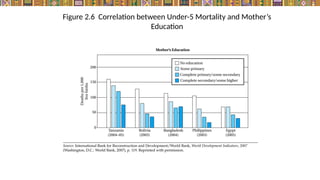
Lower Levels ofHuman Capital
• Human capital—health, education, and skills—is
vital to economic growth and human development.
Figure 2.5 Under-5 Mortality Rates, 1990 and 2005
8.
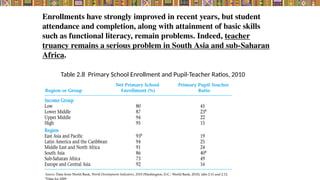
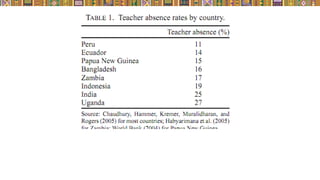
Table 2.8 PrimarySchool Enrollment and Pupil-Teacher Ratios, 2010
Enrollments have strongly improved in recent years, but student
attendance and completion, along with attainment of basic skills
such as functional literacy, remain problems. Indeed, teacher
truancy remains a serious problem in South Asia and sub-Saharan
Africa.
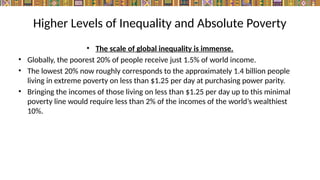
Higher Levels ofInequality and Absolute Poverty
• The scale of global inequality is immense.
• Globally, the poorest 20% of people receive just 1.5% of world income.
• The lowest 20% now roughly corresponds to the approximately 1.4 billion people
living in extreme poverty on less than $1.25 per day at purchasing power parity.
• Bringing the incomes of those living on less than $1.25 per day up to this minimal
poverty line would require less than 2% of the incomes of the world’s wealthiest
10%.
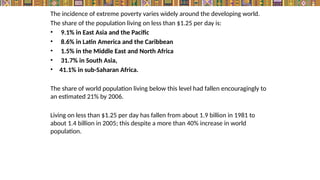
The incidence ofextreme poverty varies widely around the developing world.
The share of the population living on less than $1.25 per day is:
• 9.1% in East Asia and the Pacific
• 8.6% in Latin America and the Caribbean
• 1.5% in the Middle East and North Africa
• 31.7% in South Asia,
• 41.1% in sub-Saharan Africa.
The share of world population living below this level had fallen encouragingly to
an estimated 21% by 2006.
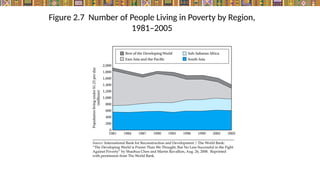
Living on less than $1.25 per day has fallen from about 1.9 billion in 1981 to
about 1.4 billion in 2005; this despite a more than 40% increase in world
population.
14.
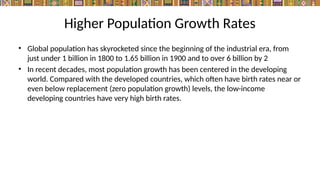
Higher Population GrowthRates
• Global population has skyrocketed since the beginning of the industrial era, from
just under 1 billion in 1800 to 1.65 billion in 1900 and to over 6 billion by 2
• In recent decades, most population growth has been centered in the developing
world. Compared with the developed countries, which often have birth rates near or
even below replacement (zero population growth) levels, the low-income
developing countries have very high birth rates.
15.
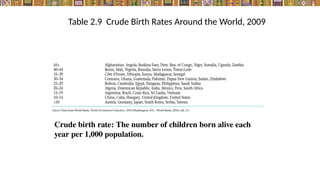
Table 2.9 CrudeBirth Rates Around the World, 2009
Crude birth rate: The number of children born alive each
year per 1,000 population.
16.
Populations of somedeveloping countries, particularly in Africa,
continue to grow rapidly.
From 1990 to 2008, population in the low-income countries grew at
2.2% per year, compared to 1.3% in the middle-income countries
(the high-income countries grew at 0.7% per year, reflecting both
births and immigration).
A major implication of high birth rates is that the active labor force
has to support proportionally almost twice as many children as it
does in richer countries.
Both older people (65+) and children(0 to 15) are often referred to
as an economic dependency burden in the sense that they must be
supported financially by the country’s labor force
17.
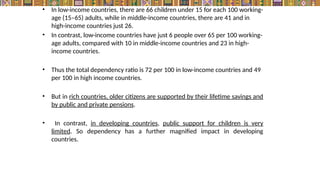
• In low-incomecountries, there are 66 children under 15 for each 100 working-
age (15–65) adults, while in middle-income countries, there are 41 and in
high-income countries just 26.
• In contrast, low-income countries have just 6 people over 65 per 100 working-
age adults, compared with 10 in middle-income countries and 23 in high-
income countries.
• Thus the total dependency ratio is 72 per 100 in low-income countries and 49
per 100 in high income countries.
• But in rich countries, older citizens are supported by their lifetime savings and
by public and private pensions.
• In contrast, in developing countries, public support for children is very
limited. So dependency has a further magnified impact in developing
countries.
18.
Greater Social Fractionalization
Low-incomecountries often have ethnic, linguistic,
and other forms of social divisions, sometimes
known as fractionalization.
• Civil strife
• Violent conflict
• Governance challenges
The greater the ethnic, linguistic, and religious
diversity of a country, the more likely it is that
there will be internal strife and political instability.
19.
• The mostsuccessful development experiences—
South Korea, Taiwan, Singapore Hong Kong—have
occurred in culturally homogeneous societies.
• Ethnic and religious conflicts leading to
widespread death and destruction have taken
place in countries as diverse as
• Afghanistan, Rwanda, Mozambique, Guatemala, Mexico, Sri Lanka, Iraq, India,
Kyrgyzstan, Azerbaijan, Somalia, Ethiopia, Liberia, Sierra Leone, Angola, Myanmar,
Sudan, the former Yugoslavia, Indonesia, and the Democratic Republic of Congo.
20.
There have beennumerous instances of successful economic and social
integration of minority or indigenous ethnic populations in countries as
diverse as: Malaysia and Mauritius.
In the United States, diversity is often cited as a source of creativity and
innovation.
The broader point is that the ethnic and religious composition of a
developing nation and whether or not that diversity leads to conflict
or cooperation can be important determinants of the failure or success
of development efforts.
Alesina, Alberto, et al, 2003. " Fractionalization," Journal of Economic
Growth, Springer, vol. 8(2), pages 155-94.
21.
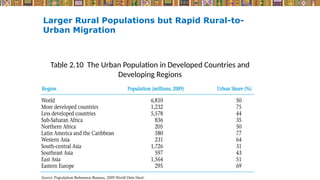
Table 2.10 TheUrban Population in Developed Countries and
Developing Regions
Larger Rural Populations but Rapid Rural-to-
Urban Migration
22.
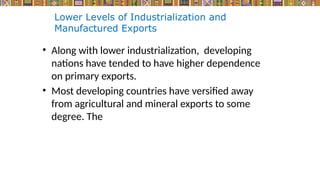
Lower Levels ofIndustrialization and
Manufactured Exports
• Along with lower industrialization, developing
nations have tended to have higher dependence
on primary exports.
• Most developing countries have versified away
from agricultural and mineral exports to some
degree. The
23.
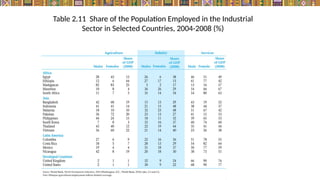
Table 2.11 Shareof the Population Employed in the Industrial
Sector in Selected Countries, 2004-2008 (%)
24.
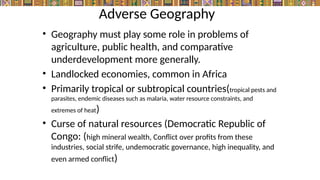
Adverse Geography
• Geographymust play some role in problems of
agriculture, public health, and comparative
underdevelopment more generally.
• Landlocked economies, common in Africa
• Primarily tropical or subtropical countries(tropical pests and
parasites, endemic diseases such as malaria, water resource constraints, and
extremes of heat)
• Curse of natural resources (Democratic Republic of
Congo: (high mineral wealth, Conflict over profits from these
industries, social strife, undemocratic governance, high inequality, and
even armed conflict)
25.
• The oil-richPersian Gulf states.
• Chad, Yemen, Haiti and Bangladesh
• Geography is not destiny.
High-income Singapore lies almost directly on the
equator, and parts of southern India have exhibited
enormous economic dynamism in recent years.
26.
Underdeveloped Markets
-Imperfect markets
-incomplete information
Causes: Domestic and financial markets have worked Less efficiently.
Thin markets for many products due to limited demand and few
sellers, widespread externalities (costs or benefits that accrue to
companies or individuals not doing the producing or consuming) in
production and consumption, and poorly regulated common property
resources (e.g., fisheries, grazing lands, water holes) mean that
markets are often highly imperfect.
Moreover, information is limited and costly to obtain, thereby often
causing goods, finances, and resources to be misallocated.
27.
Some aspects ofmarket underdevelopment are that
they often lack:
1- A legal system that enforces contracts and validates property rights;
2- A stable and trustworthy currency;
3- An infrastructure of roads and utilities that results in
low transport and communication costs so as to facilitate interregional
trade;
4- a well-developed and efficiently regulated system of banking and
insurance, with broad access and with formal credit markets that select
projects and allocate loanable funds on the basis of relative economic
profitability and enforce rules of repayment
28.
5- substantial marketinformation for consumers and producers
about prices, quantities, and qualities of products and resources
as well as the creditworthiness of potential borrowers.
6- social norms that facilitate successful long-term business
relationships.