Most Essential Learning
Competency:
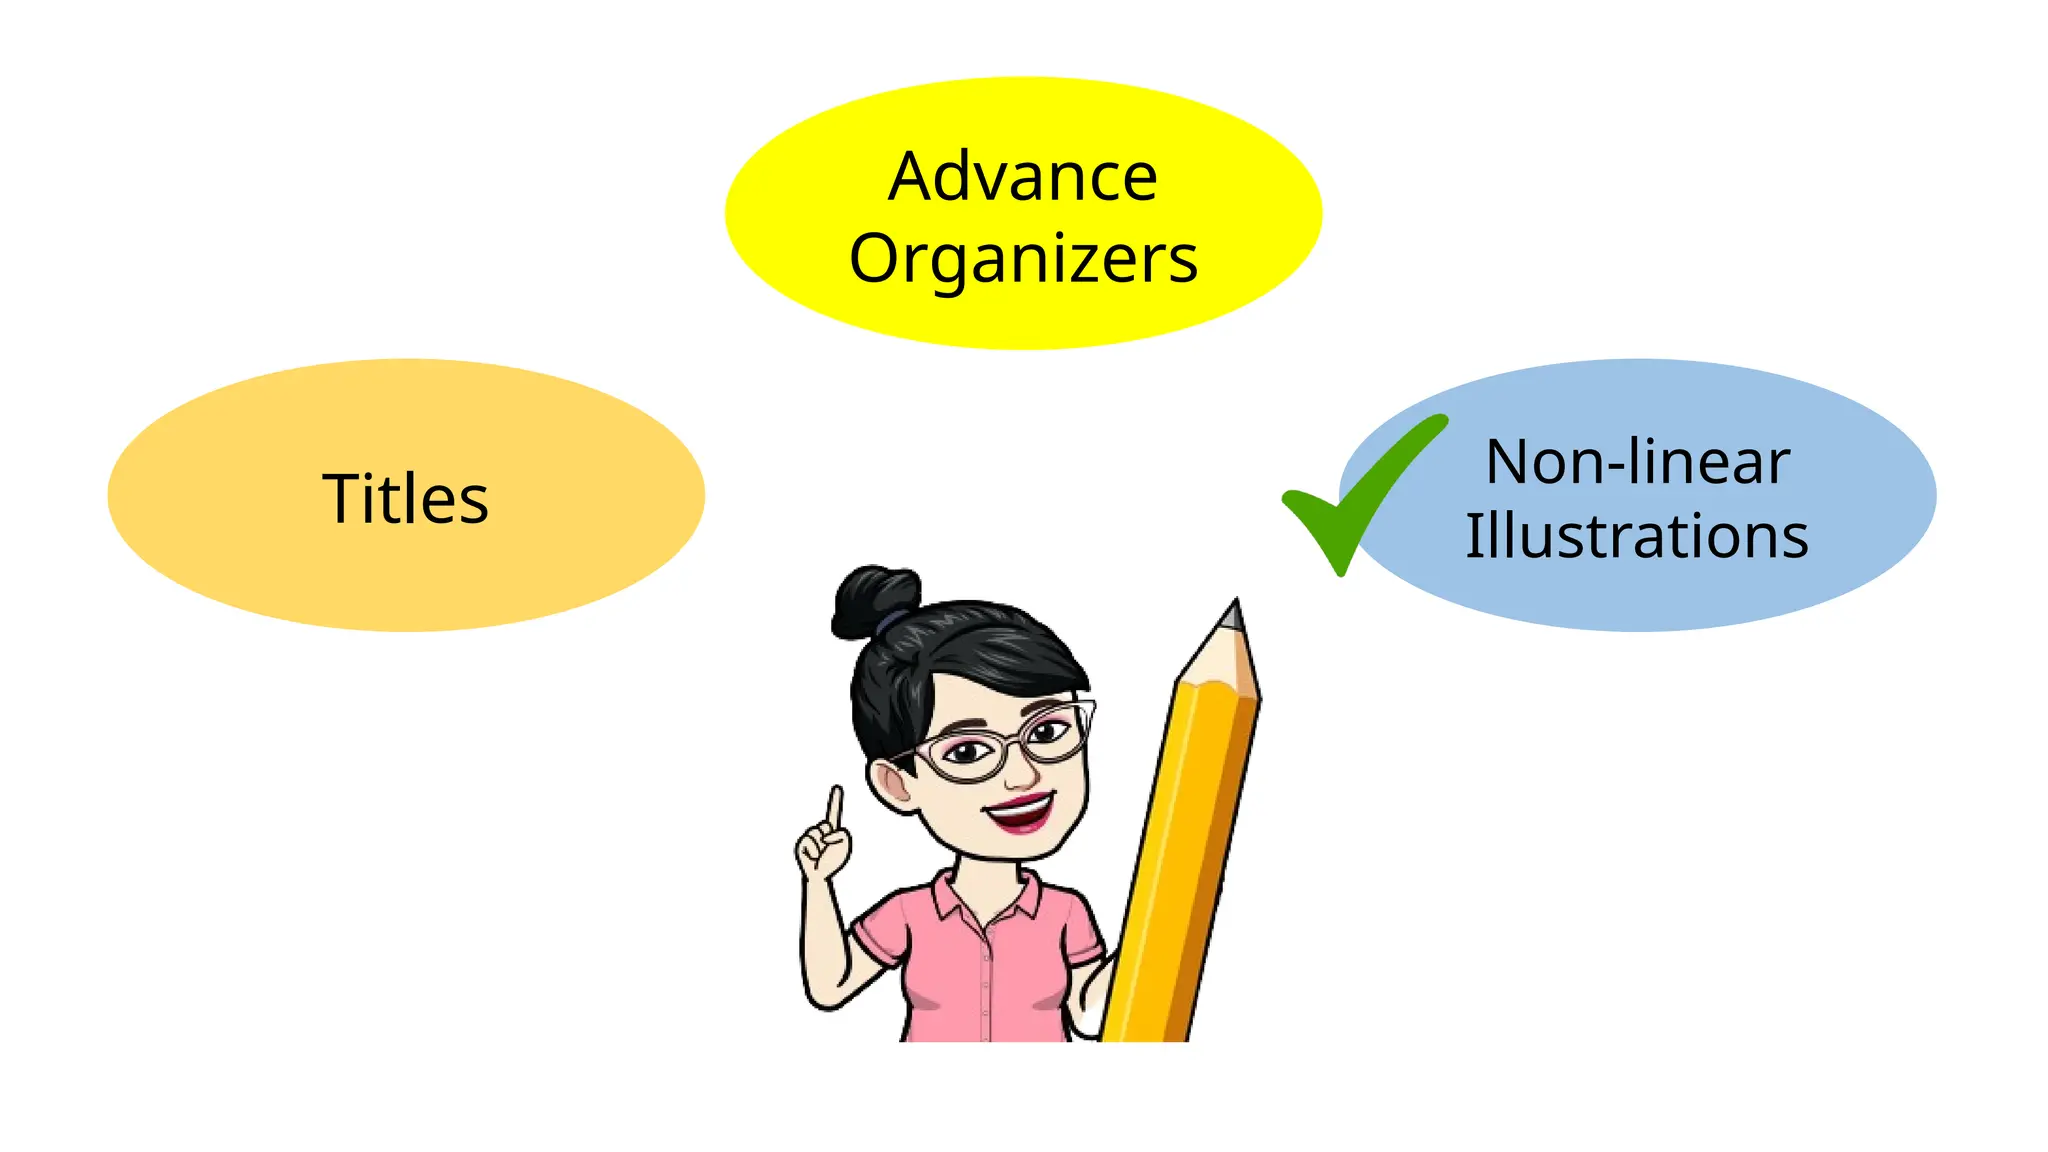
Determinethe effect of textual
aids like advance organizers,
titles, non-linear illustrations, etc.
on the understanding of a text.
EN10RC-Ia-2.15.2
5.
Objectives:
While going throughthis lesson, you are
expected to have:
1. use various textual aids in understanding
a text; and
2. determine the effect of these textual aids
in understanding a text.
6.
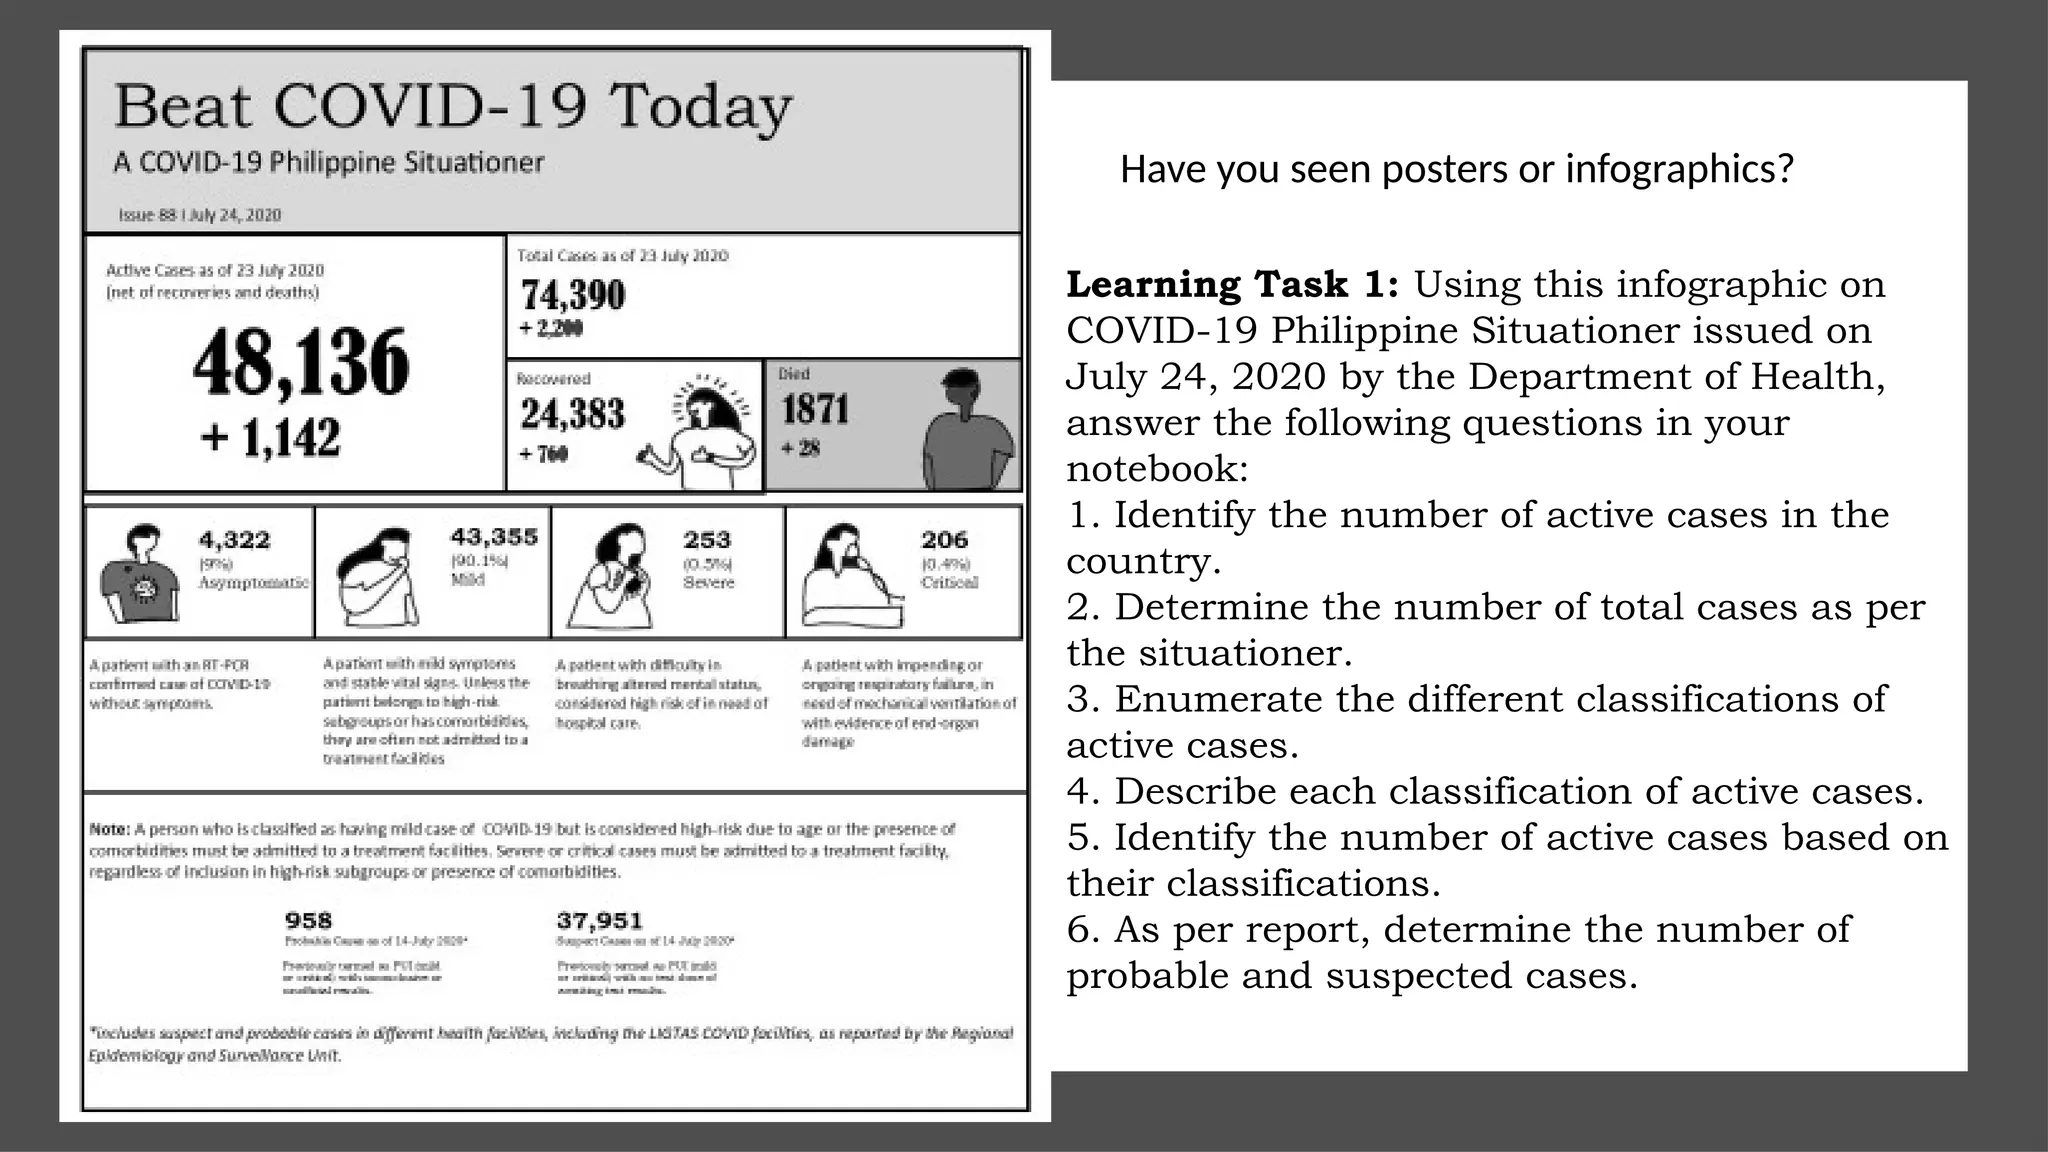
Have you seenposters or infographics?
Learning Task 1: Using this infographic on
COVID-19 Philippine Situationer issued on
July 24, 2020 by the Department of Health,
answer the following questions in your
notebook:
1. Identify the number of active cases in the
country.
2. Determine the number of total cases as per
the situationer.
3. Enumerate the different classifications of
active cases.
4. Describe each classification of active cases.
5. Identify the number of active cases based on
their classifications.
6. As per report, determine the number of
probable and suspected cases.
8.
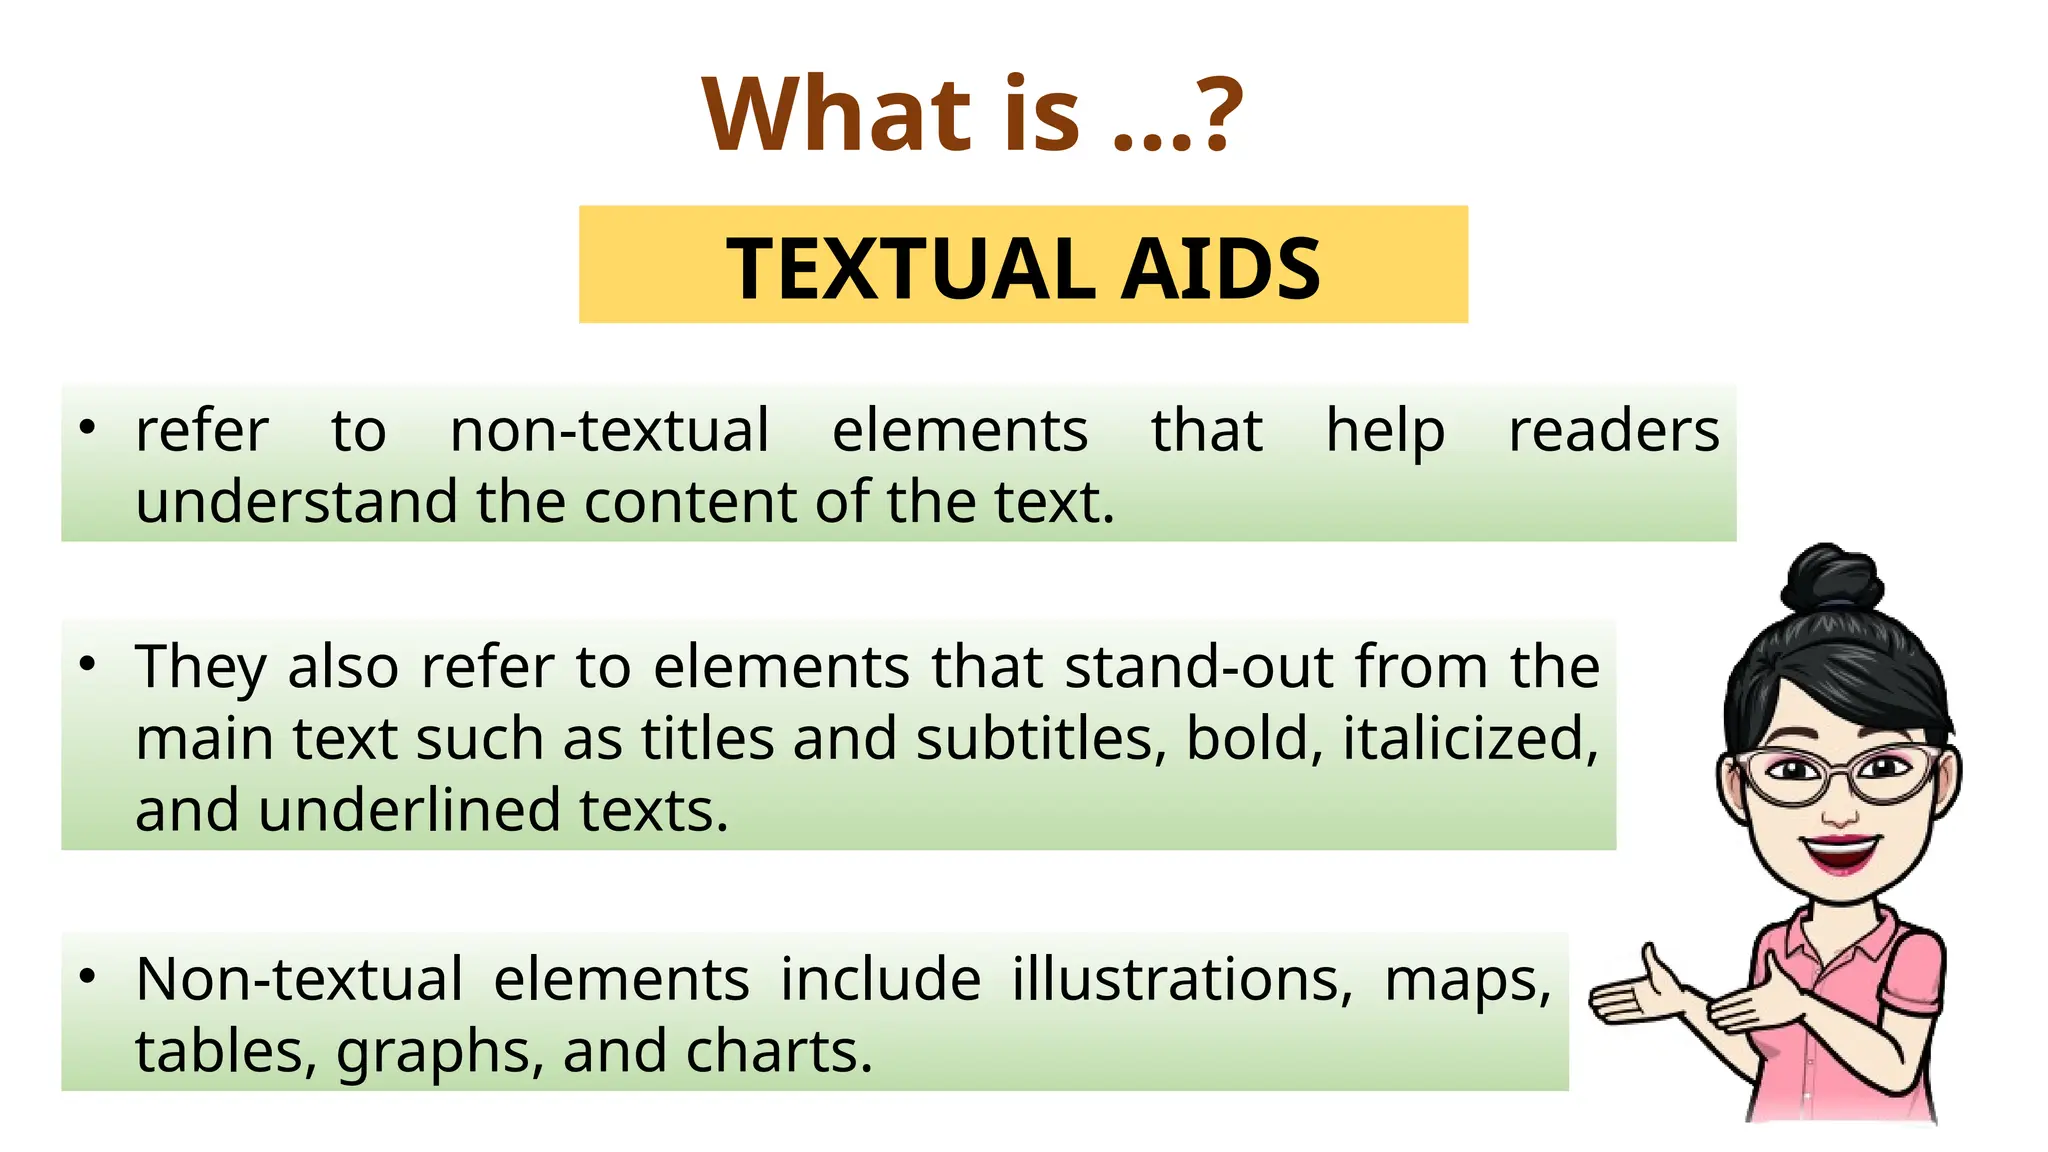
What is …?
TEXTUALAIDS
• refer to non-textual elements that help readers
understand the content of the text.
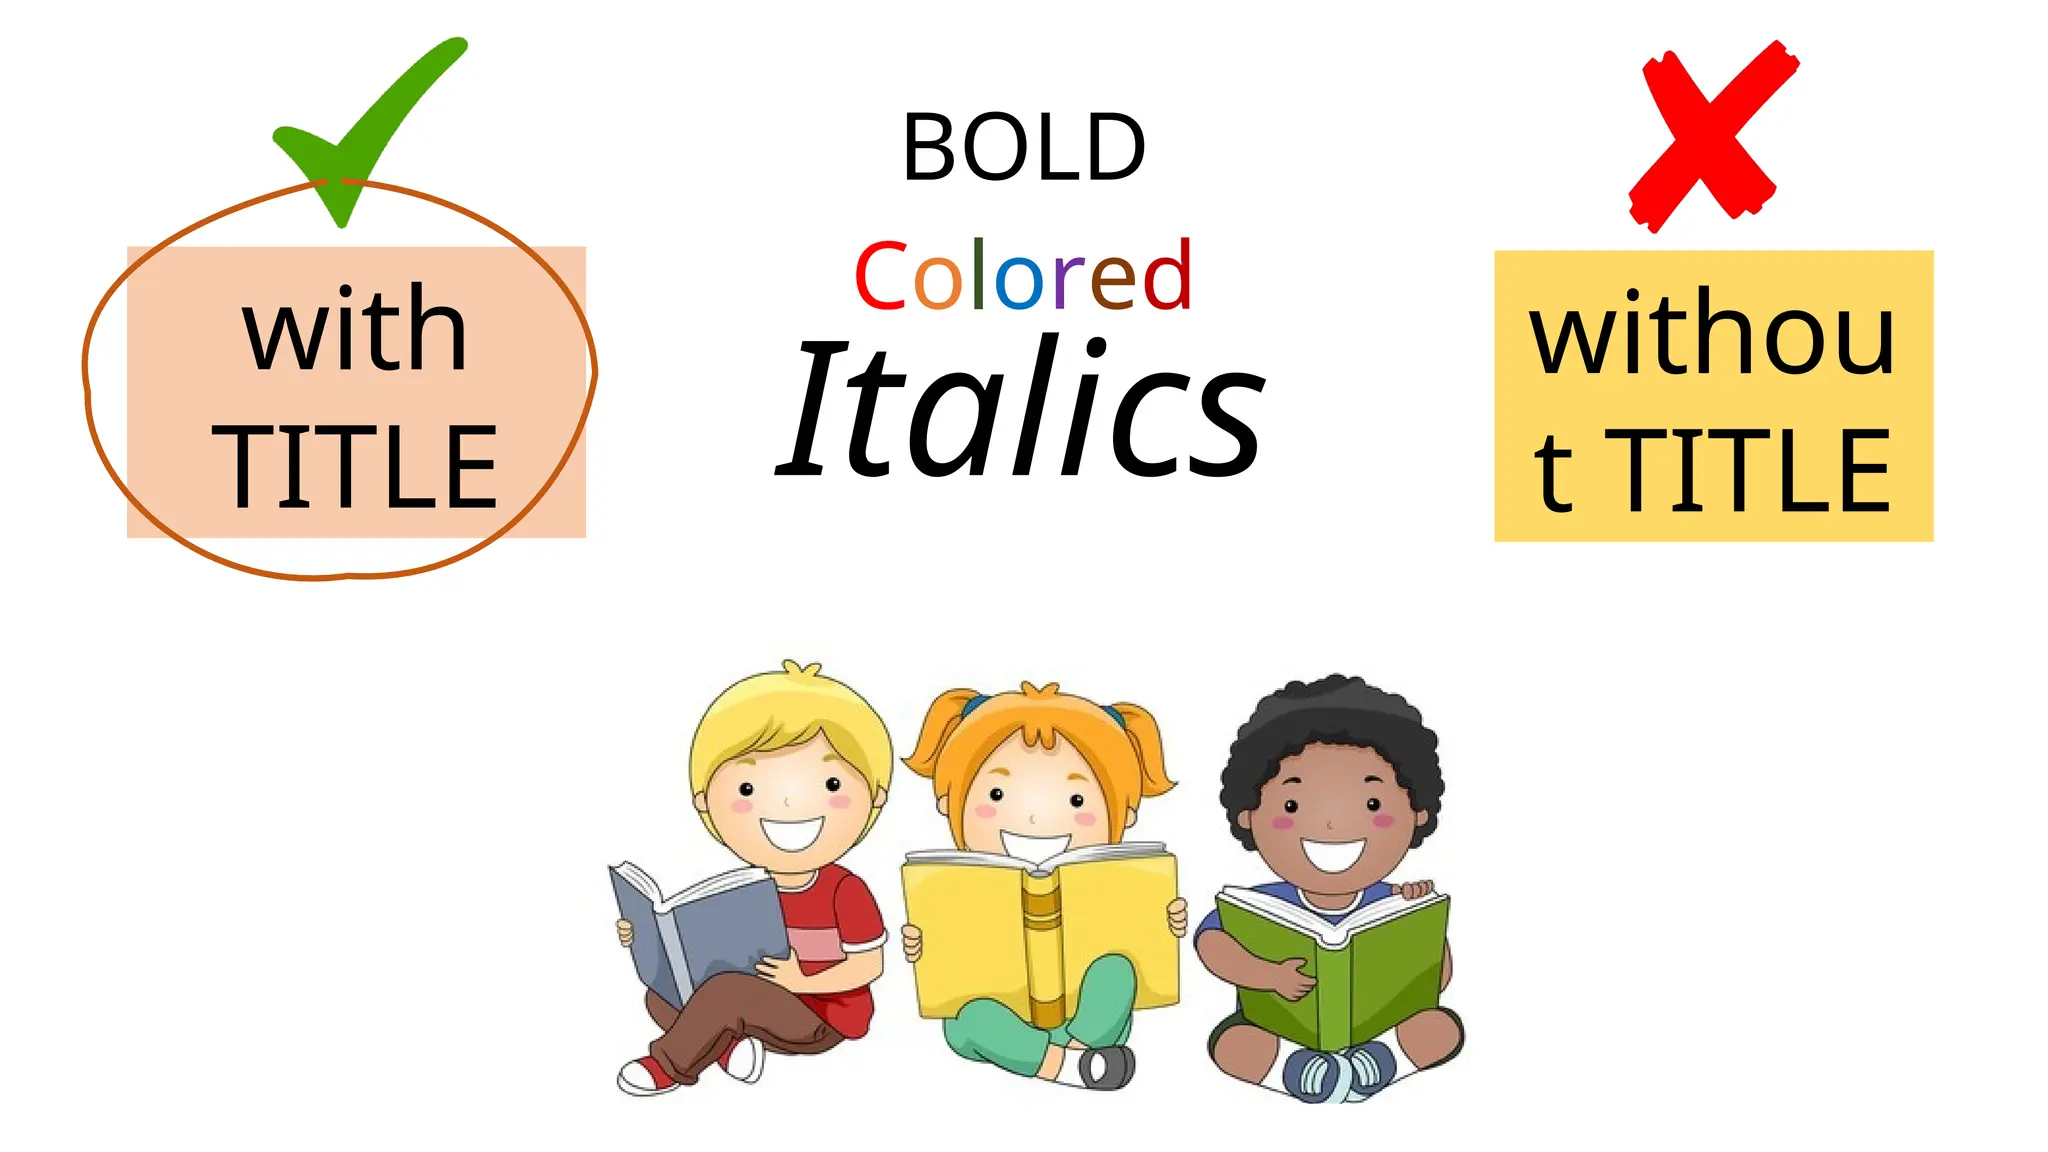
• They also refer to elements that stand-out from the
main text such as titles and subtitles, bold, italicized,
and underlined texts.
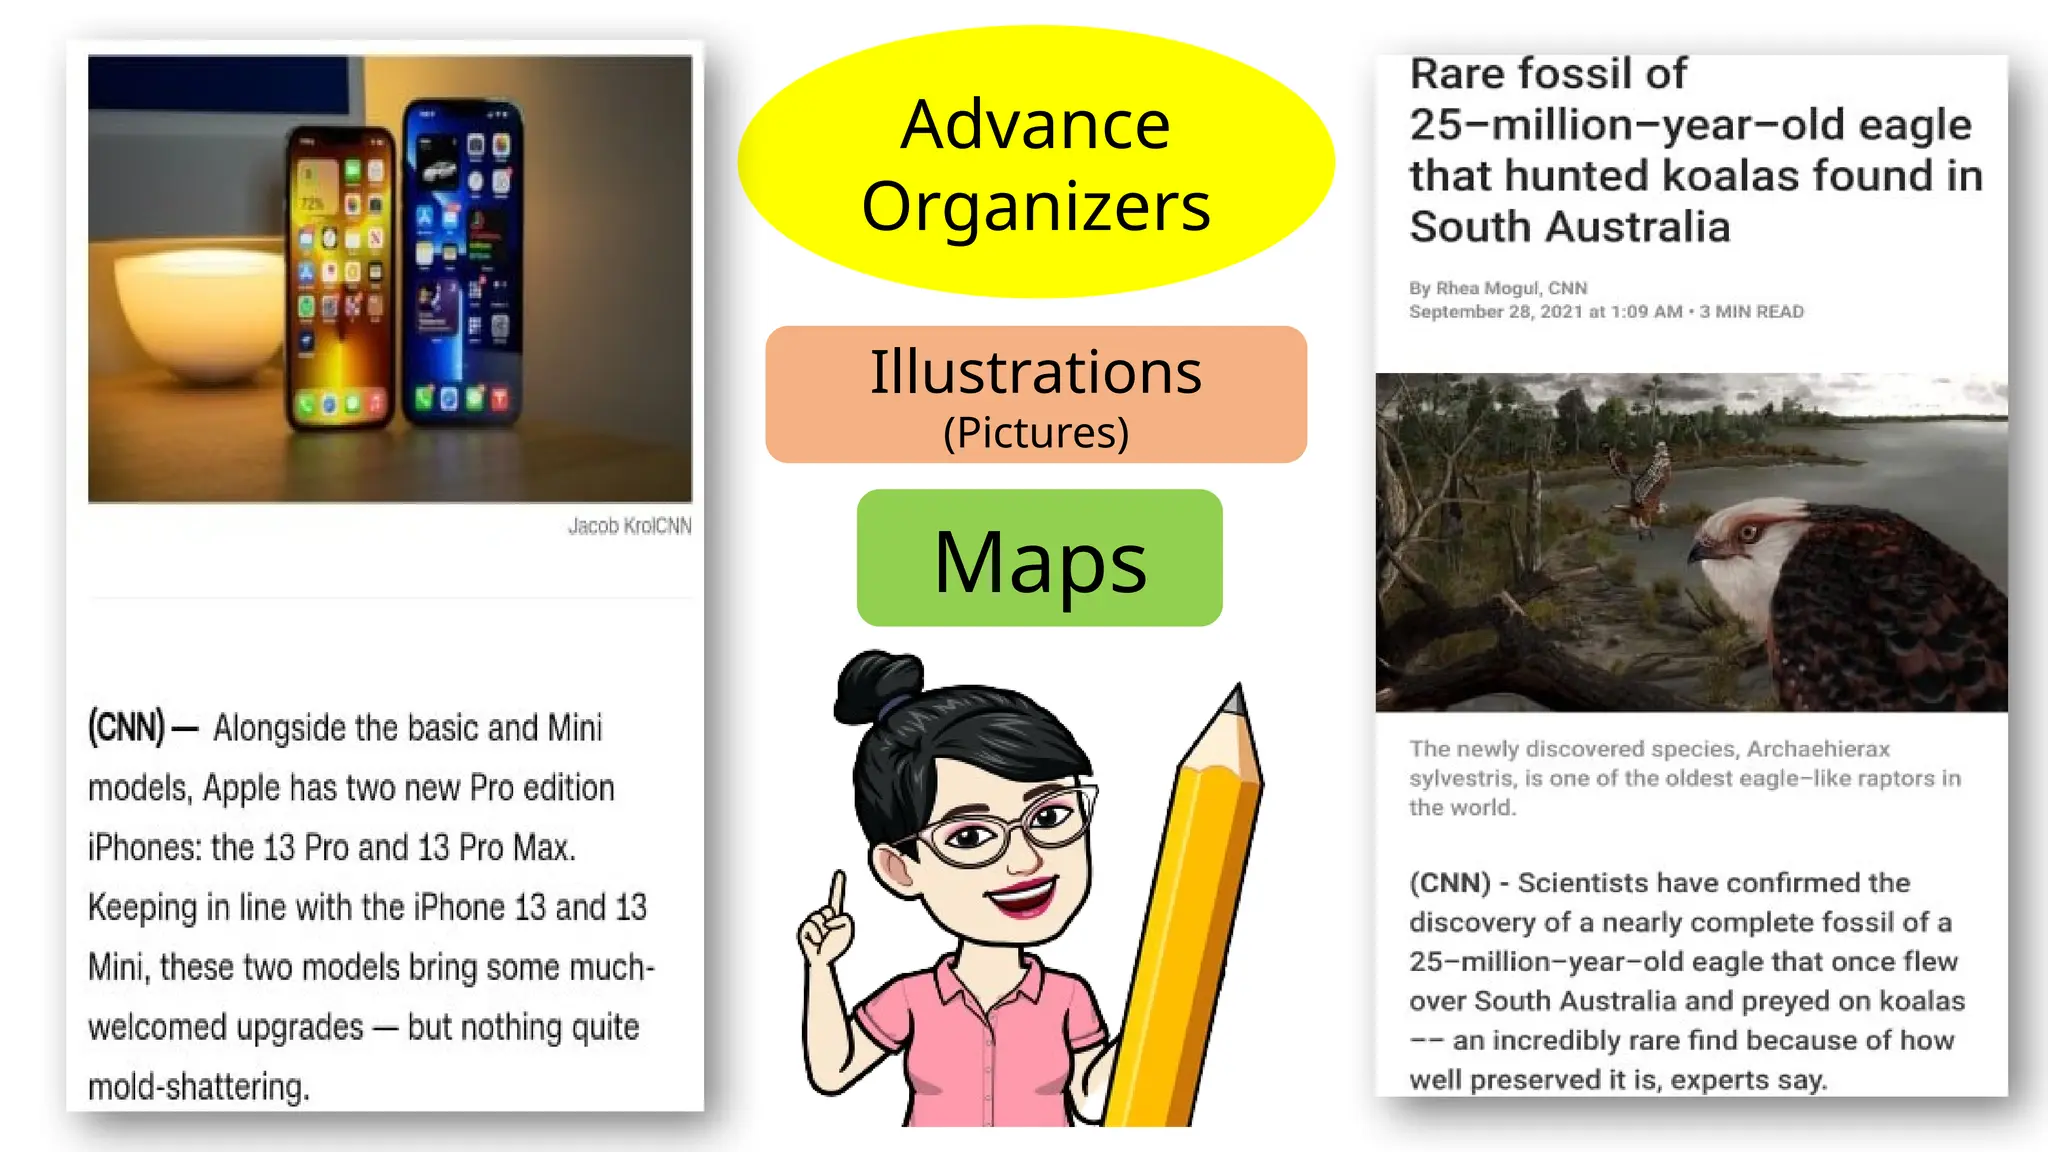
• Non-textual elements include illustrations, maps,
tables, graphs, and charts.
9.
What are thefunctions of
Textual Aids?
To direct readers’
attention to
important ideas in
the text
to provide more
information as a
supplement to what
is already written.
10.
LINEAR AND NON-LINEARTEXTS
The difference between a linear text and nonlinear text
is the reading path. A linear text is a traditional text
that needs to be read from beginning to end to make
sense of the text. Examples of linear texts are short
stories, novels, letters, and educational texts.
A nonlinear text, on the other hand, is not required to
be read from beginning to end since its reading path is
non-sequential. In assisting the readers, visual aids
such as graphic organizers, concept maps, diagrams,
and charts are used.
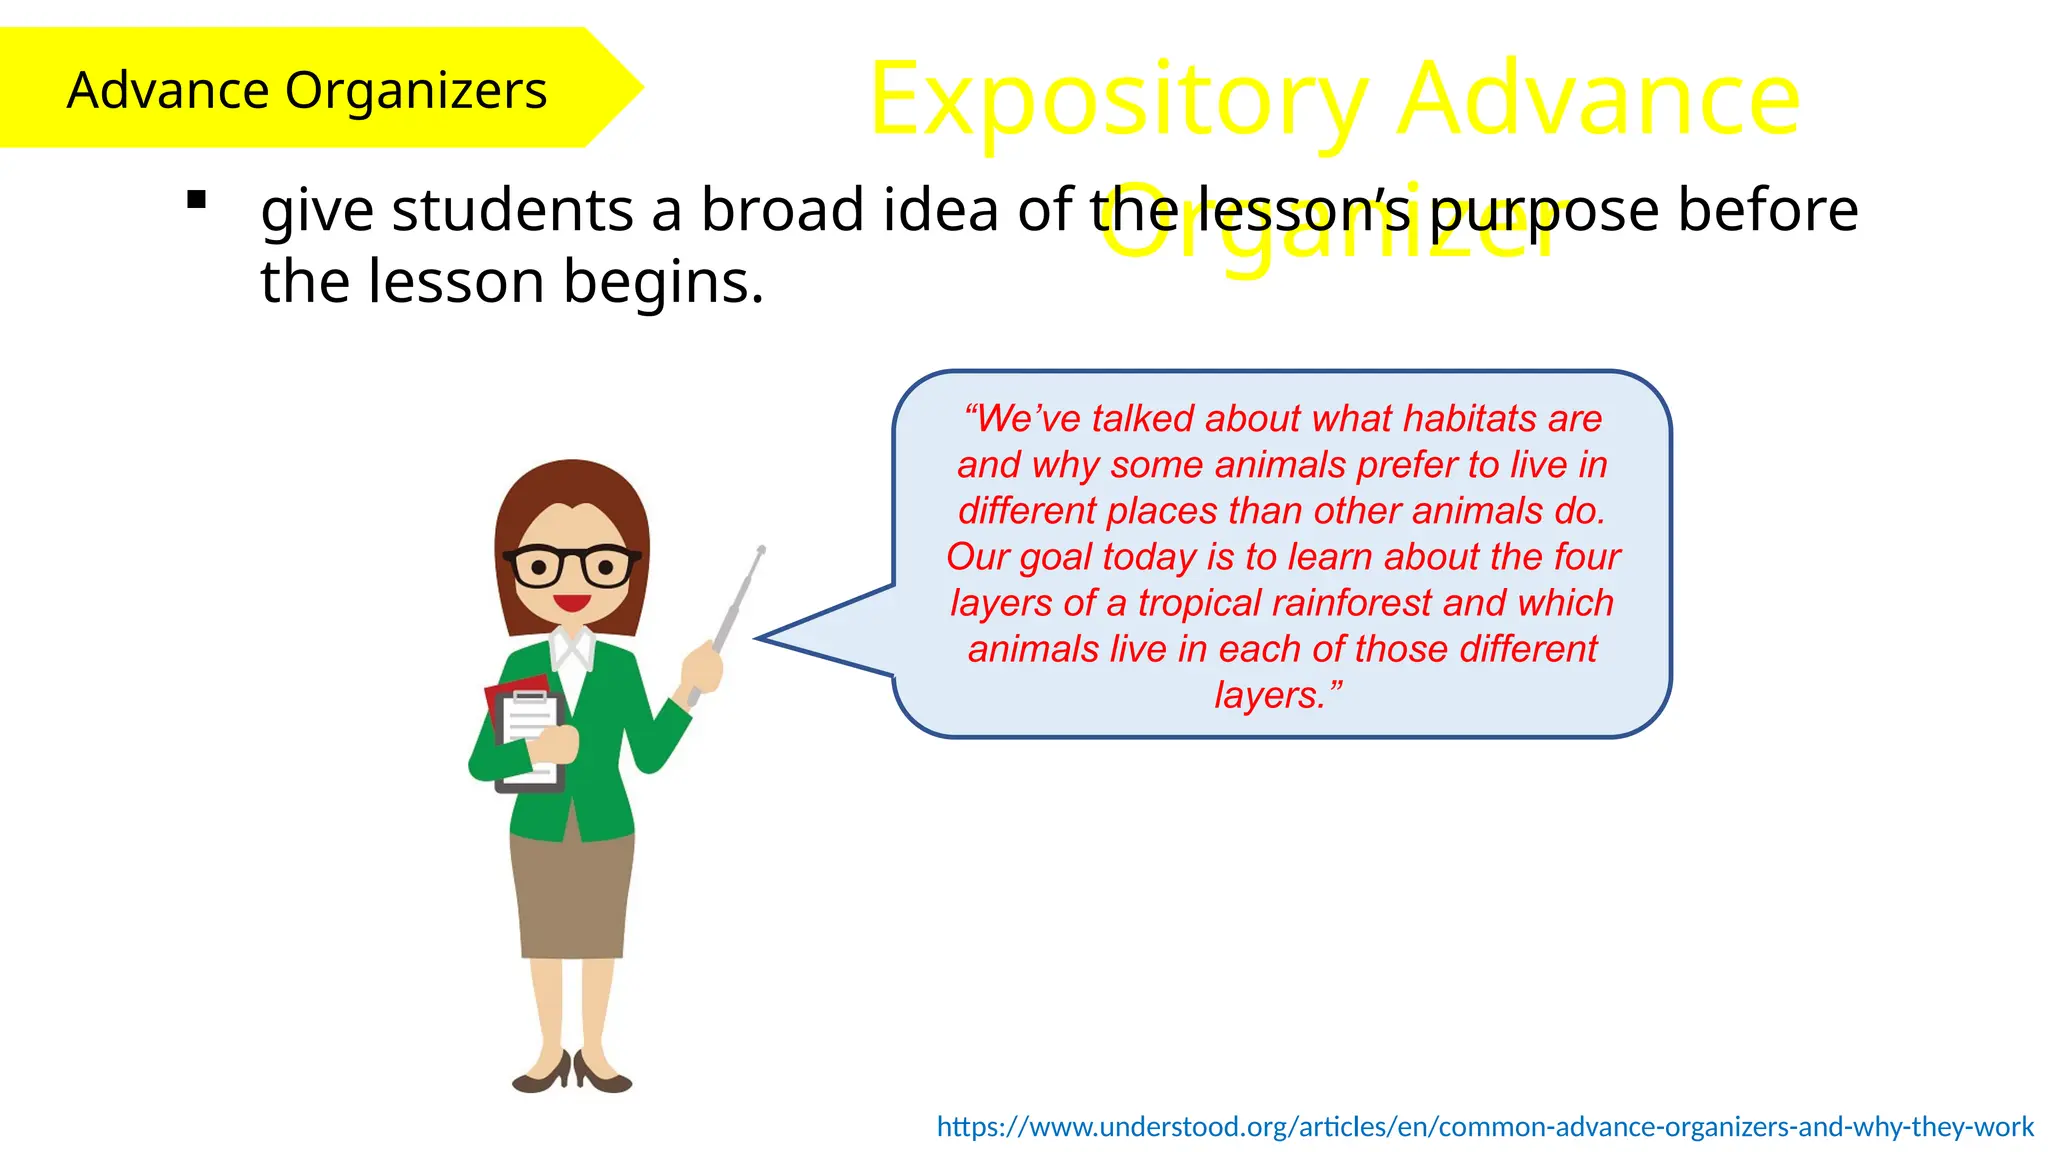
Advance Organizers ExpositoryAdvance
Organizer
give students a broad idea of the lesson’s purpose before
the lesson begins.
“We’ve talked about what habitats are
and why some animals prefer to live in
different places than other animals do.
Our goal today is to learn about the four
layers of a tropical rainforest and which
animals live in each of those different
layers.”
https://www.understood.org/articles/en/common-advance-organizers-and-why-they-work
14.
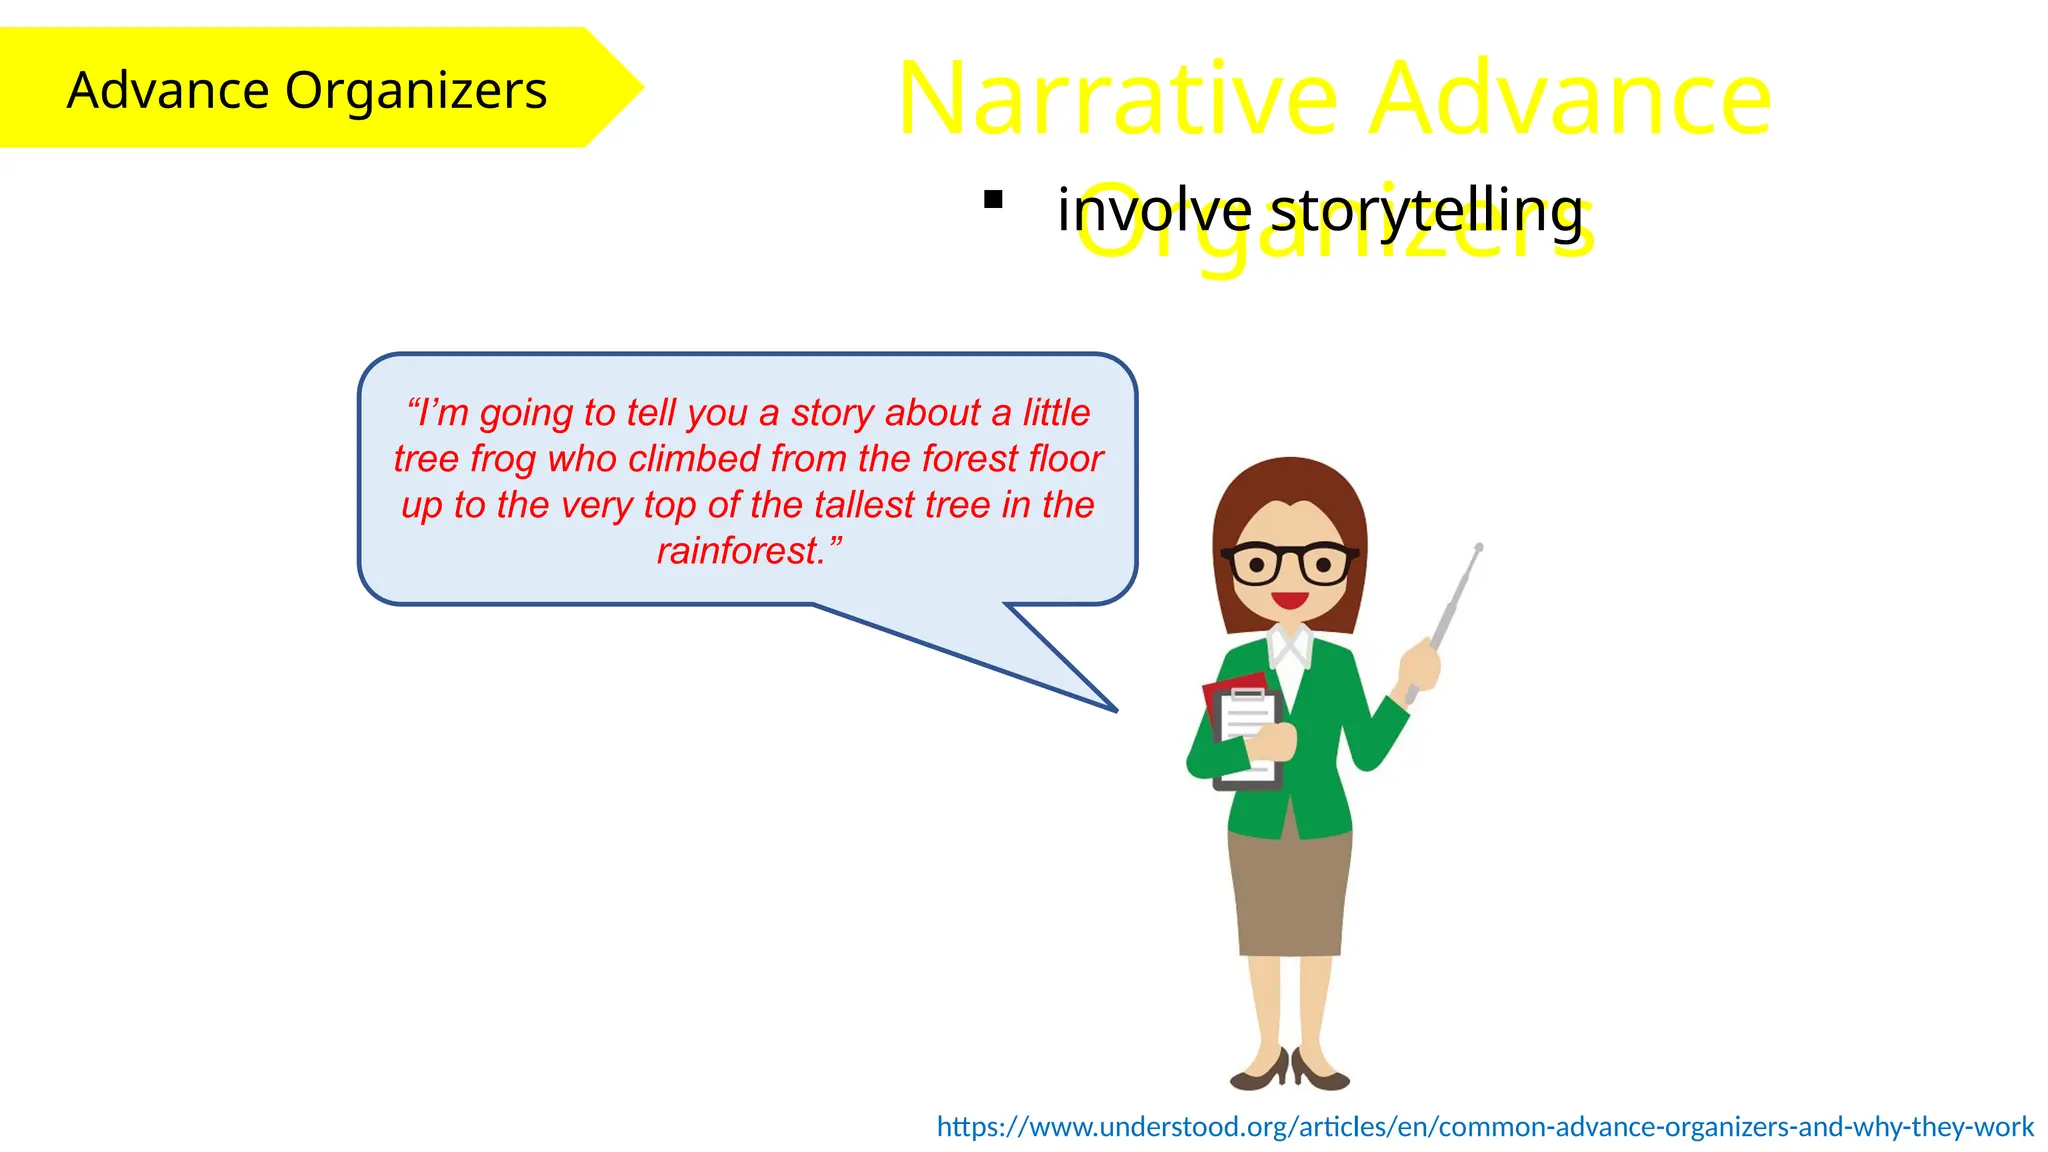
Advance Organizers NarrativeAdvance
Organizers
involve storytelling
“I’m going to tell you a story about a little
tree frog who climbed from the forest floor
up to the very top of the tallest tree in the
rainforest.”
https://www.understood.org/articles/en/common-advance-organizers-and-why-they-work
15.
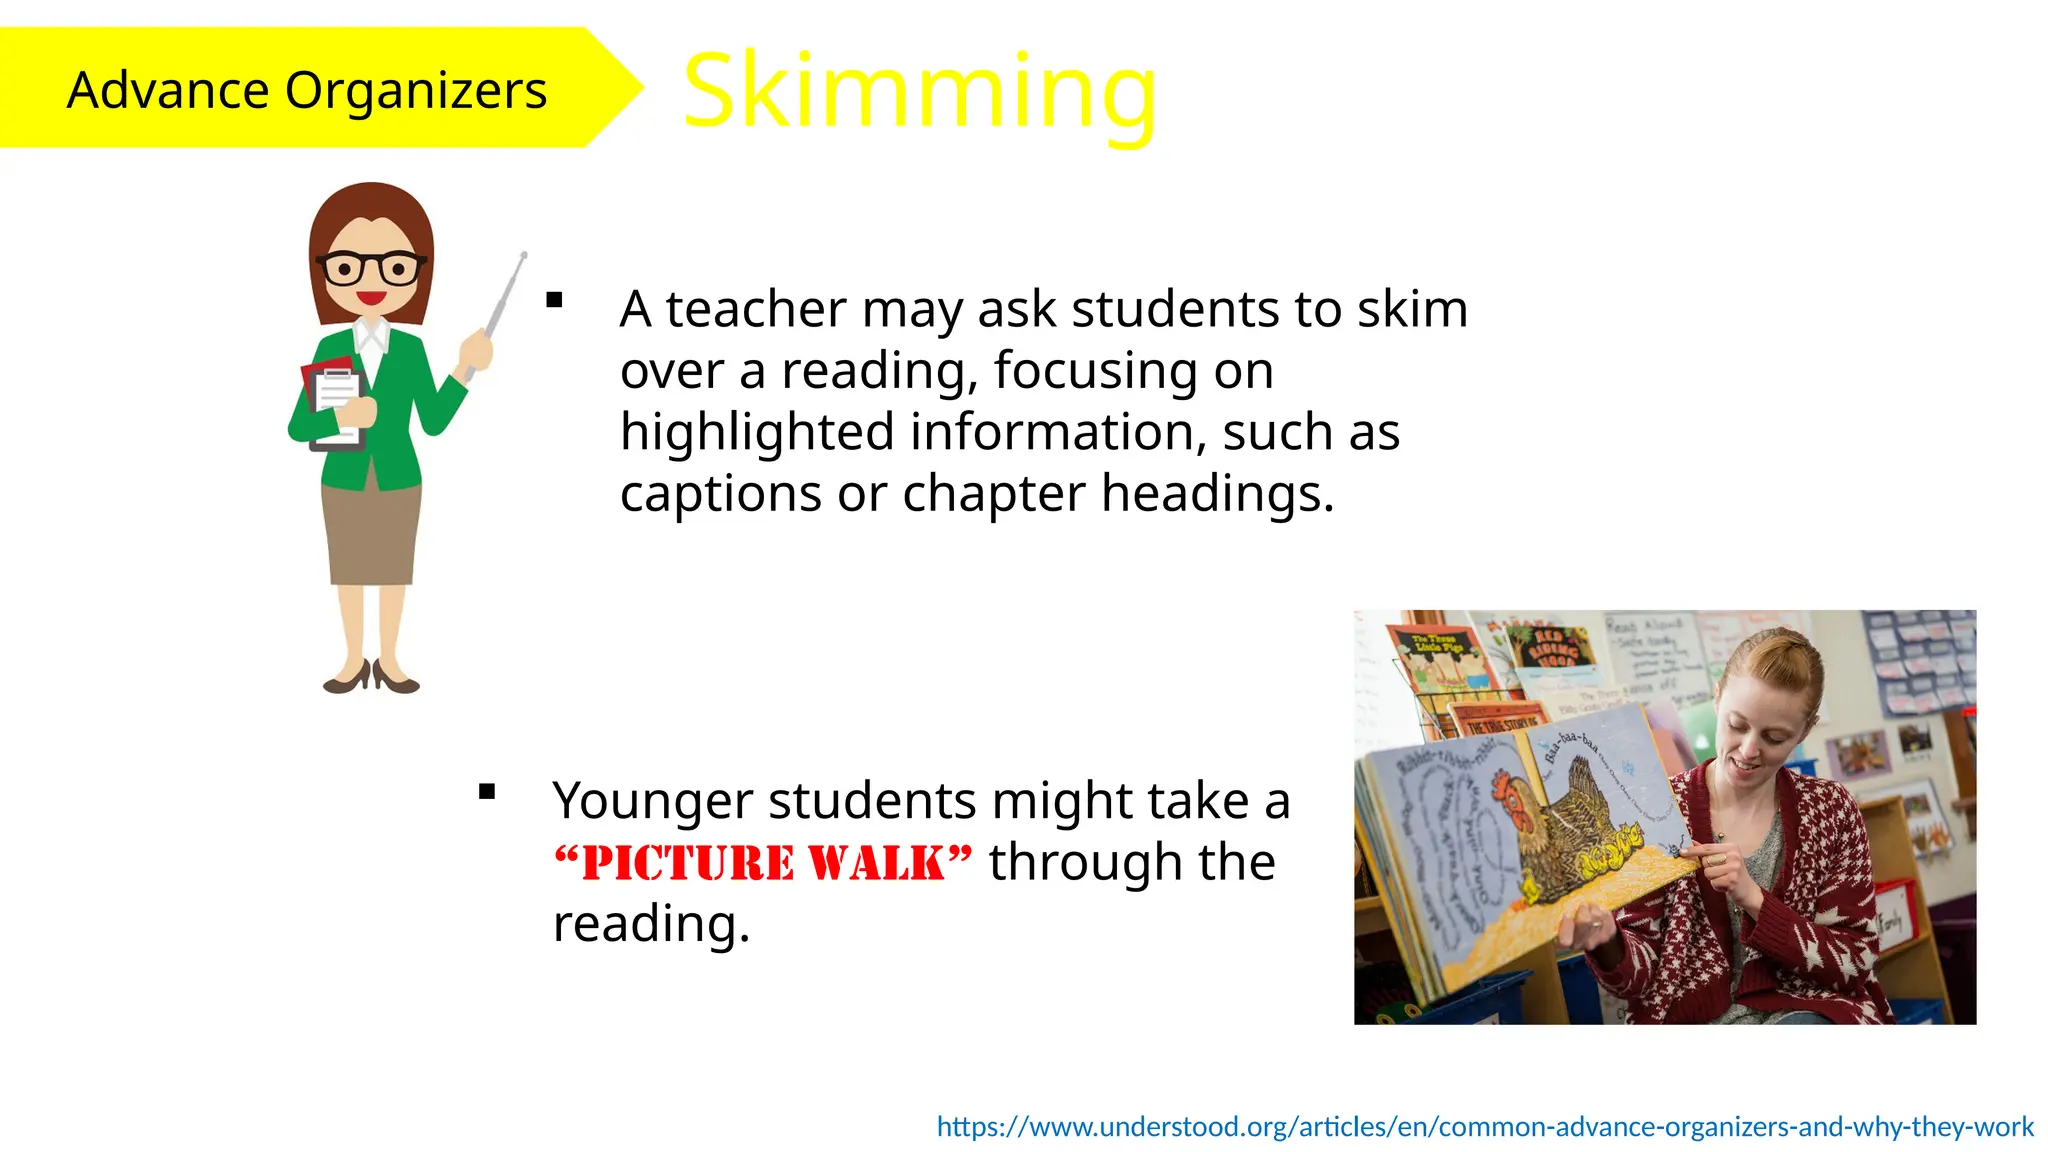
Advance Organizers Skimming
A teacher may ask students to skim
over a reading, focusing on
highlighted information, such as
captions or chapter headings.
https://www.understood.org/articles/en/common-advance-organizers-and-why-they-work
Younger students might take a
“picture walk” through the
reading.
16.
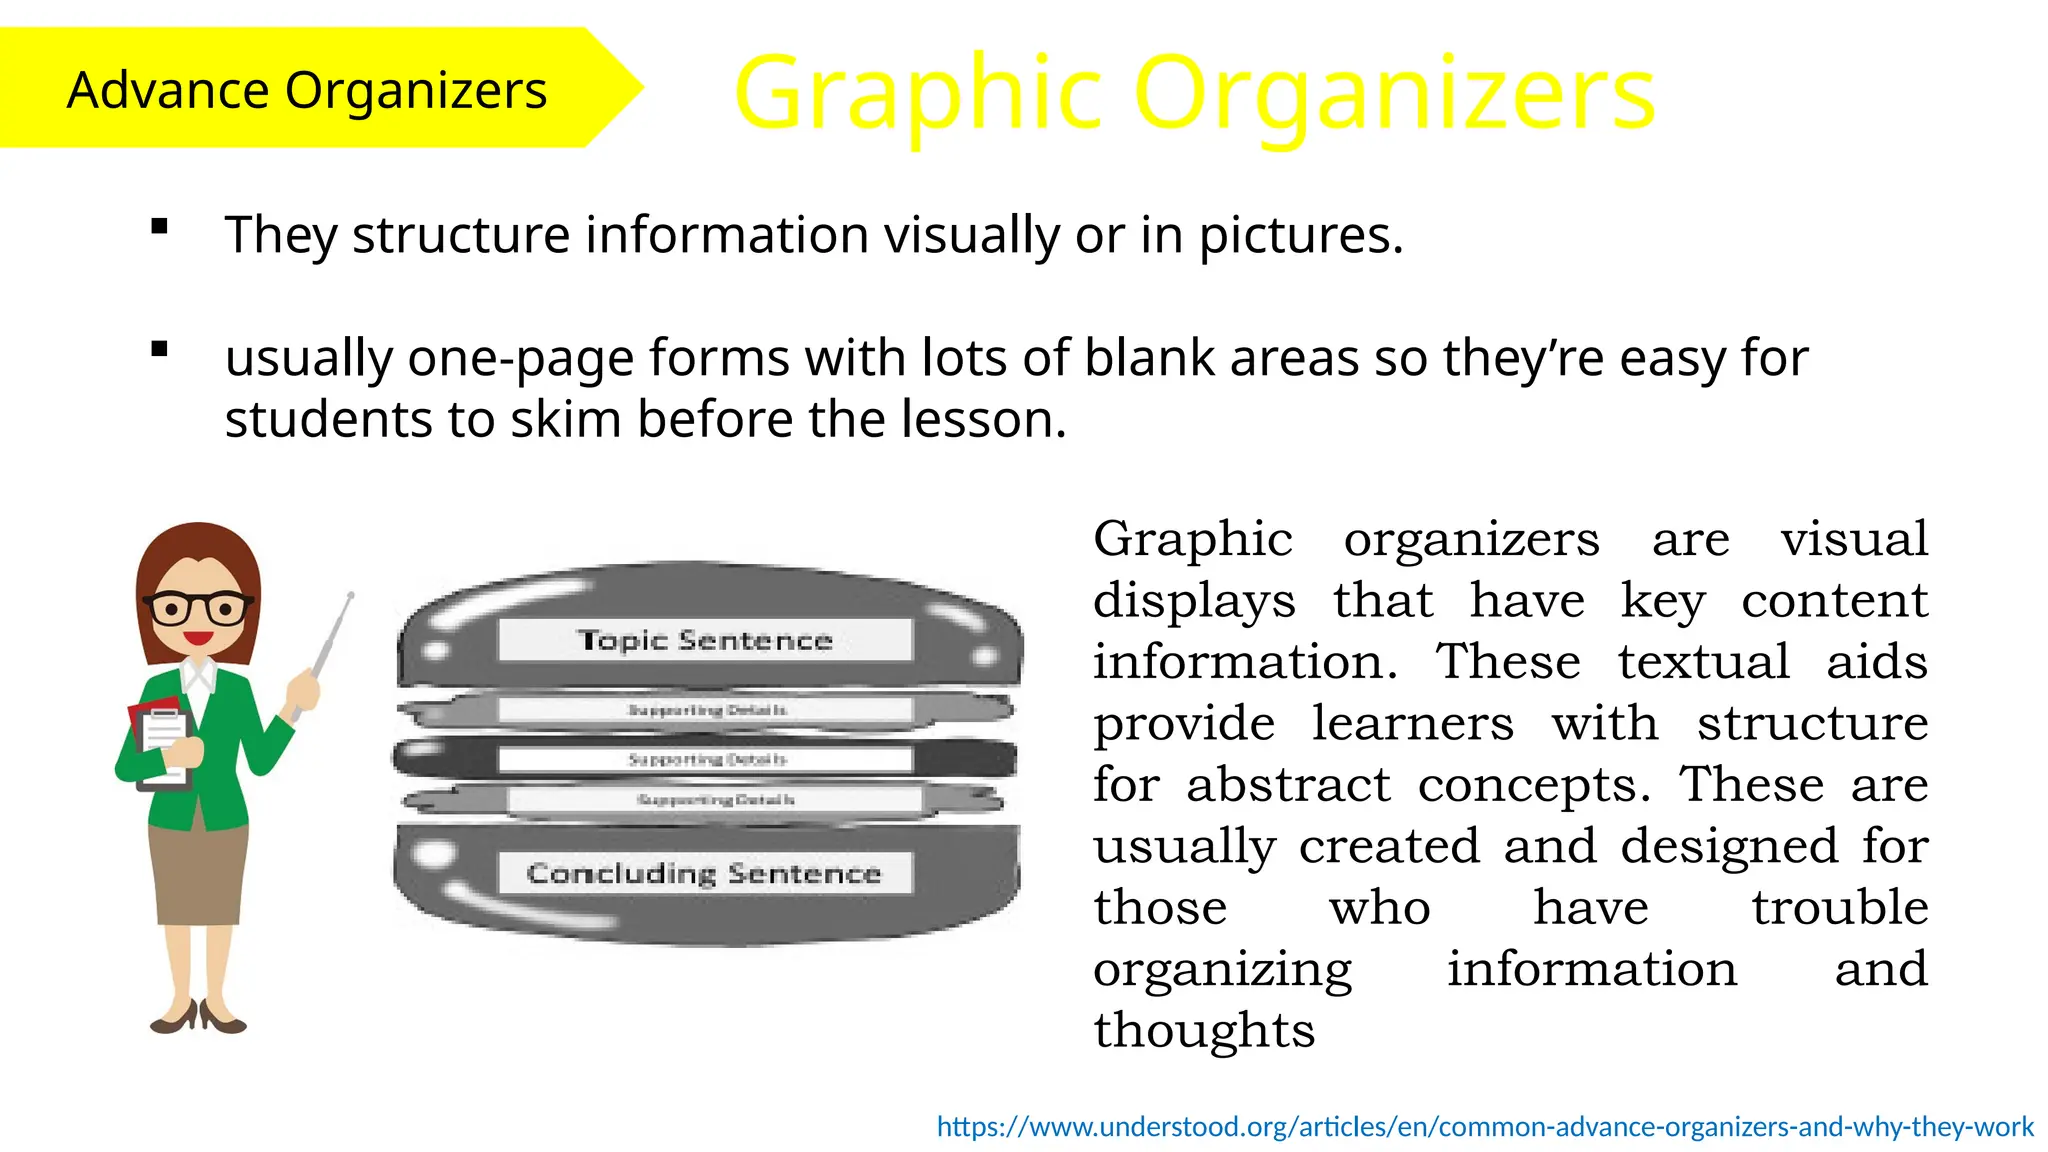
Advance Organizers GraphicOrganizers
https://www.understood.org/articles/en/common-advance-organizers-and-why-they-work
They structure information visually or in pictures.
usually one-page forms with lots of blank areas so they’re easy for
students to skim before the lesson.
Graphic organizers are visual
displays that have key content
information. These textual aids
provide learners with structure
for abstract concepts. These are
usually created and designed for
those who have trouble
organizing information and
thoughts
17.
Advance Organizers GraphicOrganizers
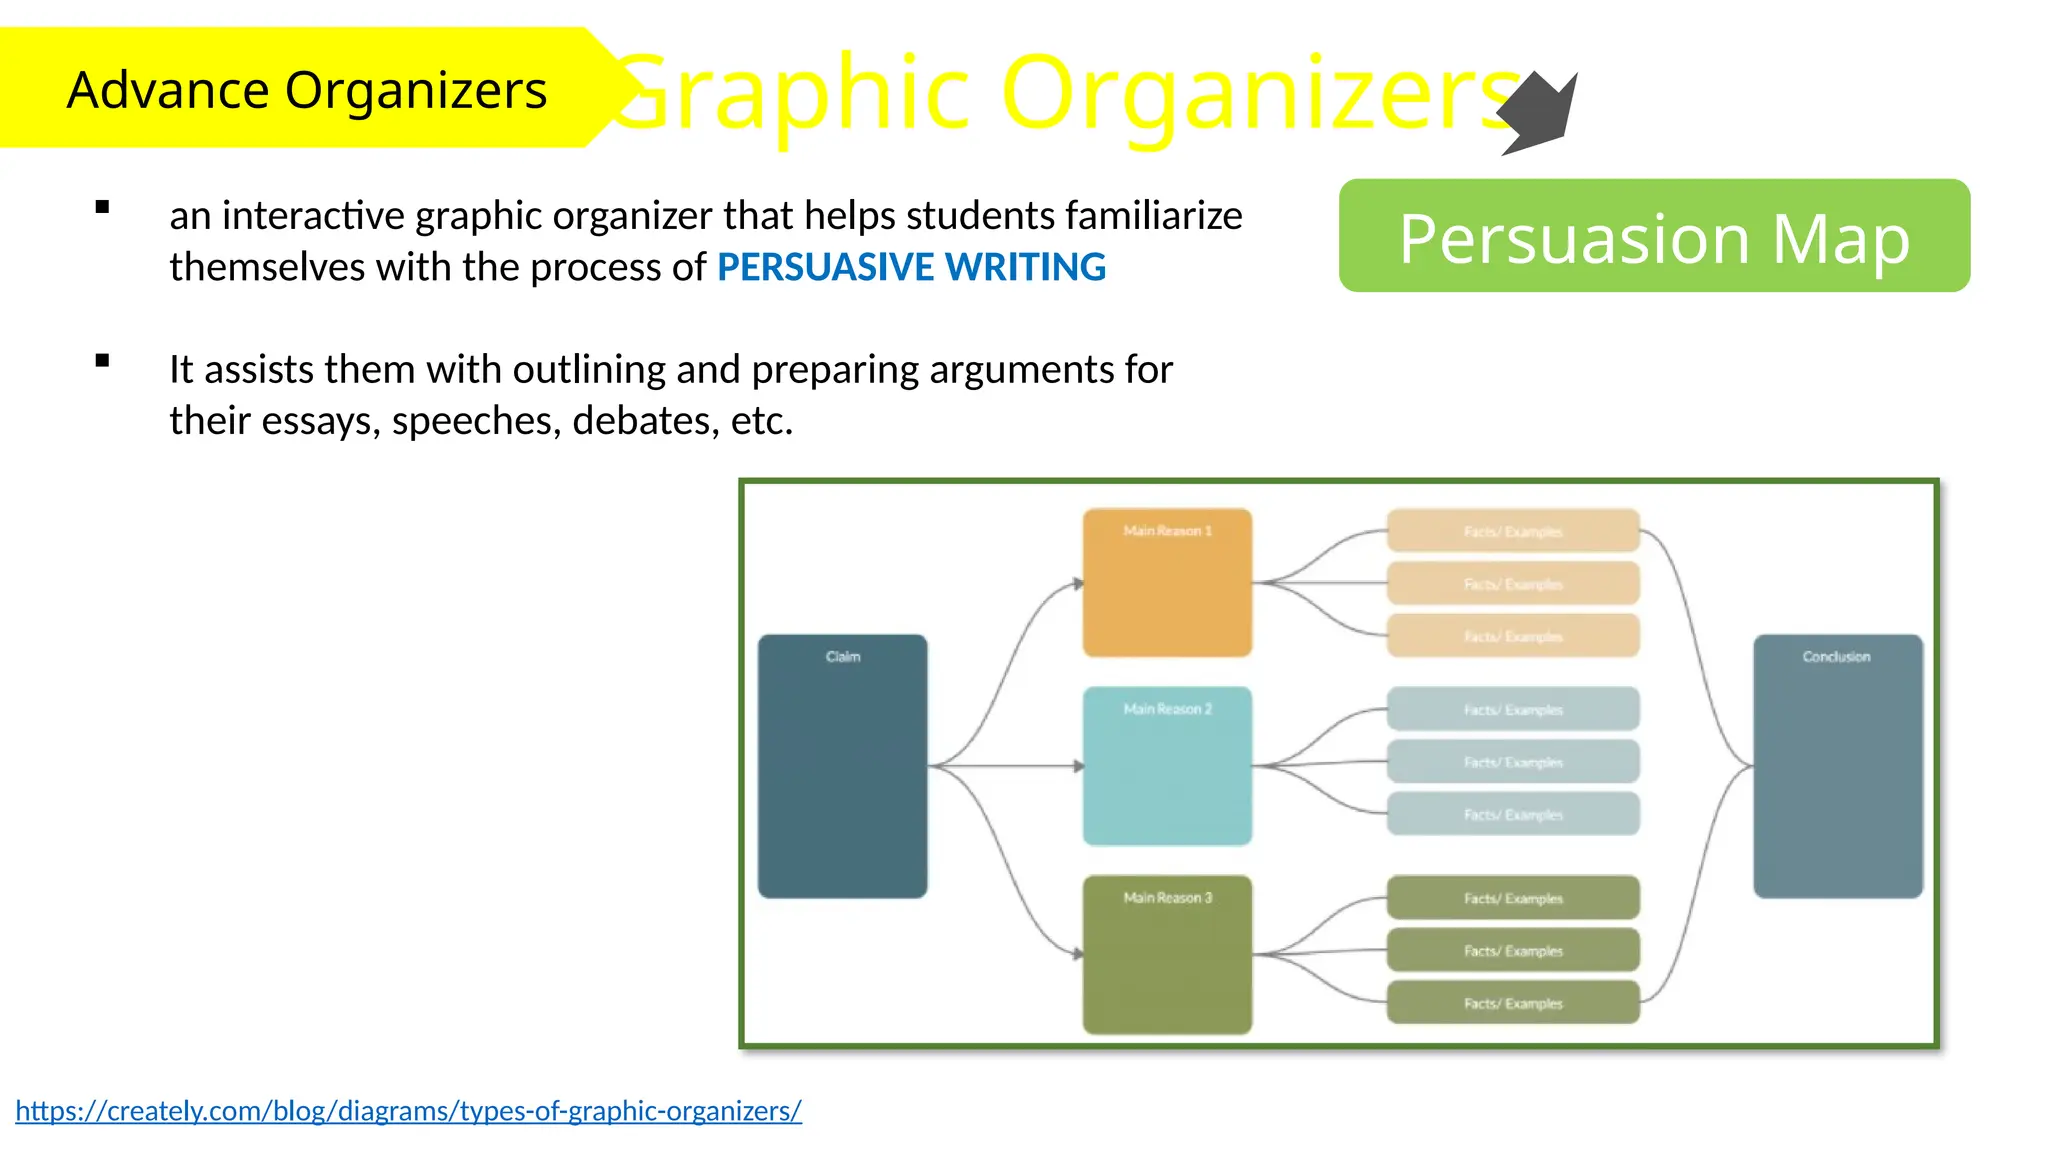
Persuasion Map
an interactive graphic organizer that helps students familiarize
themselves with the process of PERSUASIVE WRITING
It assists them with outlining and preparing arguments for
their essays, speeches, debates, etc.
https://creately.com/blog/diagrams/types-of-graphic-organizers/
18.
Advance Organizers GraphicOrganizers
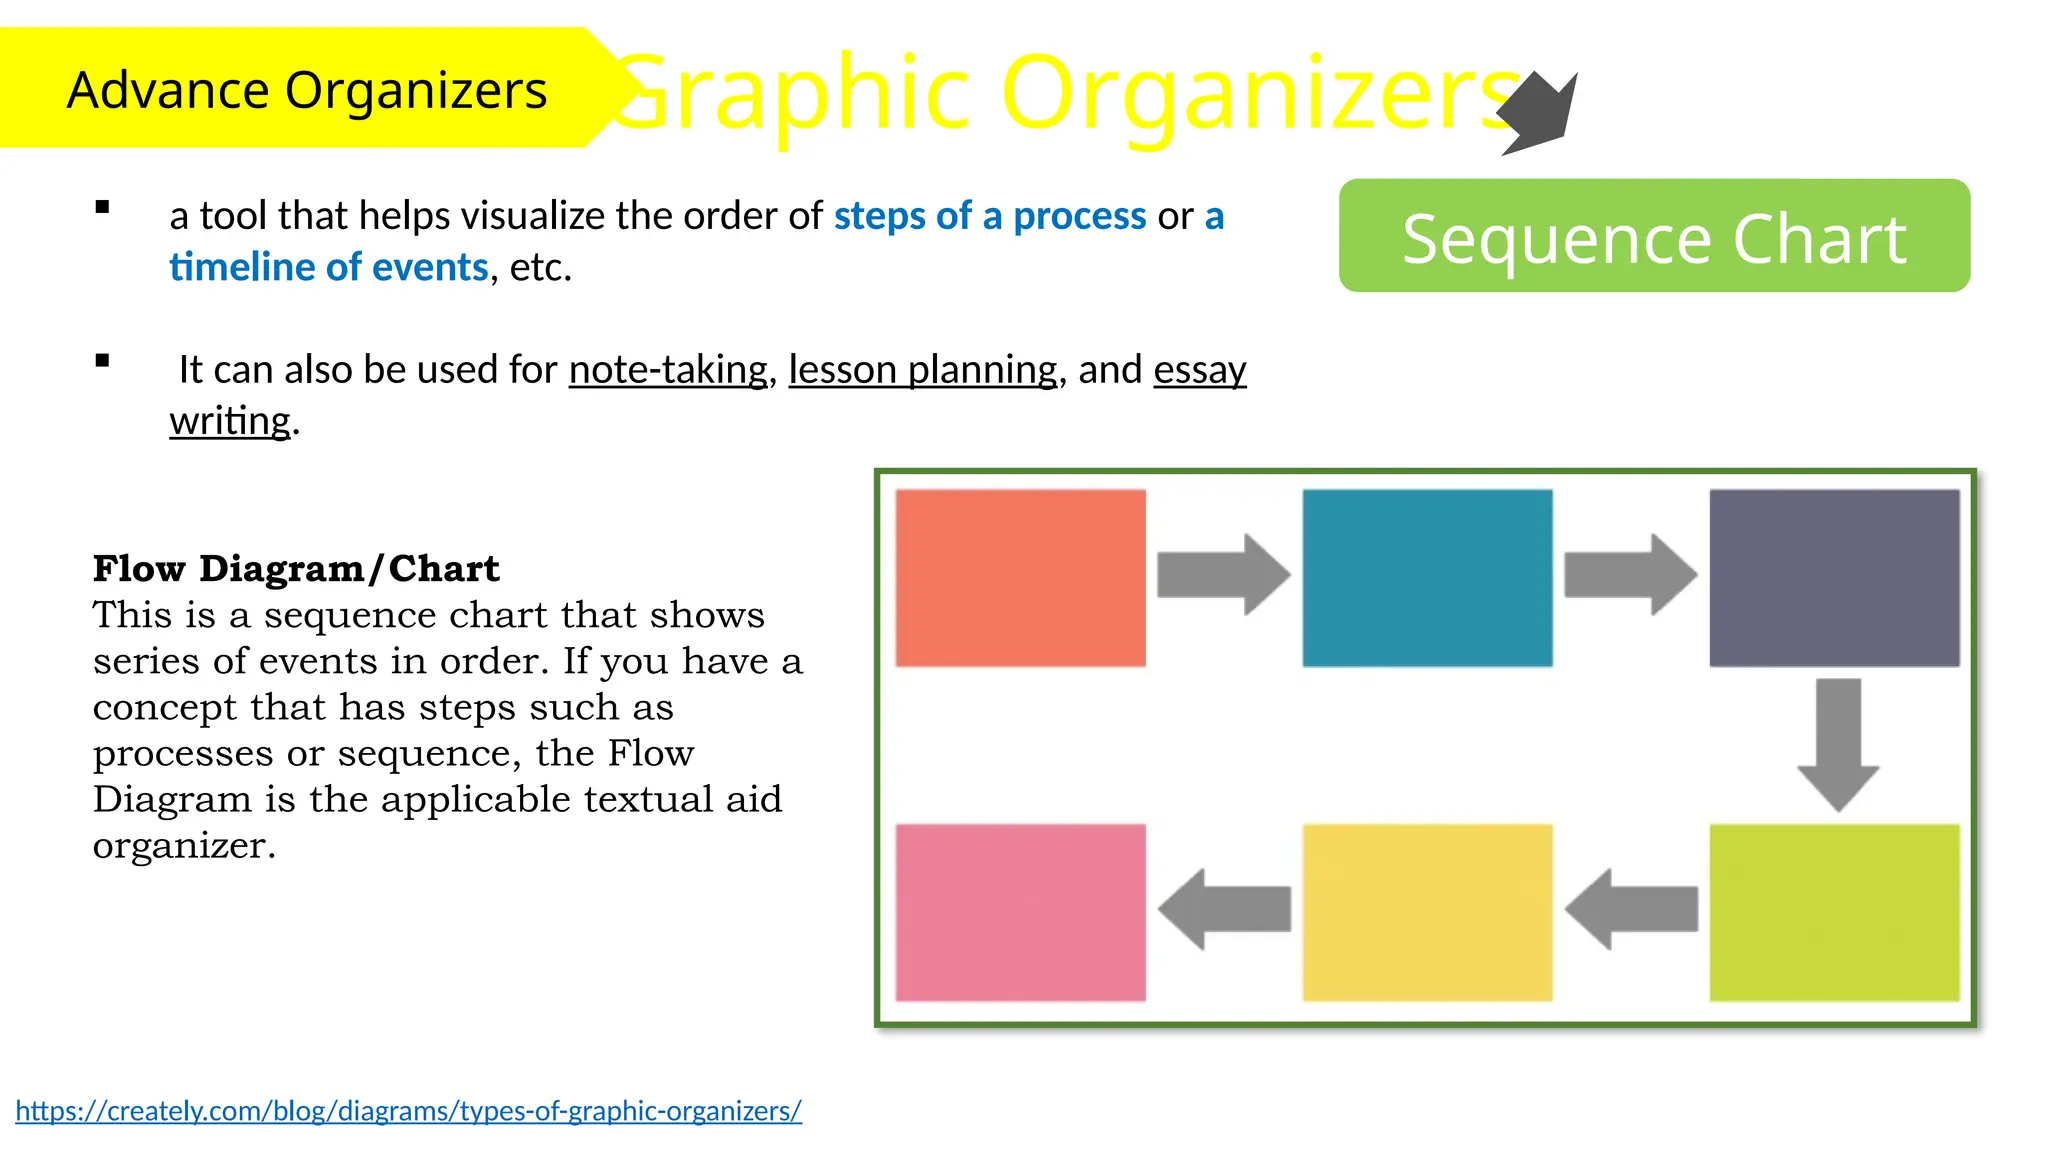
Sequence Chart
a tool that helps visualize the order of steps of a process or a
timeline of events, etc.
It can also be used for note-taking, lesson planning, and essay
writing.
https://creately.com/blog/diagrams/types-of-graphic-organizers/
Flow Diagram/Chart
This is a sequence chart that shows
series of events in order. If you have a
concept that has steps such as
processes or sequence, the Flow
Diagram is the applicable textual aid
organizer.
19.
Advance Organizers GraphicOrganizers
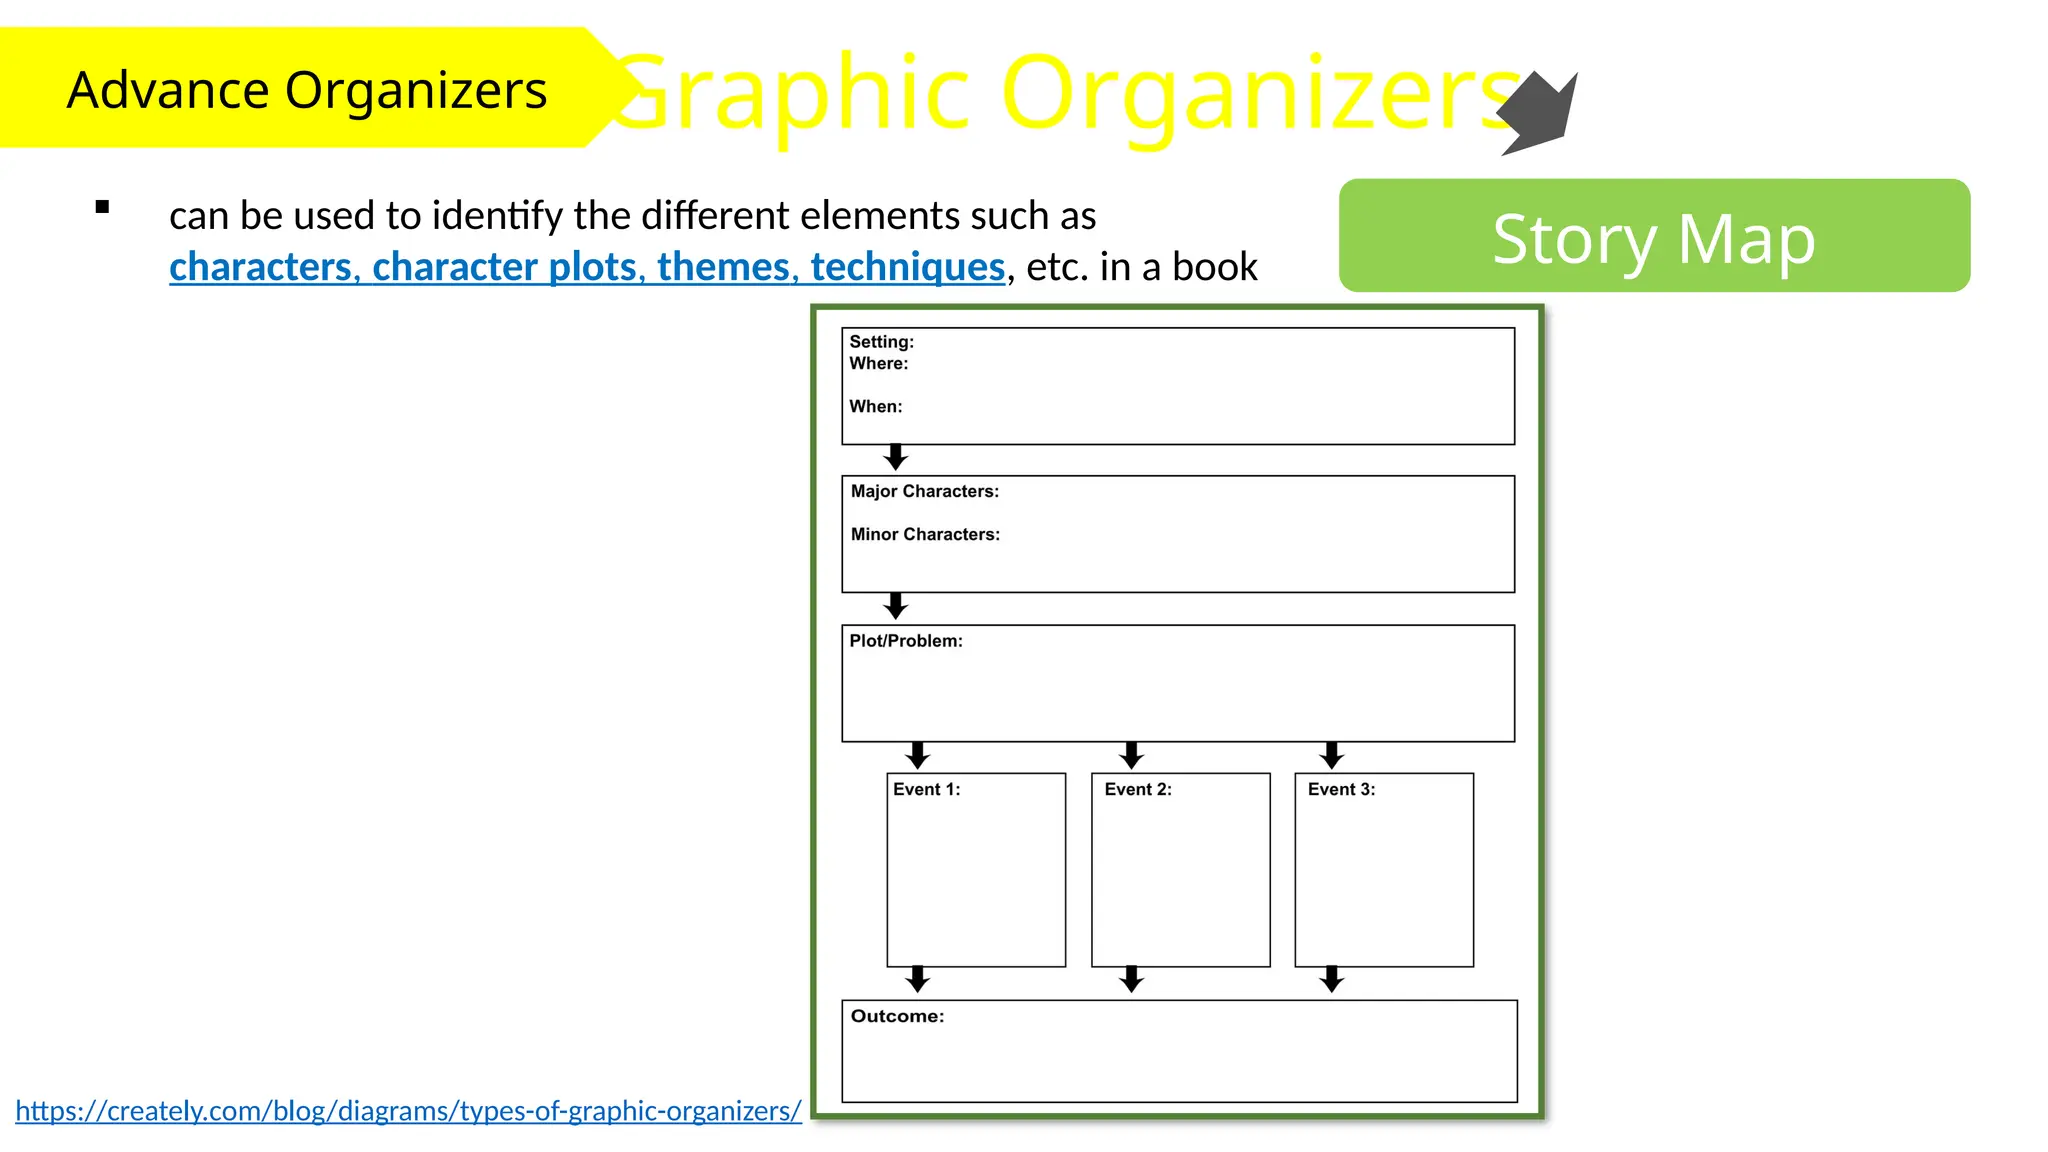
Story Map
can be used to identify the different elements such as
characters, character plots, themes, techniques, etc. in a book
https://creately.com/blog/diagrams/types-of-graphic-organizers/
20.
Advance Organizers GraphicOrganizers
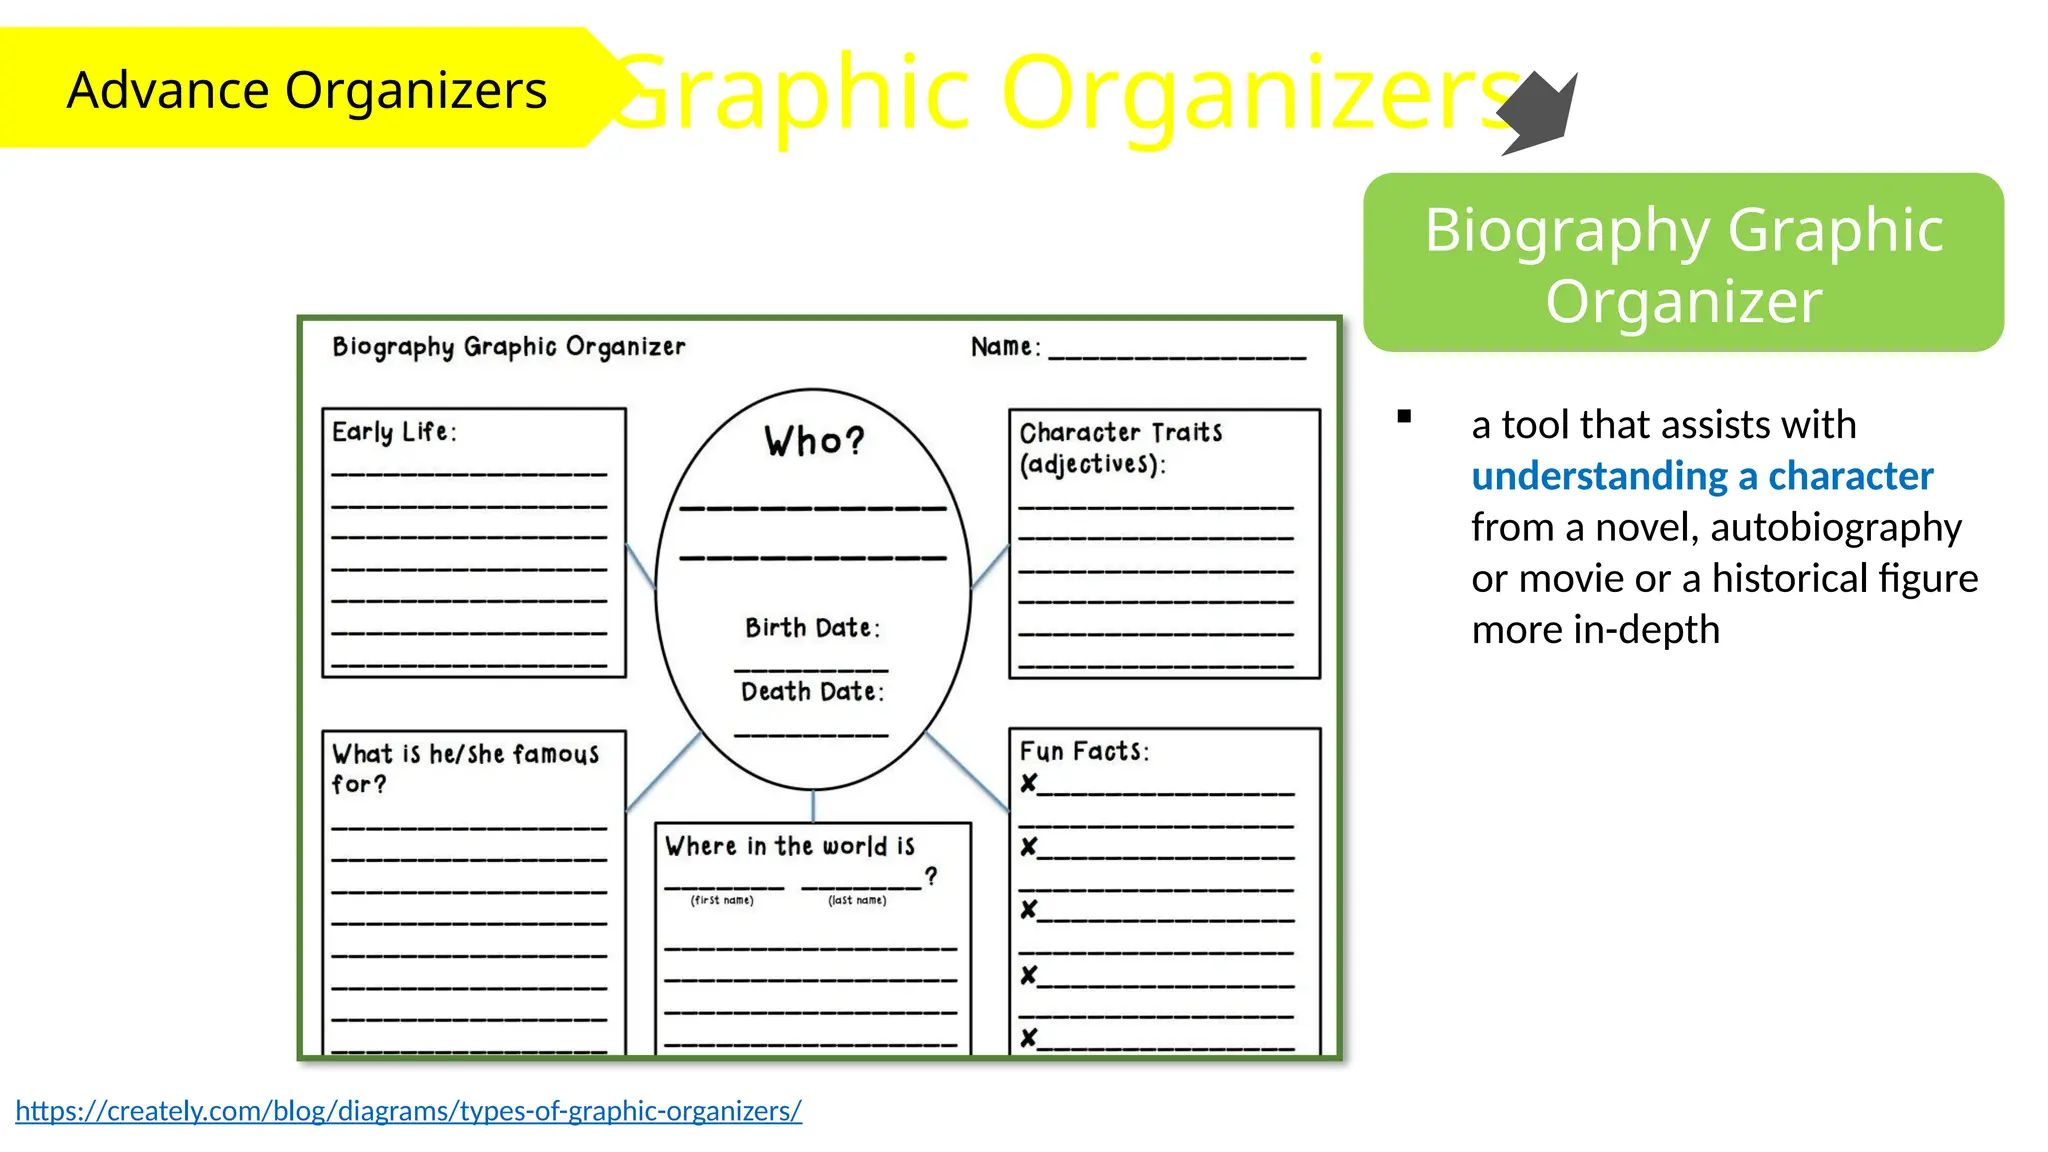
Biography Graphic
Organizer
a tool that assists with
understanding a character
from a novel, autobiography
or movie or a historical figure
more in-depth
https://creately.com/blog/diagrams/types-of-graphic-organizers/
21.
Advance Organizers GraphicOrganizers
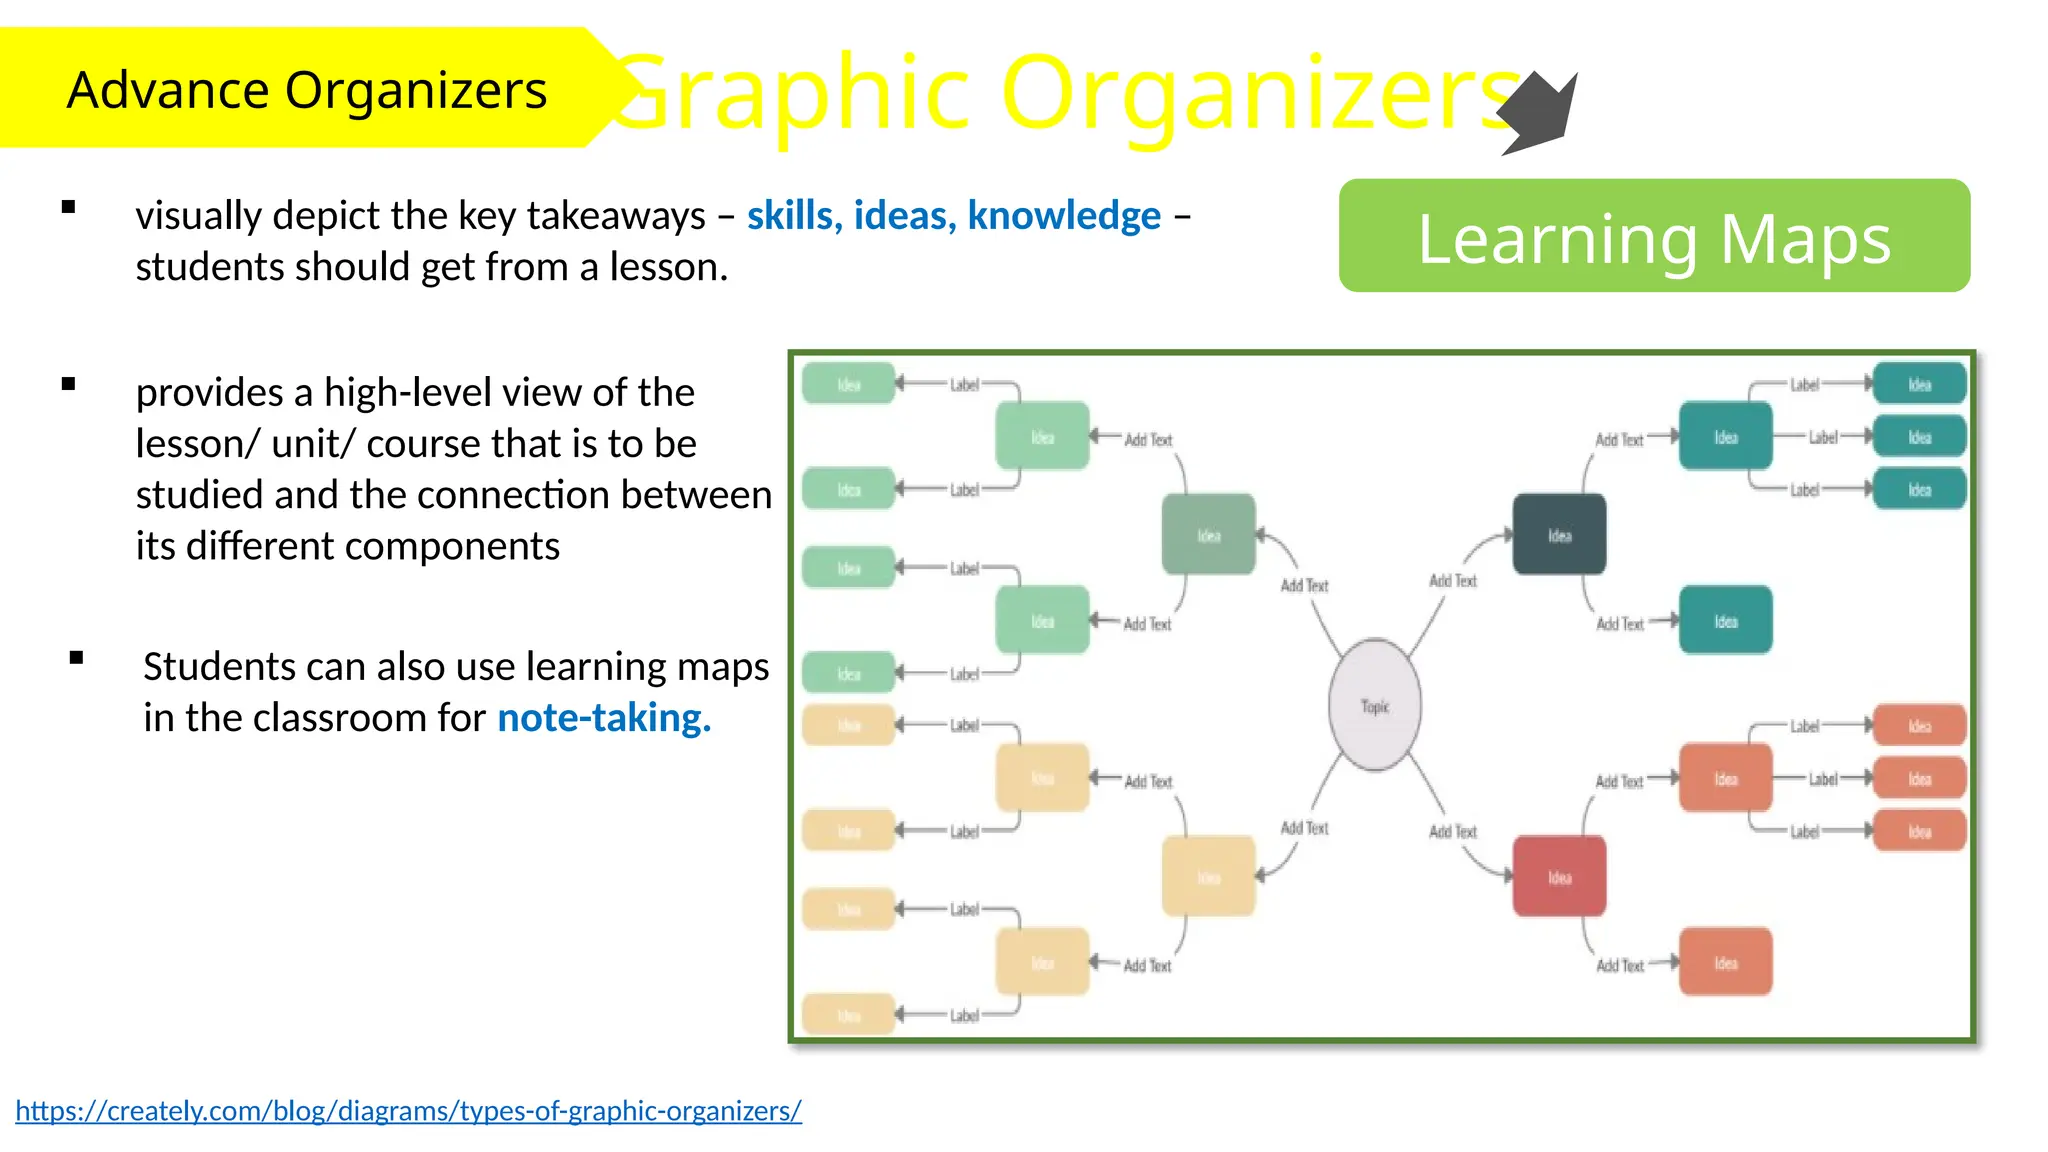
Learning Maps
visually depict the key takeaways – skills, ideas, knowledge –
students should get from a lesson.
https://creately.com/blog/diagrams/types-of-graphic-organizers/
provides a high-level view of the
lesson/ unit/ course that is to be
studied and the connection between
its different components
Students can also use learning maps
in the classroom for note-taking.
22.
Advance Organizers GraphicOrganizers
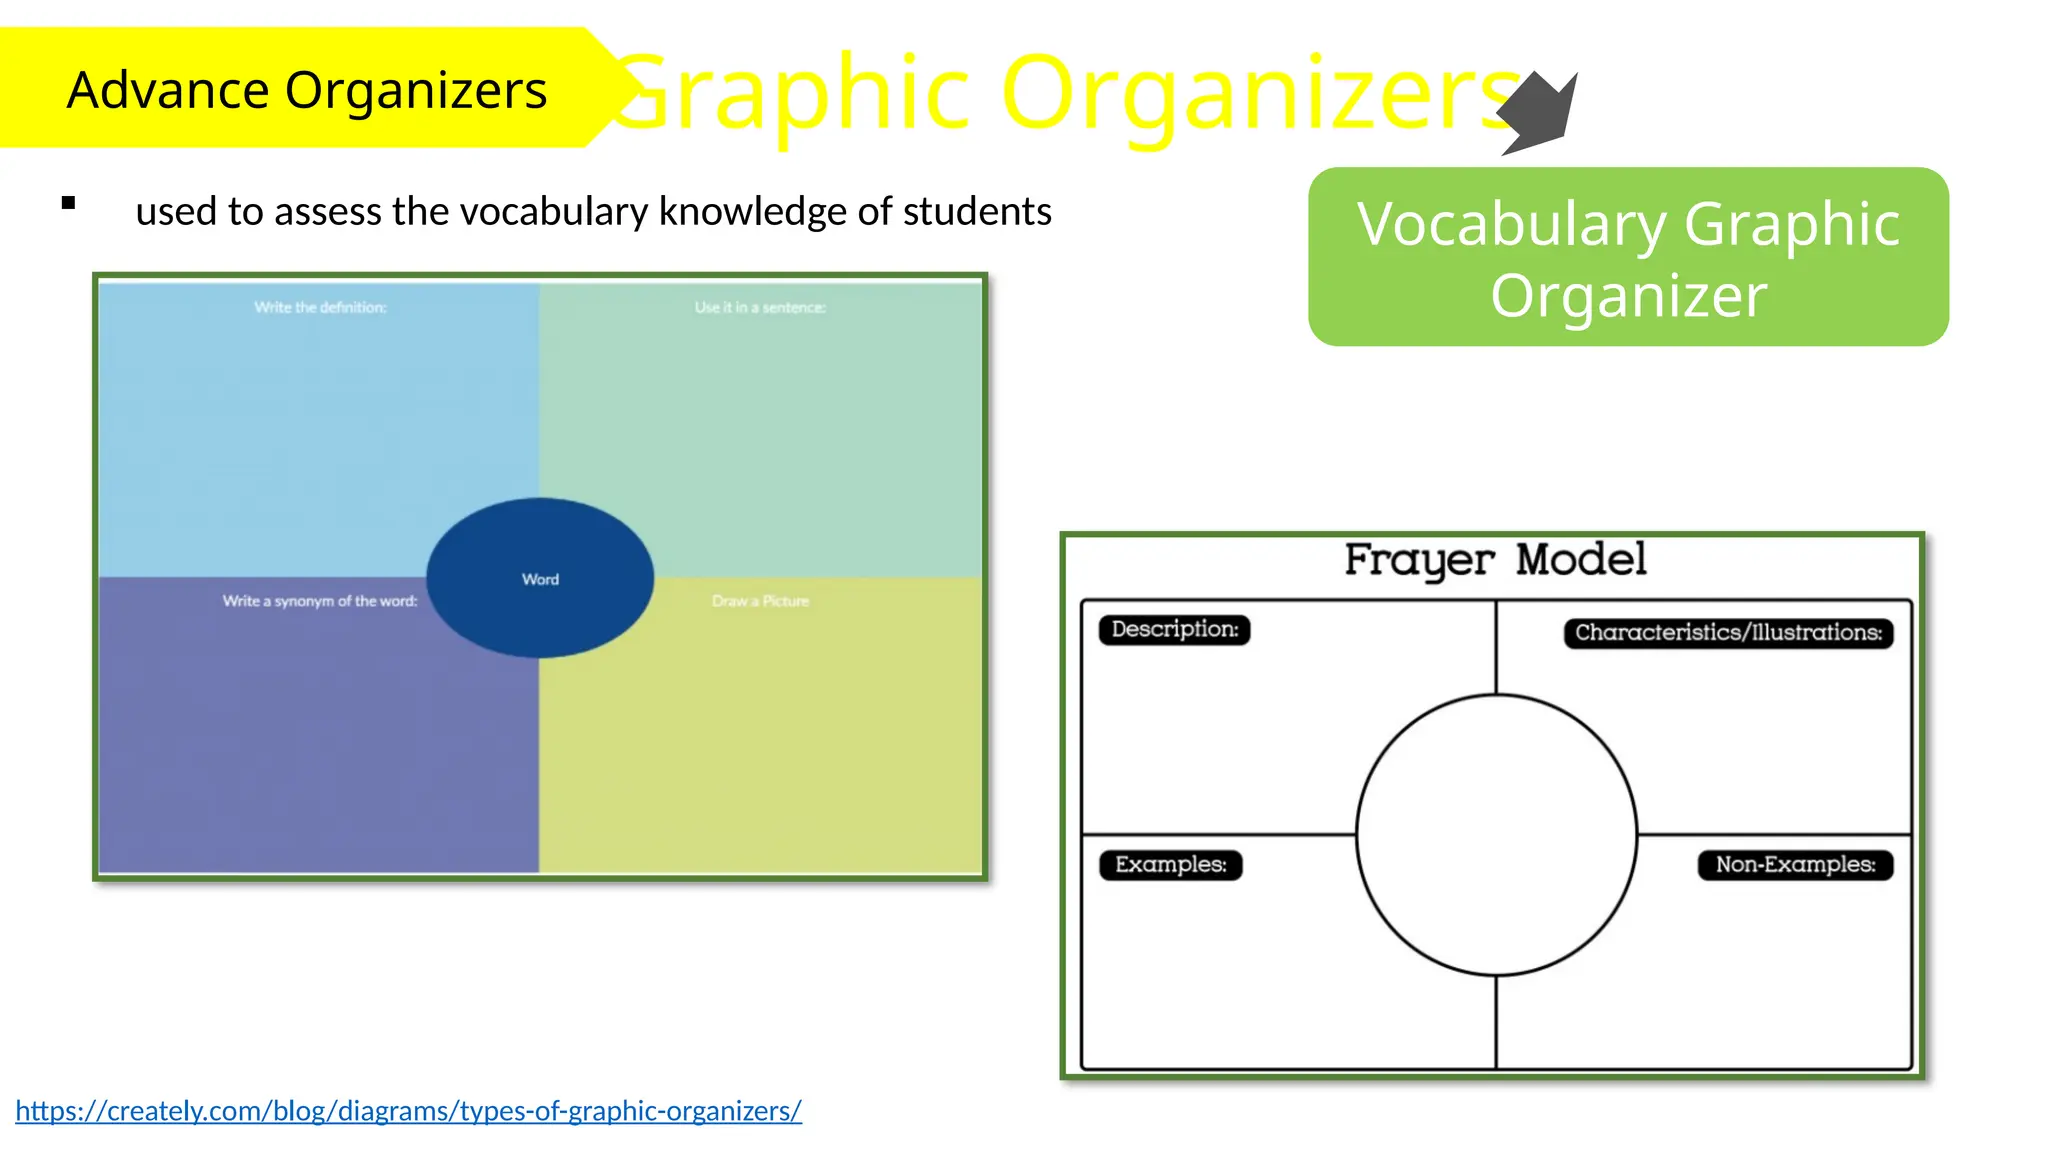
Vocabulary Graphic
Organizer
used to assess the vocabulary knowledge of students
https://creately.com/blog/diagrams/types-of-graphic-organizers/
23.
Advance Organizers GraphicOrganizers
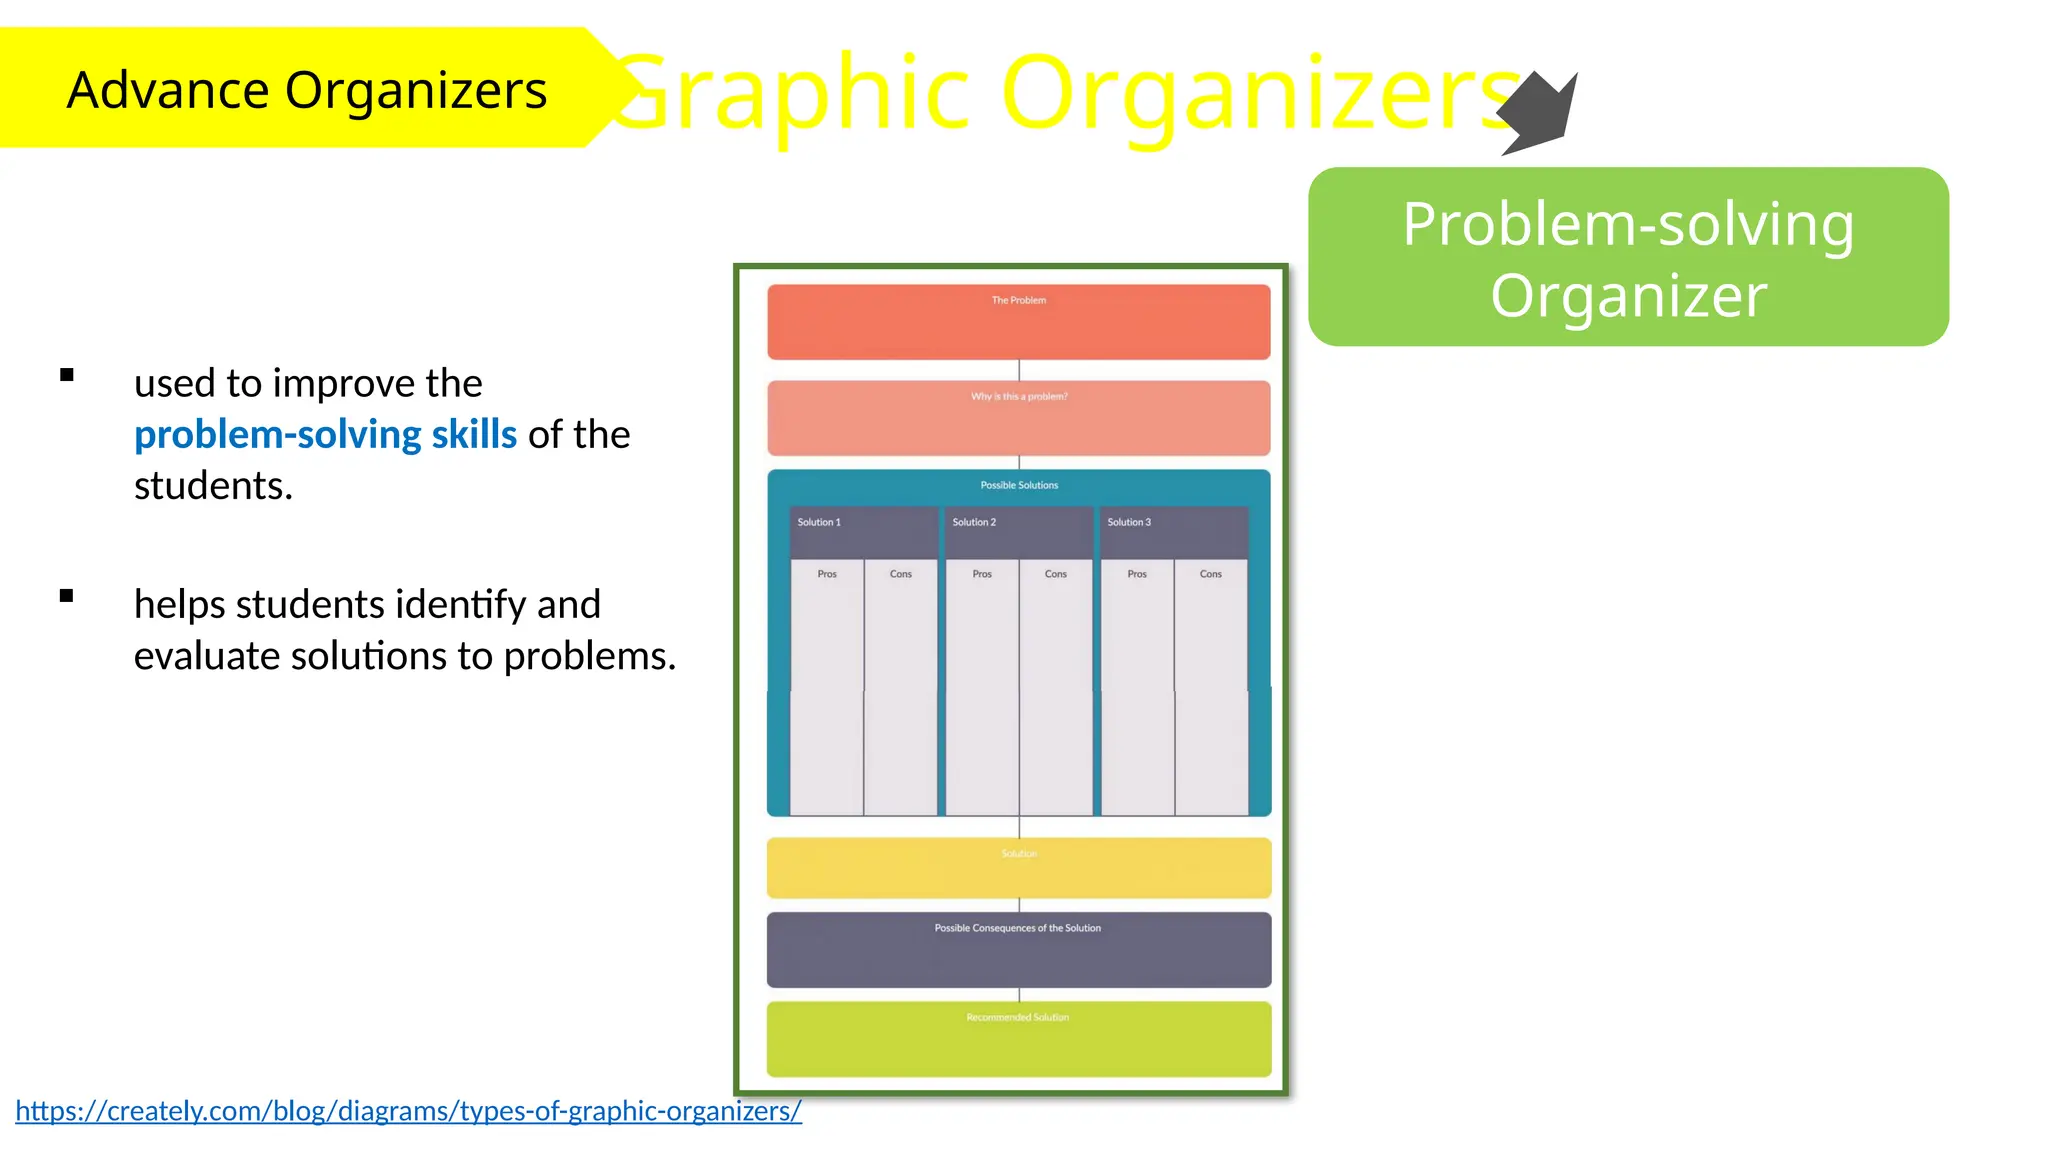
Problem-solving
Organizer
used to improve the
problem-solving skills of the
students.
https://creately.com/blog/diagrams/types-of-graphic-organizers/
helps students identify and
evaluate solutions to problems.
24.
Advance Organizers GraphicOrganizers
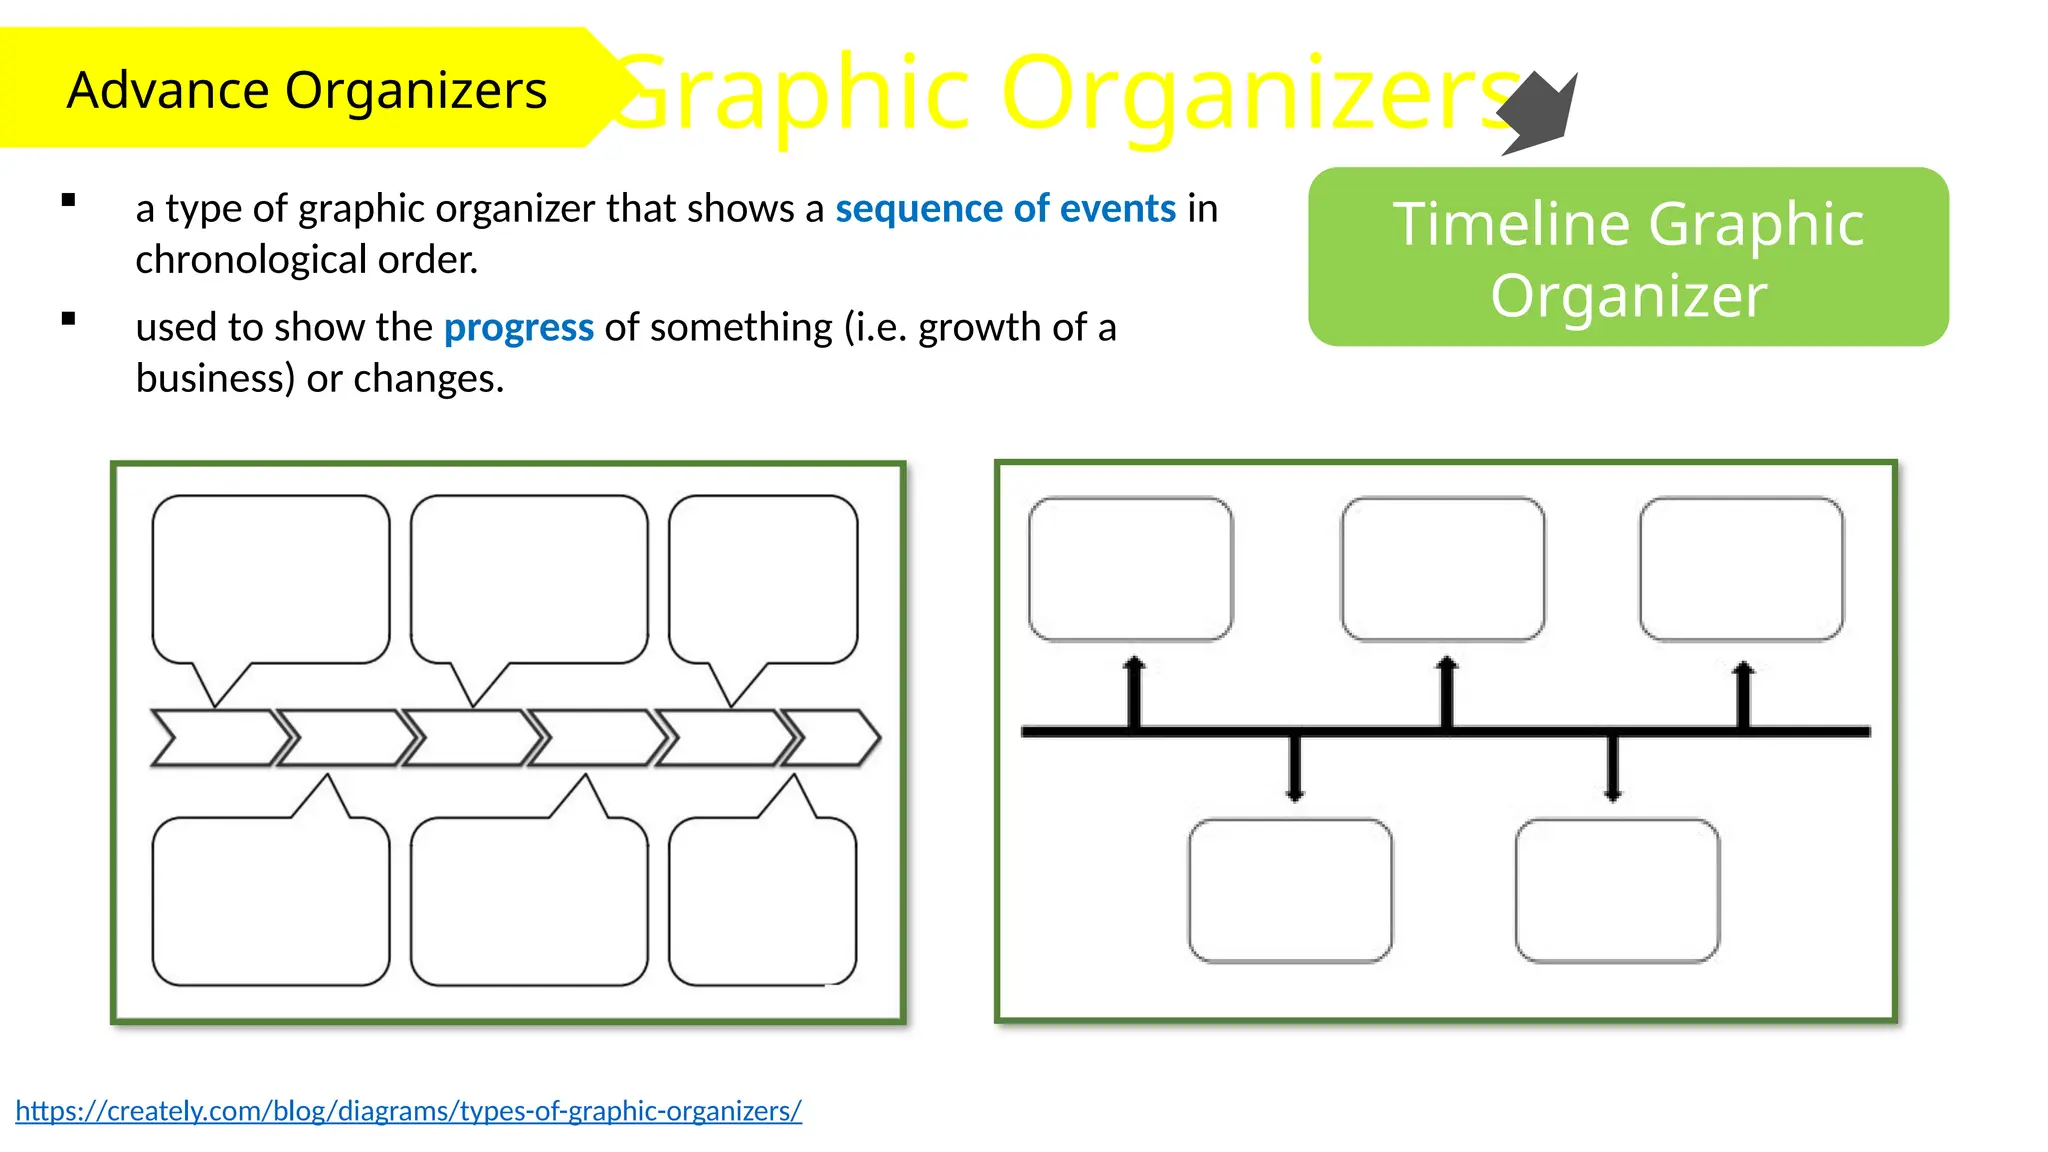
Timeline Graphic
Organizer
a type of graphic organizer that shows a sequence of events in
chronological order.
https://creately.com/blog/diagrams/types-of-graphic-organizers/
used to show the progress of something (i.e. growth of a
business) or changes.
25.
Advance Organizers GraphicOrganizers
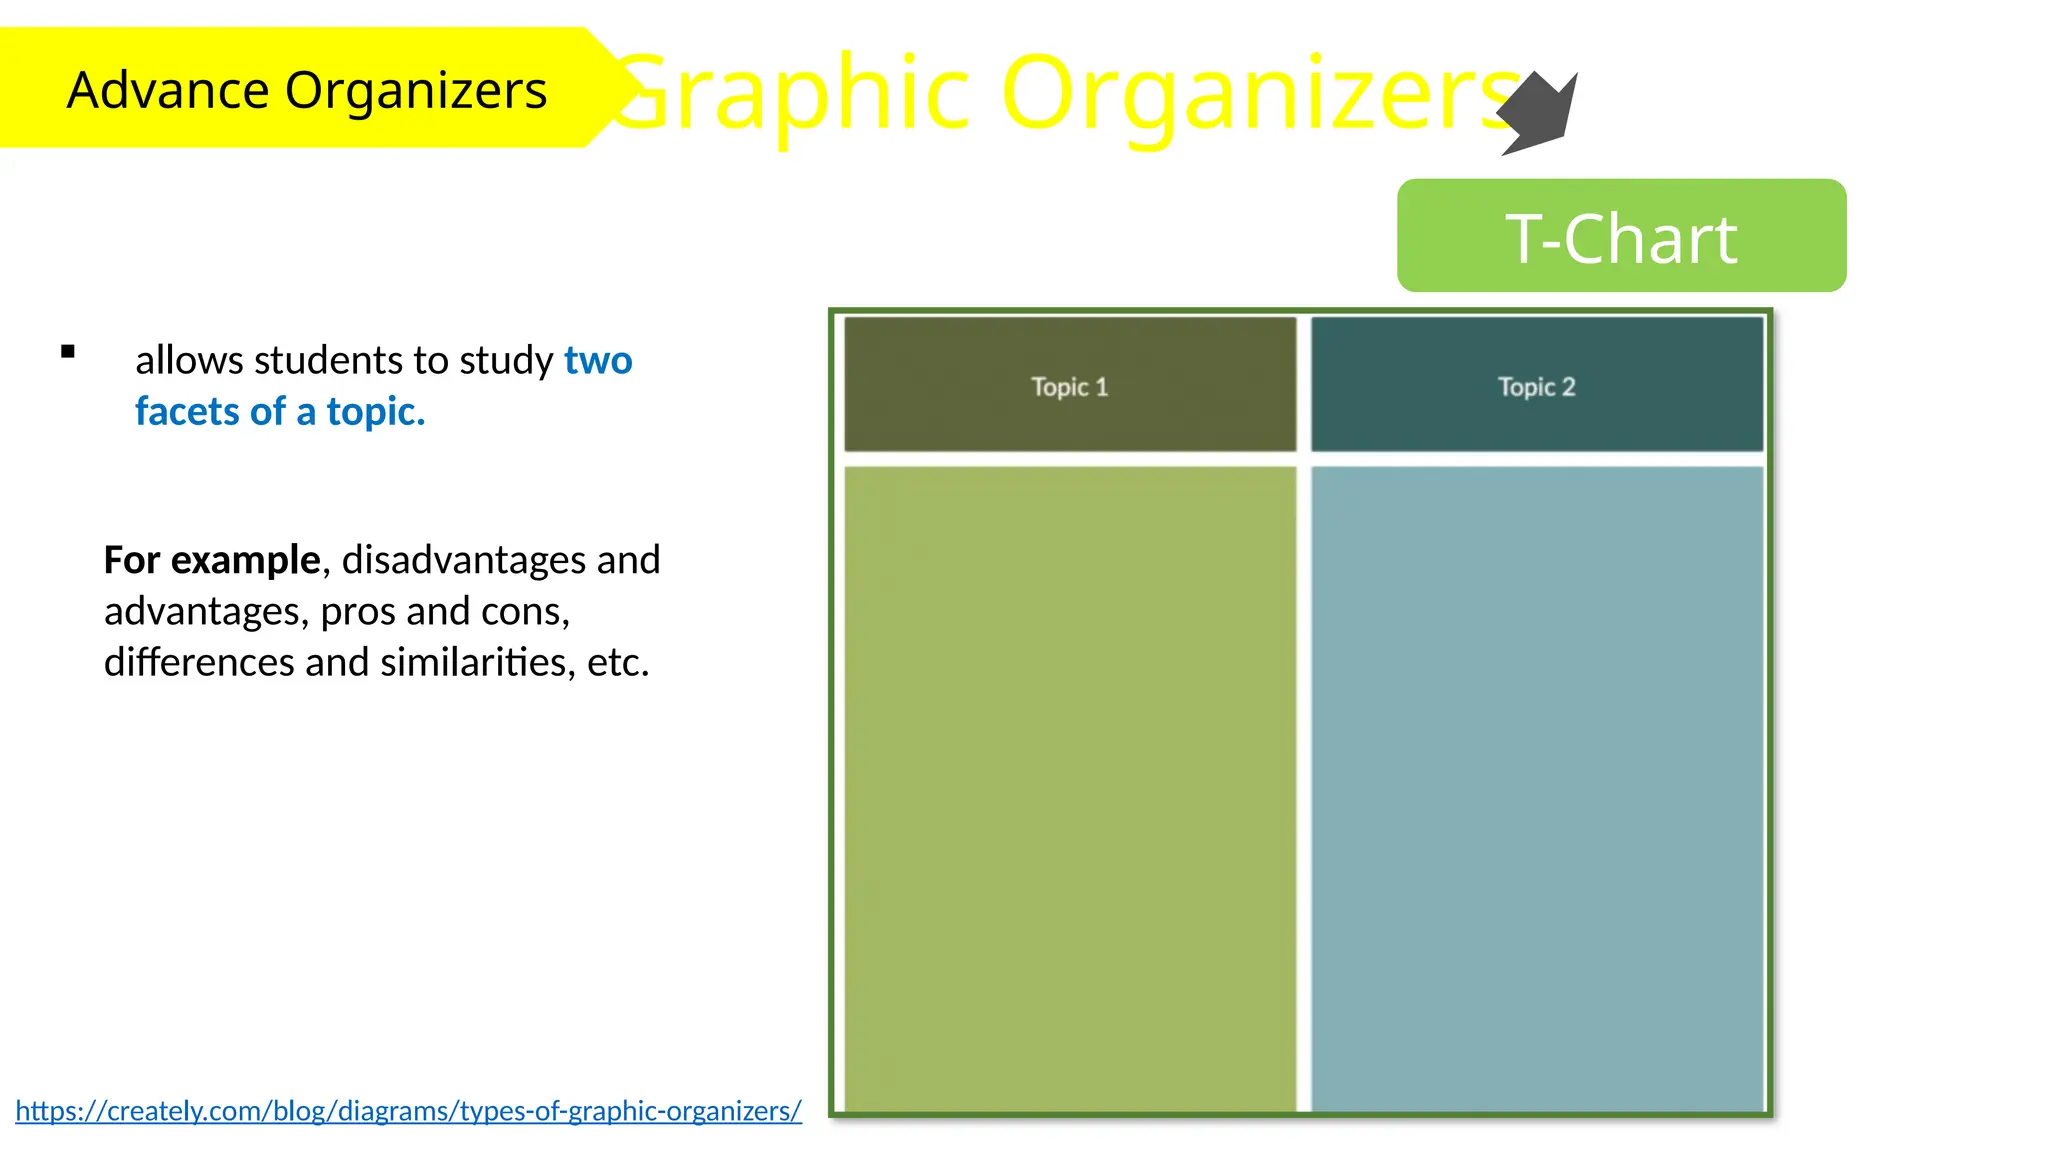
T-Chart
allows students to study two
facets of a topic.
https://creately.com/blog/diagrams/types-of-graphic-organizers/
For example, disadvantages and
advantages, pros and cons,
differences and similarities, etc.
26.
Advance Organizers GraphicOrganizers
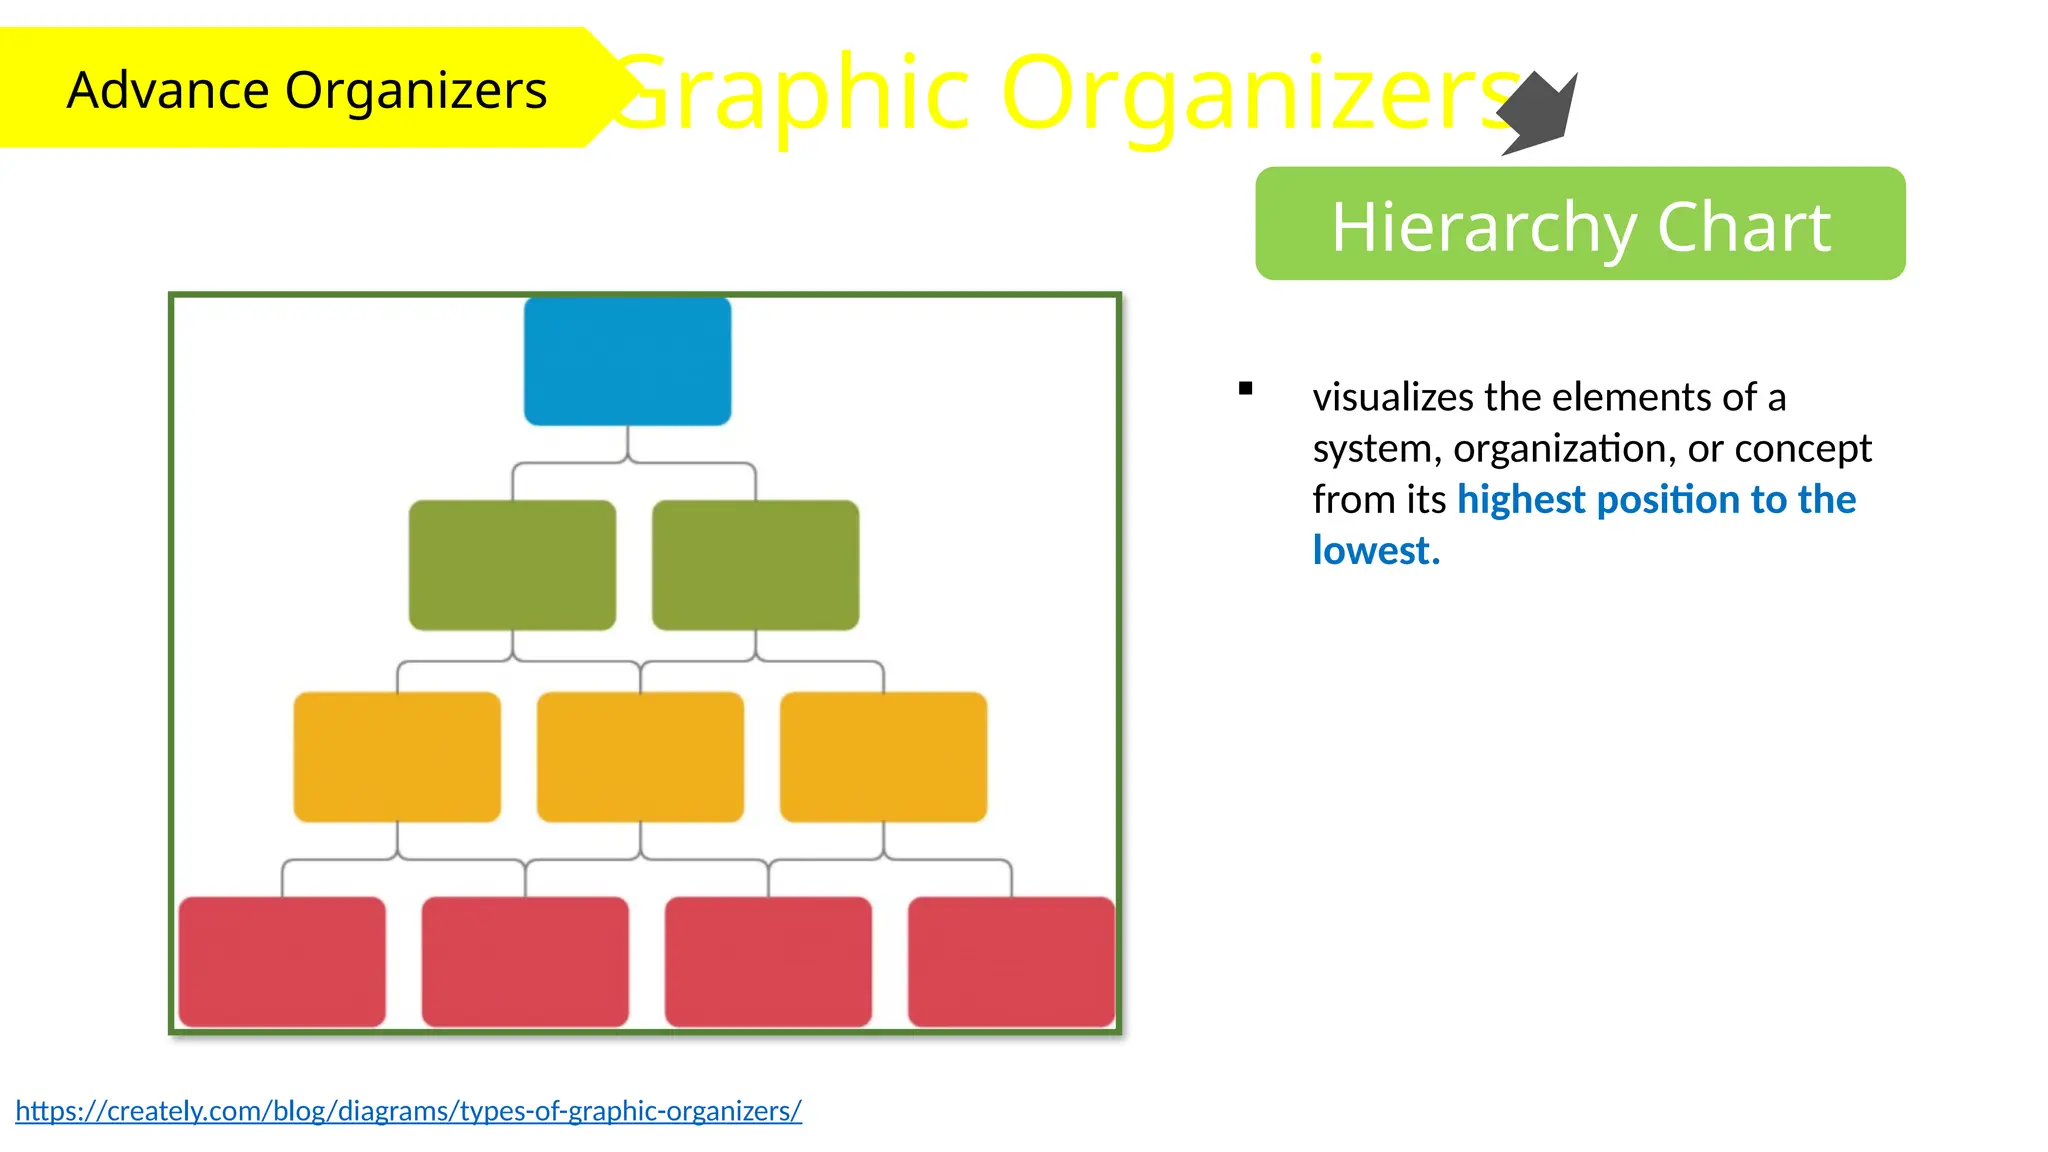
Hierarchy Chart
visualizes the elements of a
system, organization, or concept
from its highest position to the
lowest.
https://creately.com/blog/diagrams/types-of-graphic-organizers/
27.
Advance Organizers GraphicOrganizers
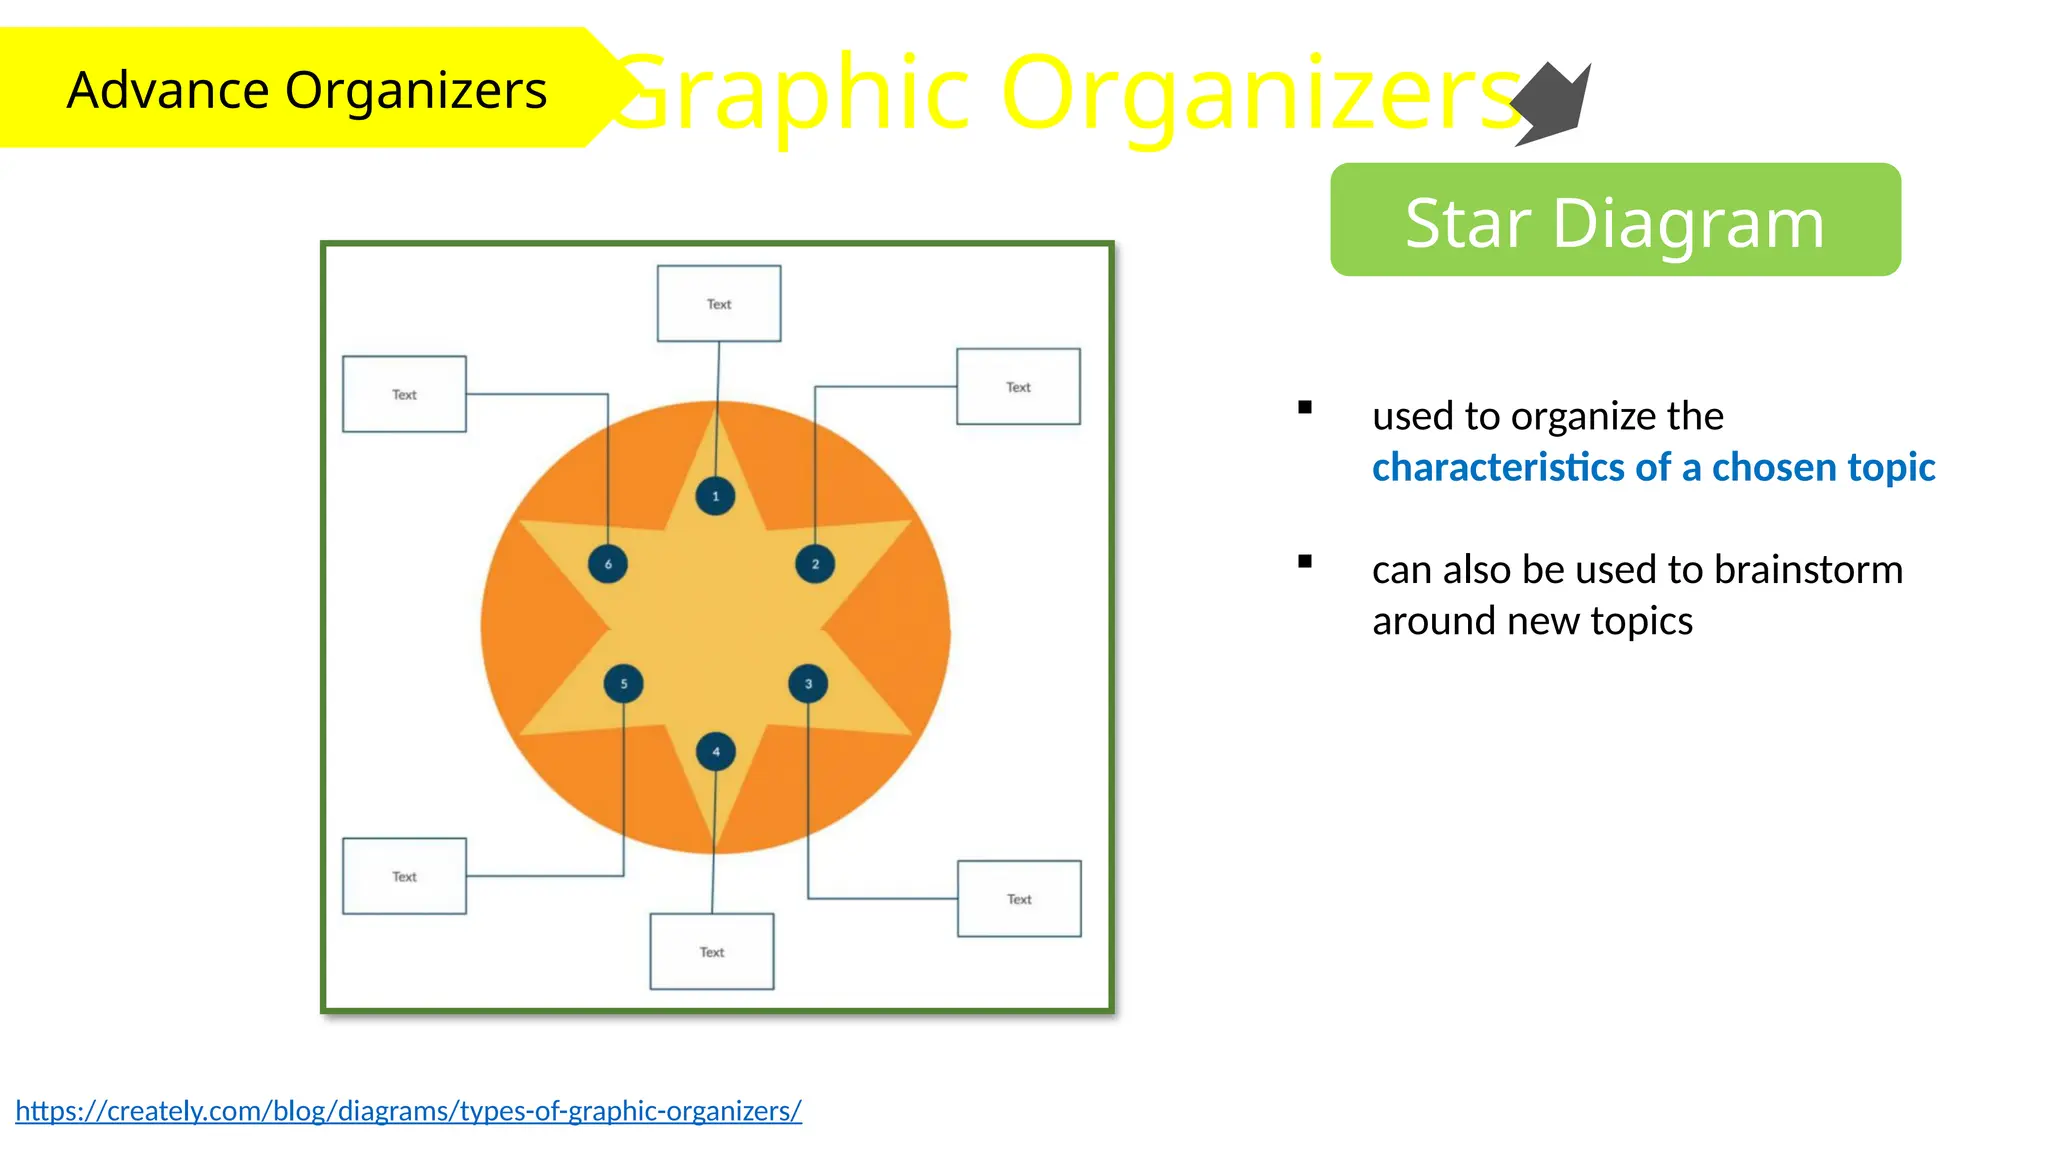
Star Diagram
used to organize the
characteristics of a chosen topic
can also be used to brainstorm
around new topics
https://creately.com/blog/diagrams/types-of-graphic-organizers/
28.
Advance Organizers GraphicOrganizers
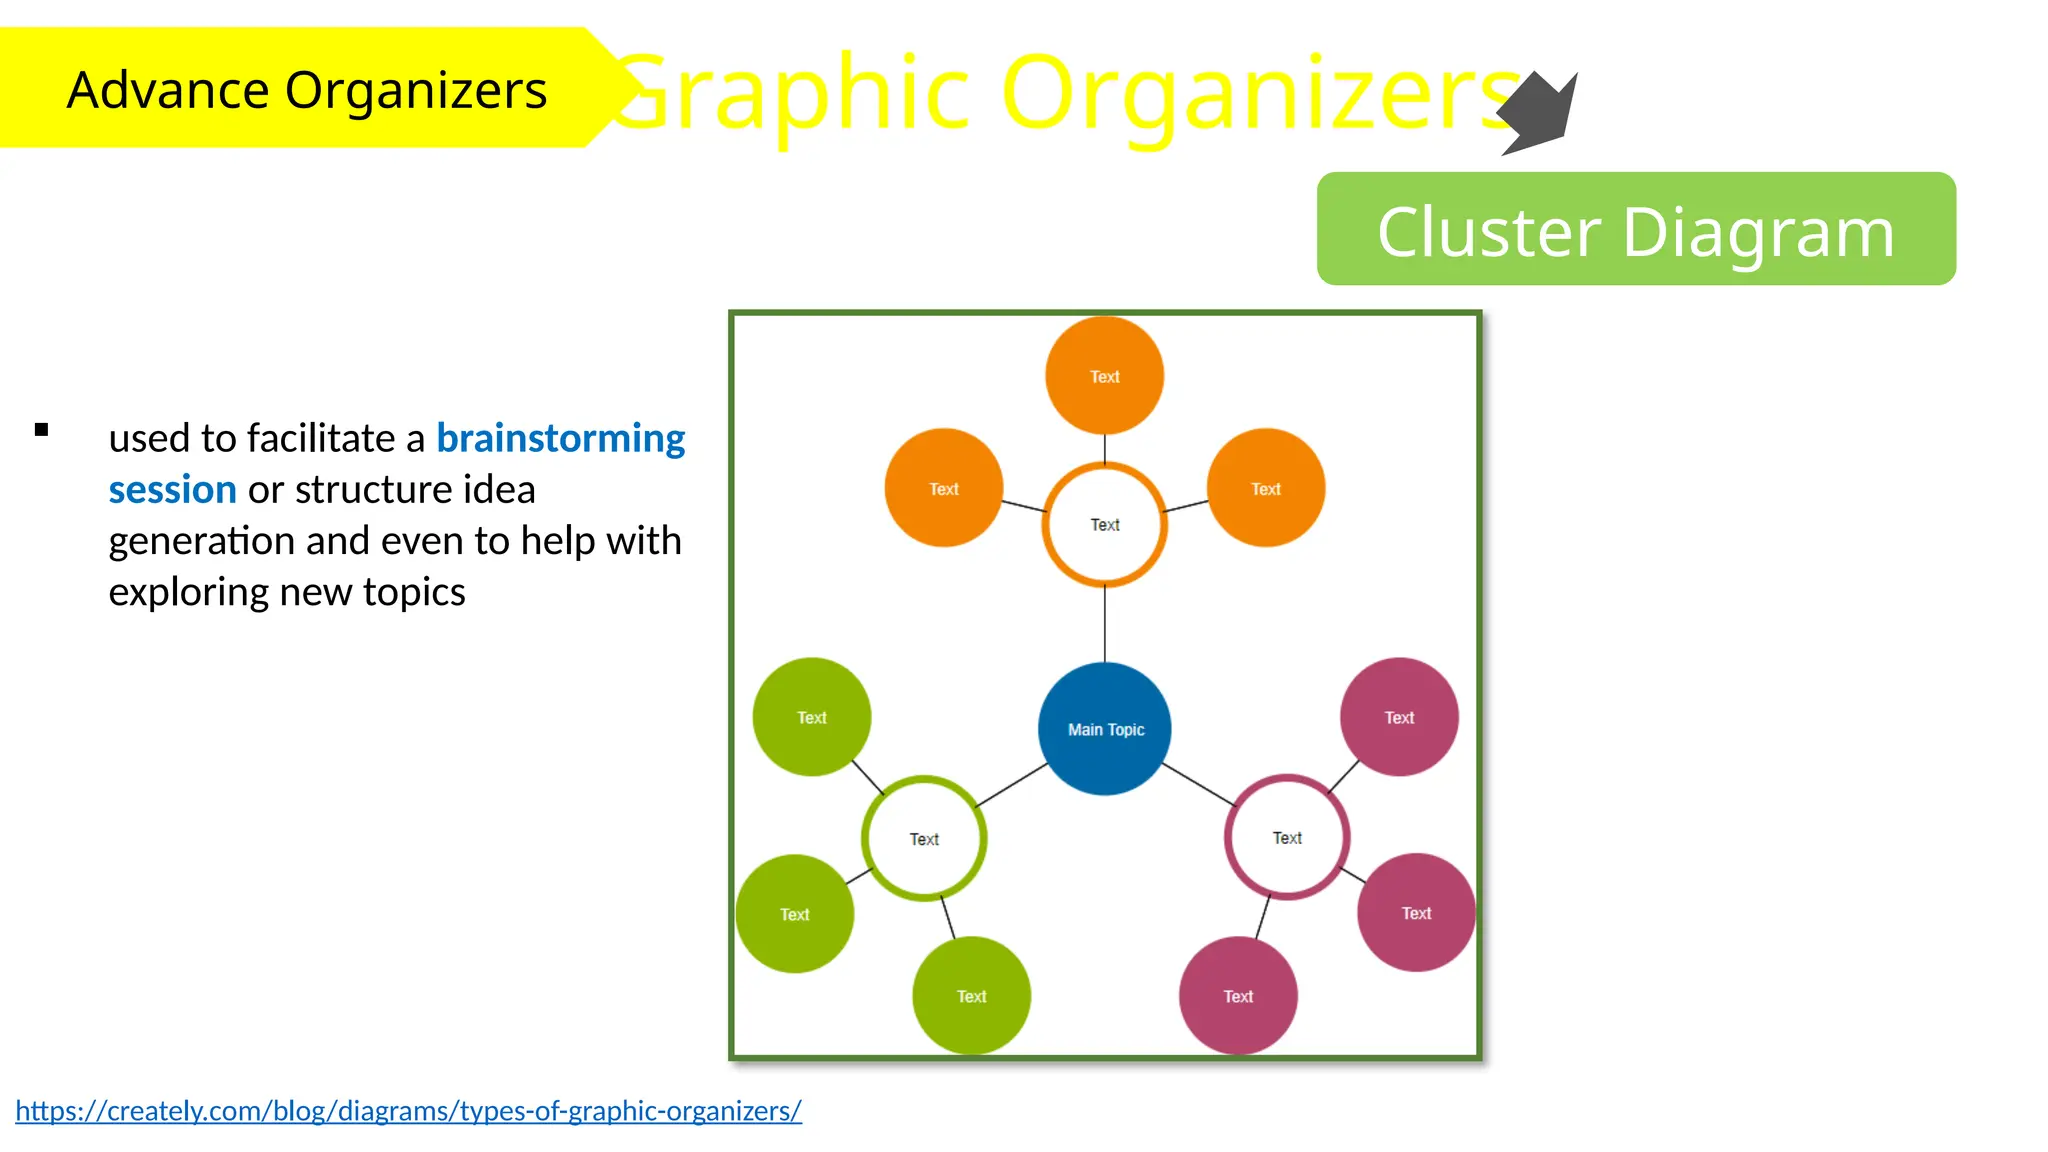
Cluster Diagram
used to facilitate a brainstorming
session or structure idea
generation and even to help with
exploring new topics
https://creately.com/blog/diagrams/types-of-graphic-organizers/
29.
Advance Organizers GraphicOrganizers
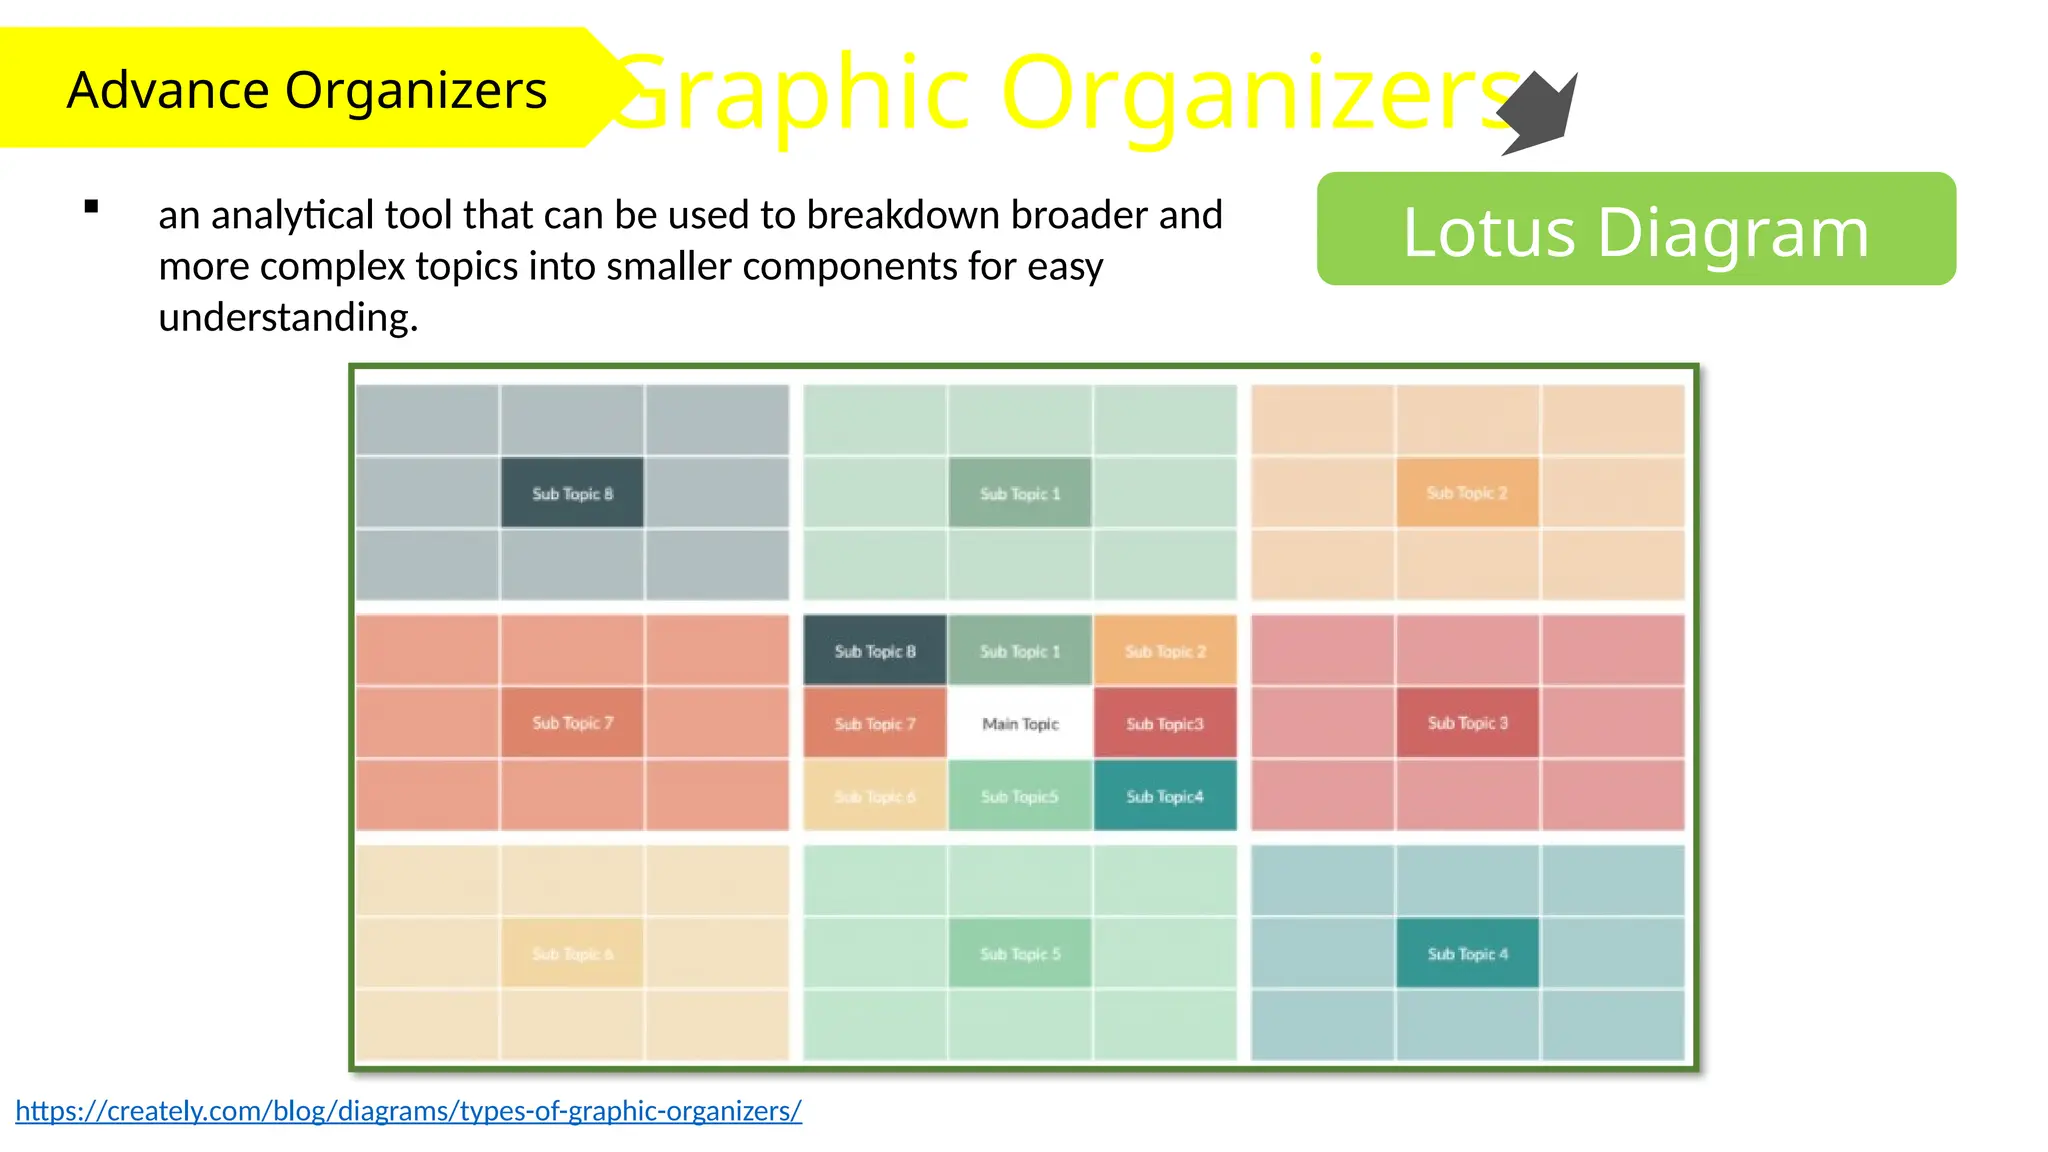
Lotus Diagram
an analytical tool that can be used to breakdown broader and
more complex topics into smaller components for easy
understanding.
https://creately.com/blog/diagrams/types-of-graphic-organizers/
30.
Advance Organizers GraphicOrganizers
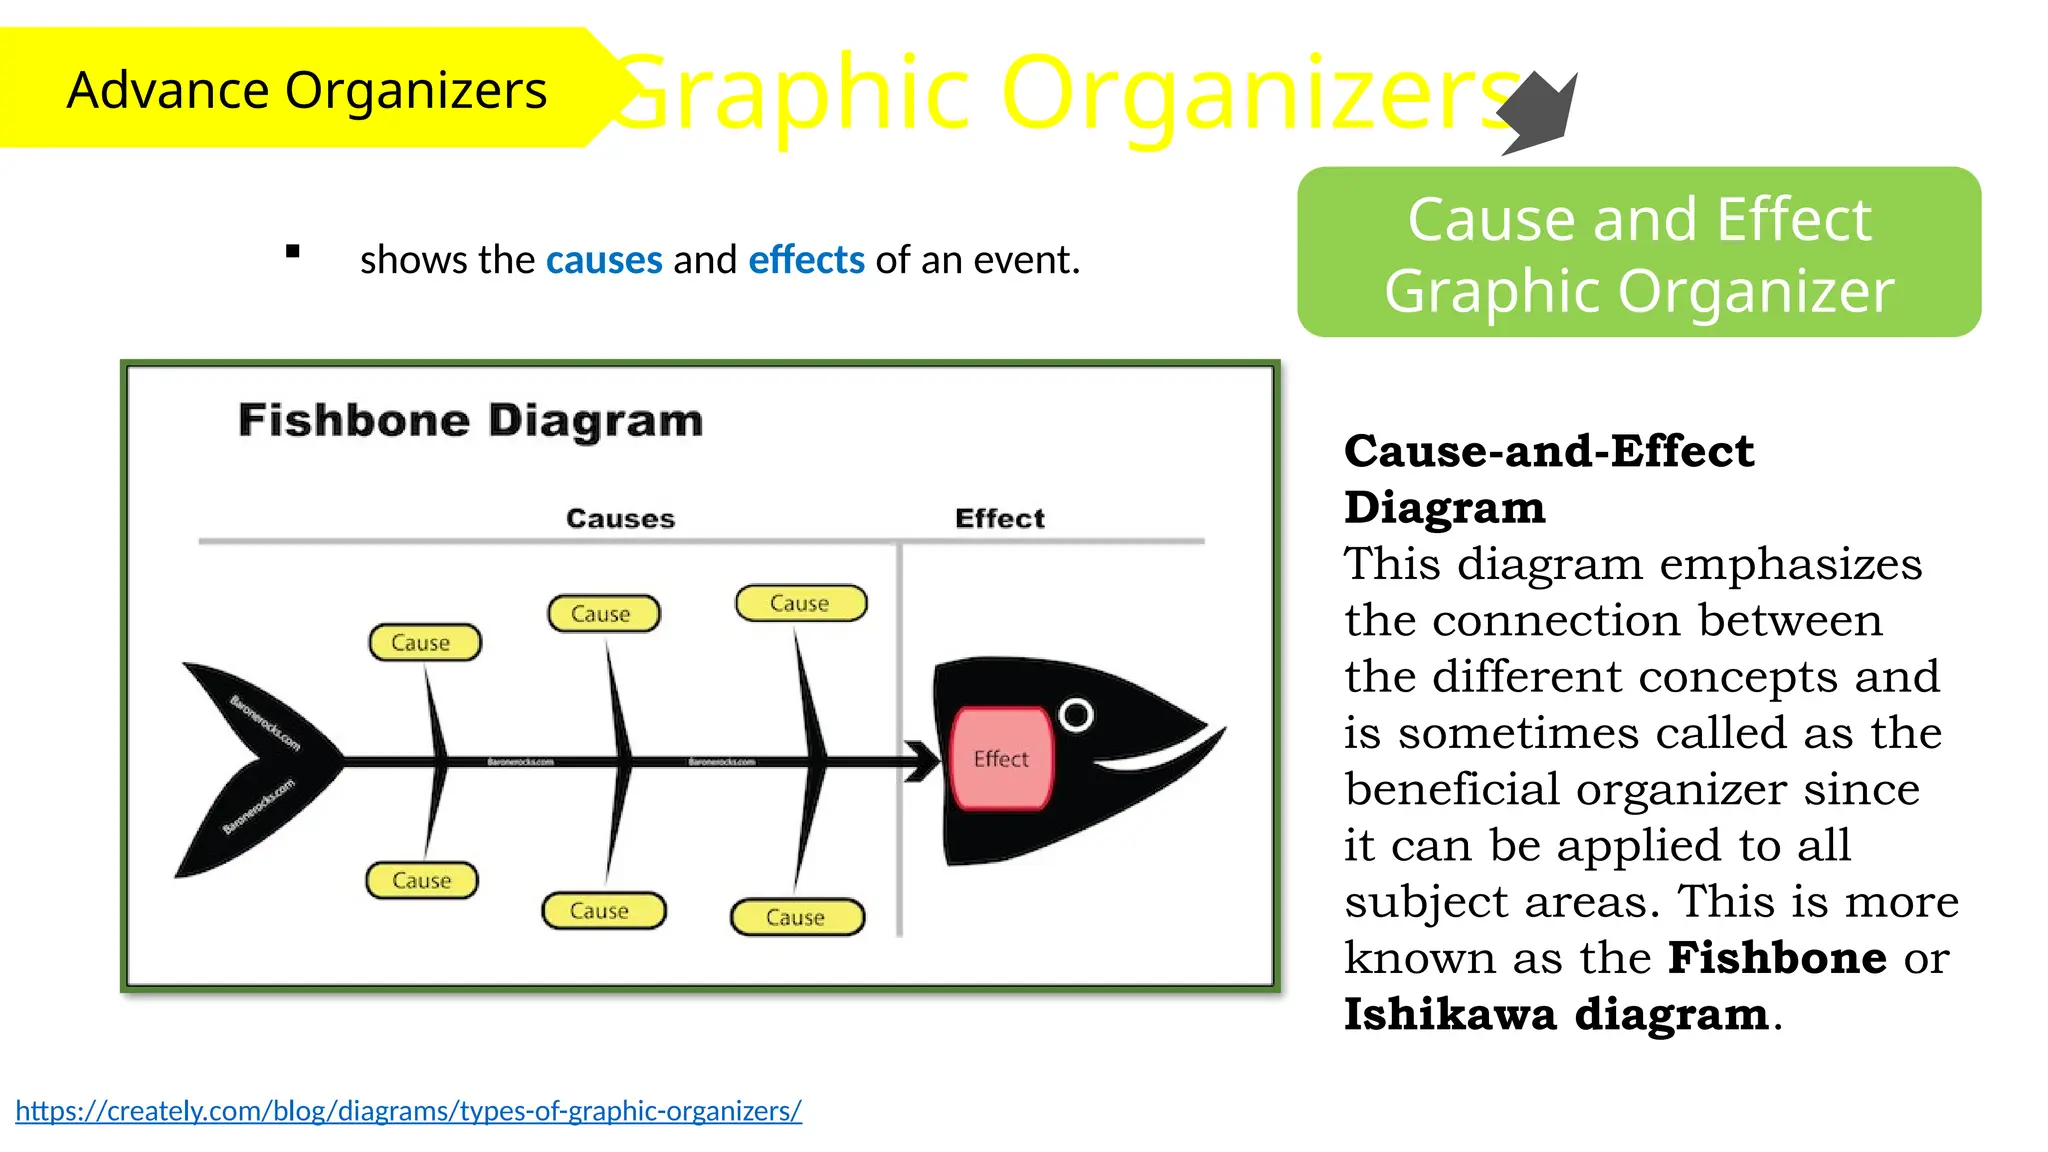
Cause and Effect
Graphic Organizer
shows the causes and effects of an event.
https://creately.com/blog/diagrams/types-of-graphic-organizers/
Cause-and-Effect
Diagram
This diagram emphasizes
the connection between
the different concepts and
is sometimes called as the
beneficial organizer since
it can be applied to all
subject areas. This is more
known as the Fishbone or
Ishikawa diagram.
31.
Advance Organizers GraphicOrganizers
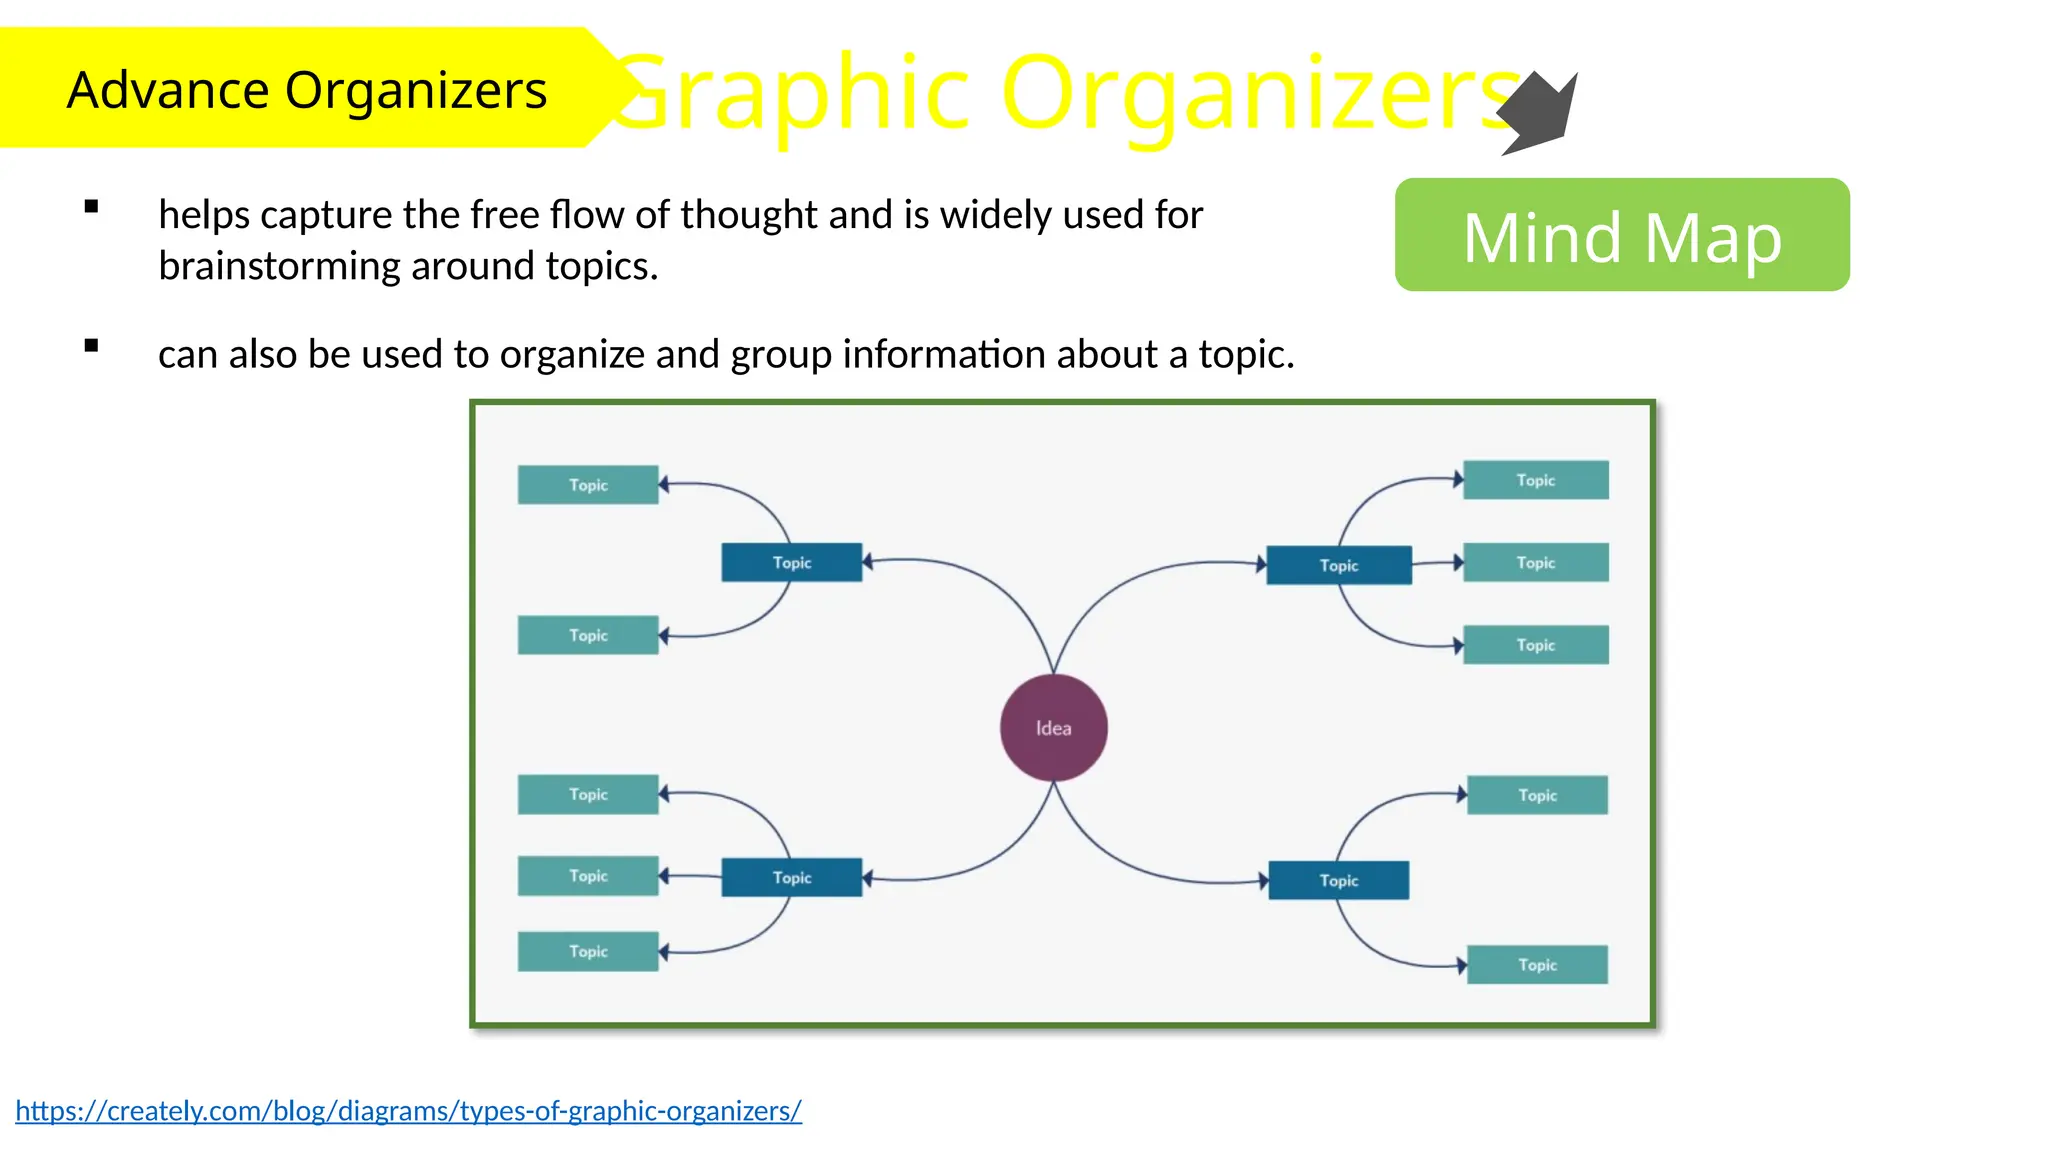
Mind Map
helps capture the free flow of thought and is widely used for
brainstorming around topics.
https://creately.com/blog/diagrams/types-of-graphic-organizers/
can also be used to organize and group information about a topic.
32.
Advance Organizers GraphicOrganizers
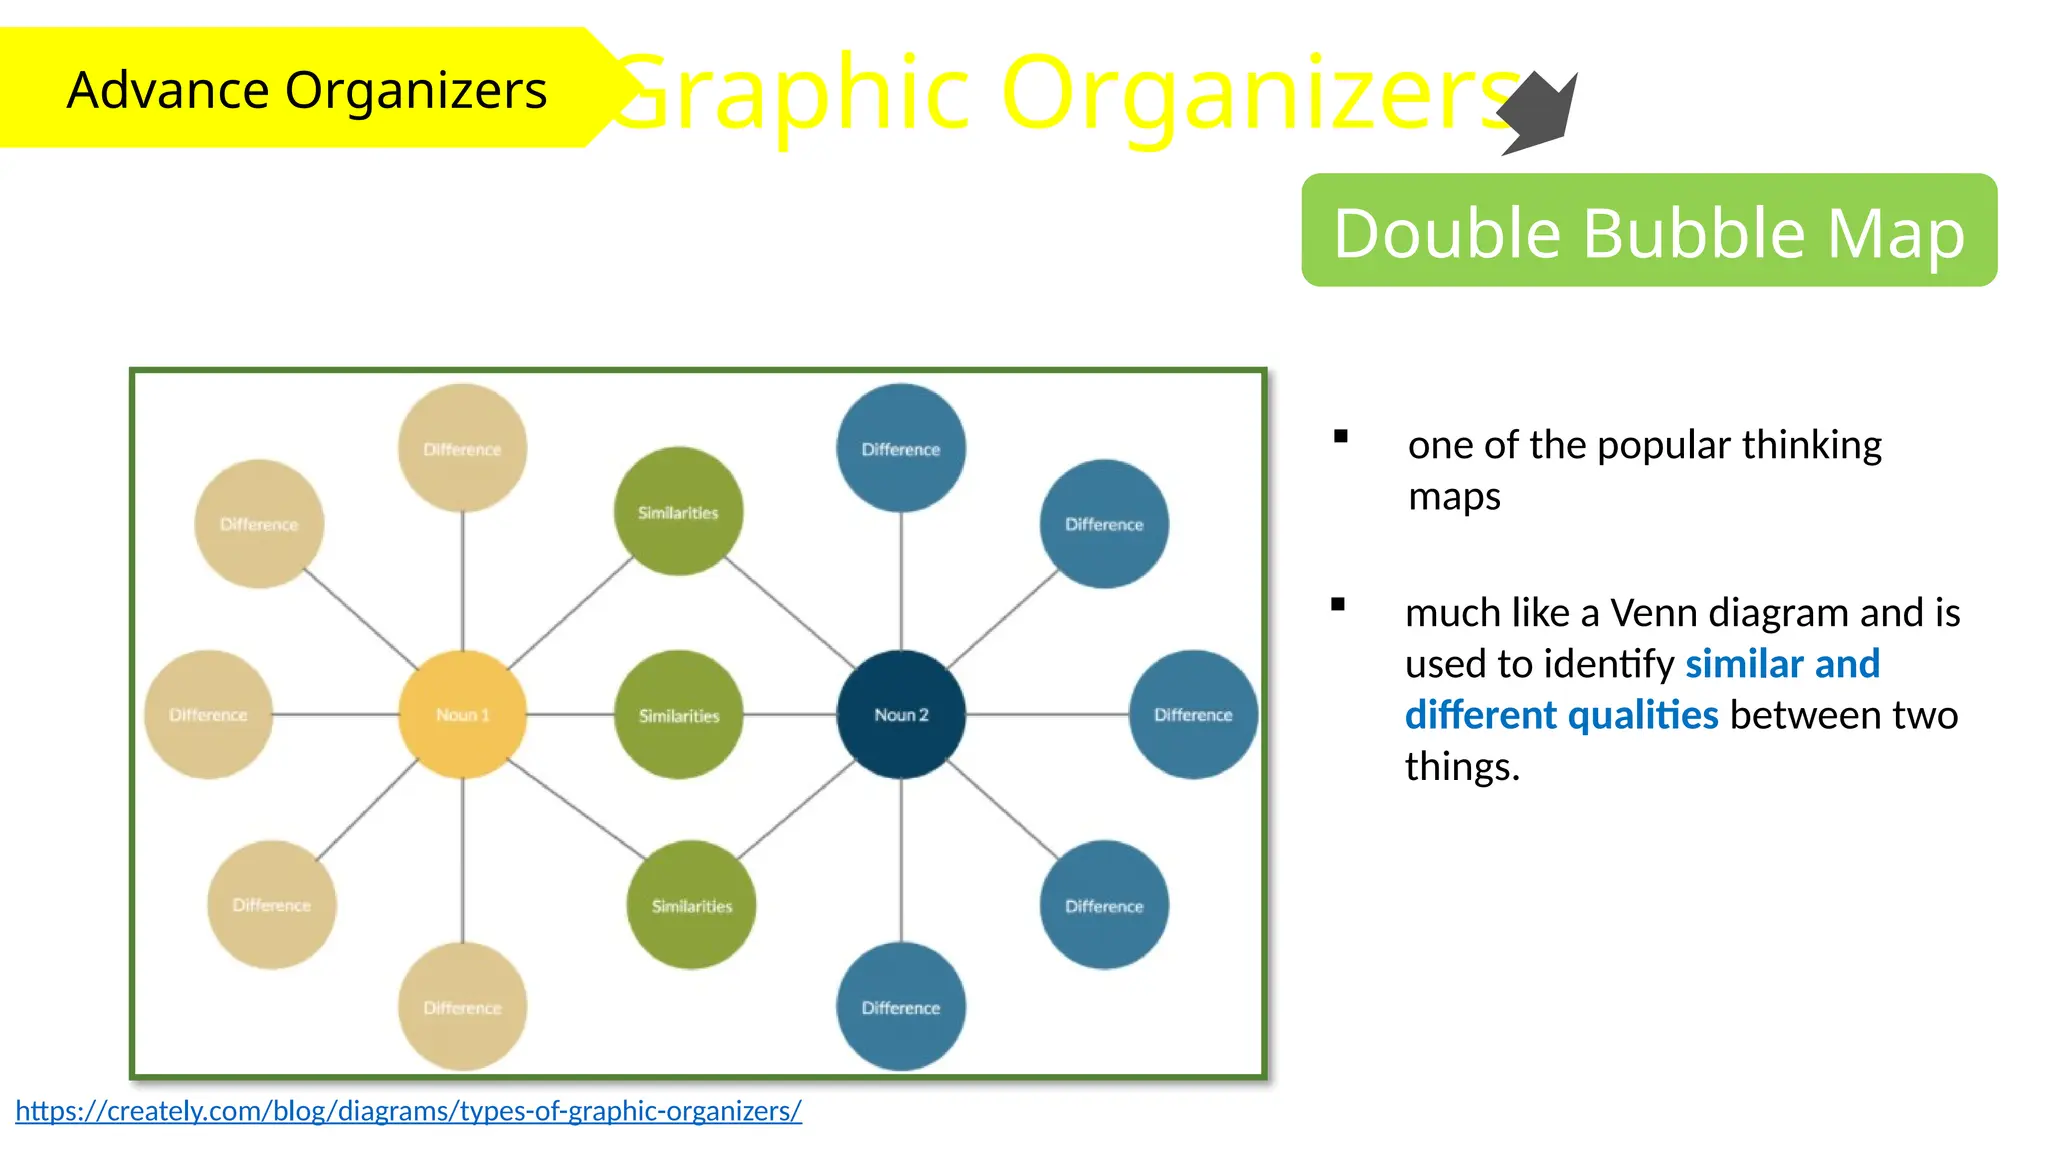
Double Bubble Map
one of the popular thinking
maps
https://creately.com/blog/diagrams/types-of-graphic-organizers/
much like a Venn diagram and is
used to identify similar and
different qualities between two
things.
33.
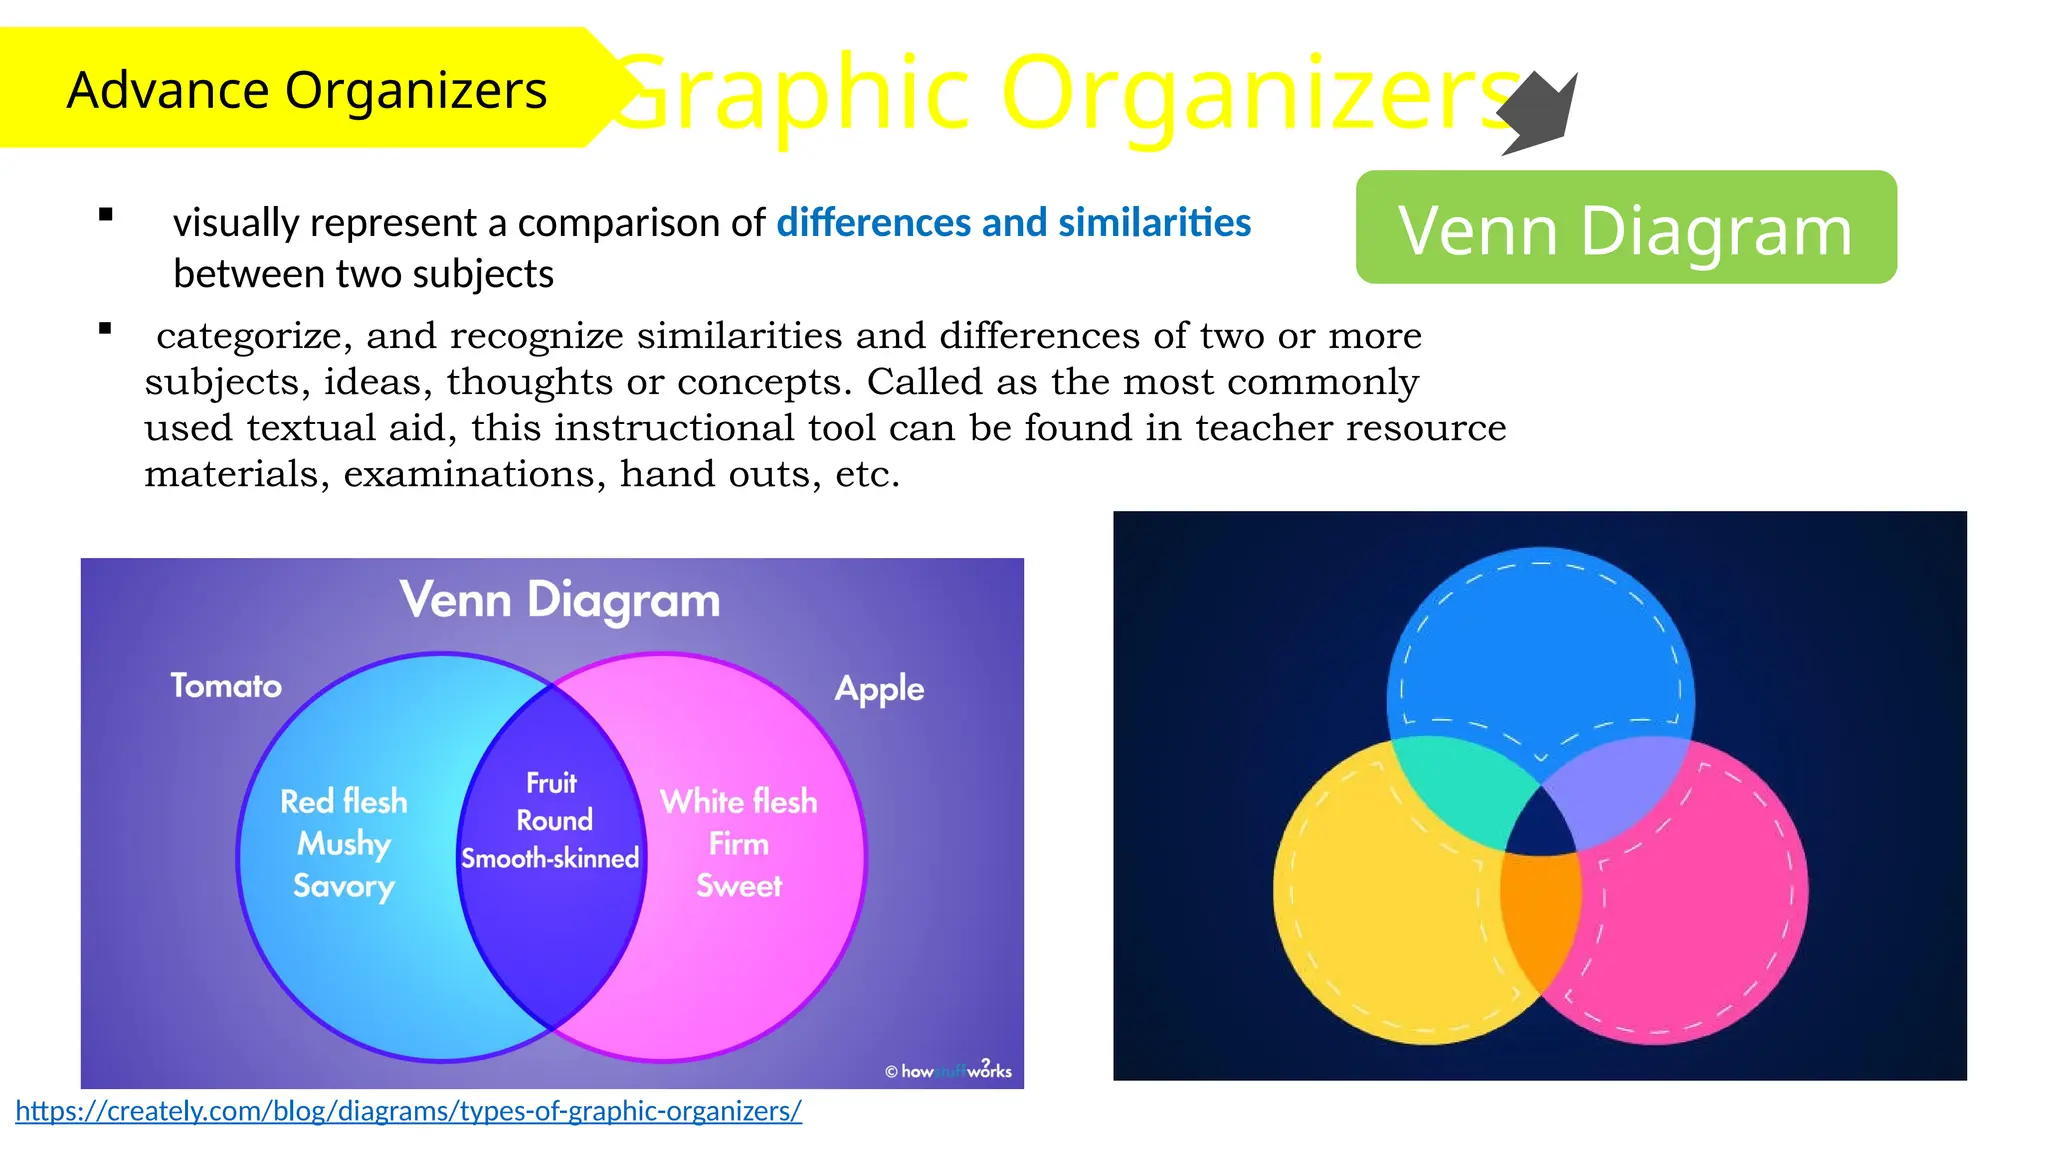
Advance Organizers GraphicOrganizers
Venn Diagram
visually represent a comparison of differences and similarities
between two subjects
https://creately.com/blog/diagrams/types-of-graphic-organizers/
categorize, and recognize similarities and differences of two or more
subjects, ideas, thoughts or concepts. Called as the most commonly
used textual aid, this instructional tool can be found in teacher resource
materials, examinations, hand outs, etc.
34.
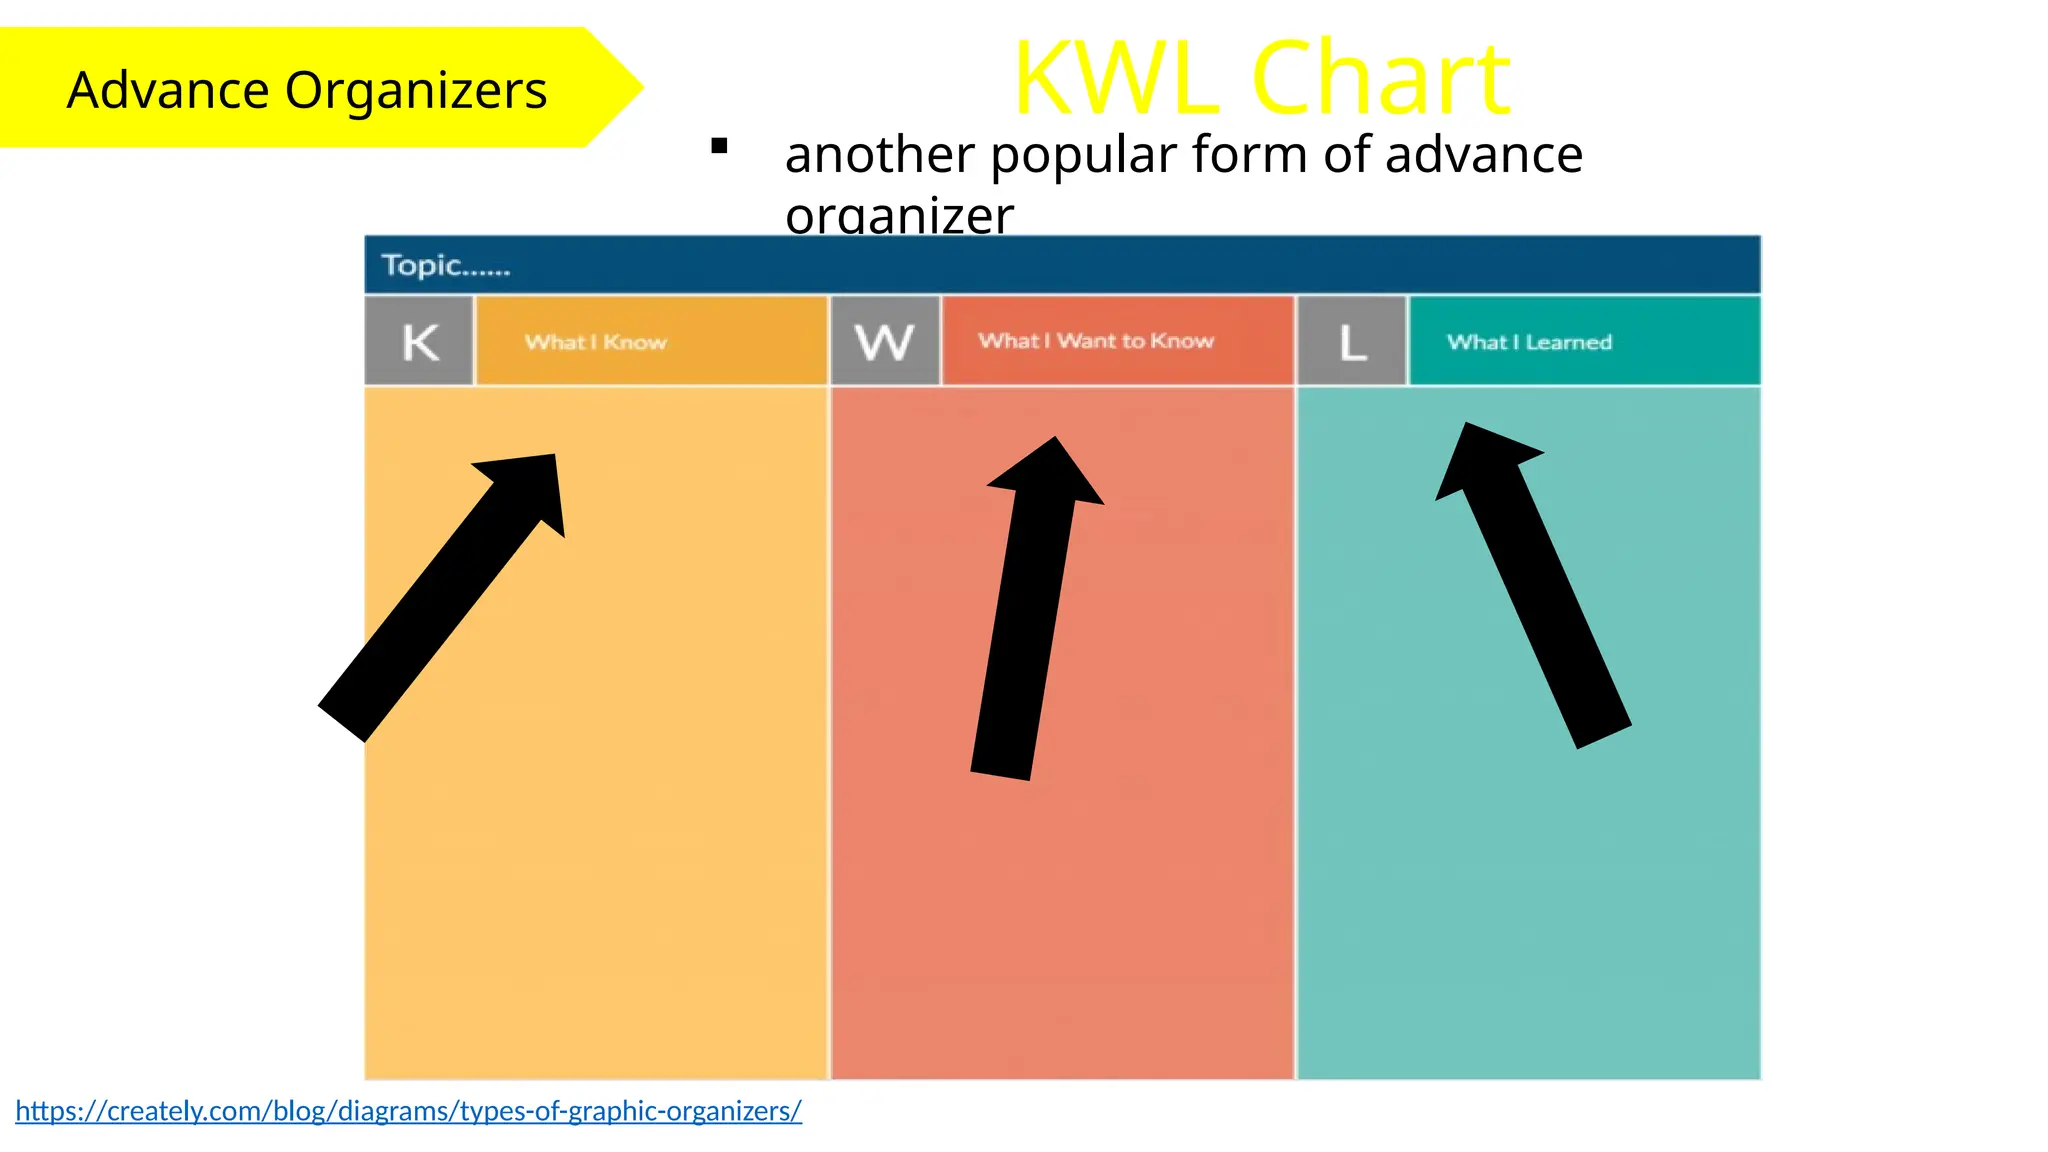
Advance Organizers KWLChart
https://creately.com/blog/diagrams/types-of-graphic-organizers/
another popular form of advance
organizer
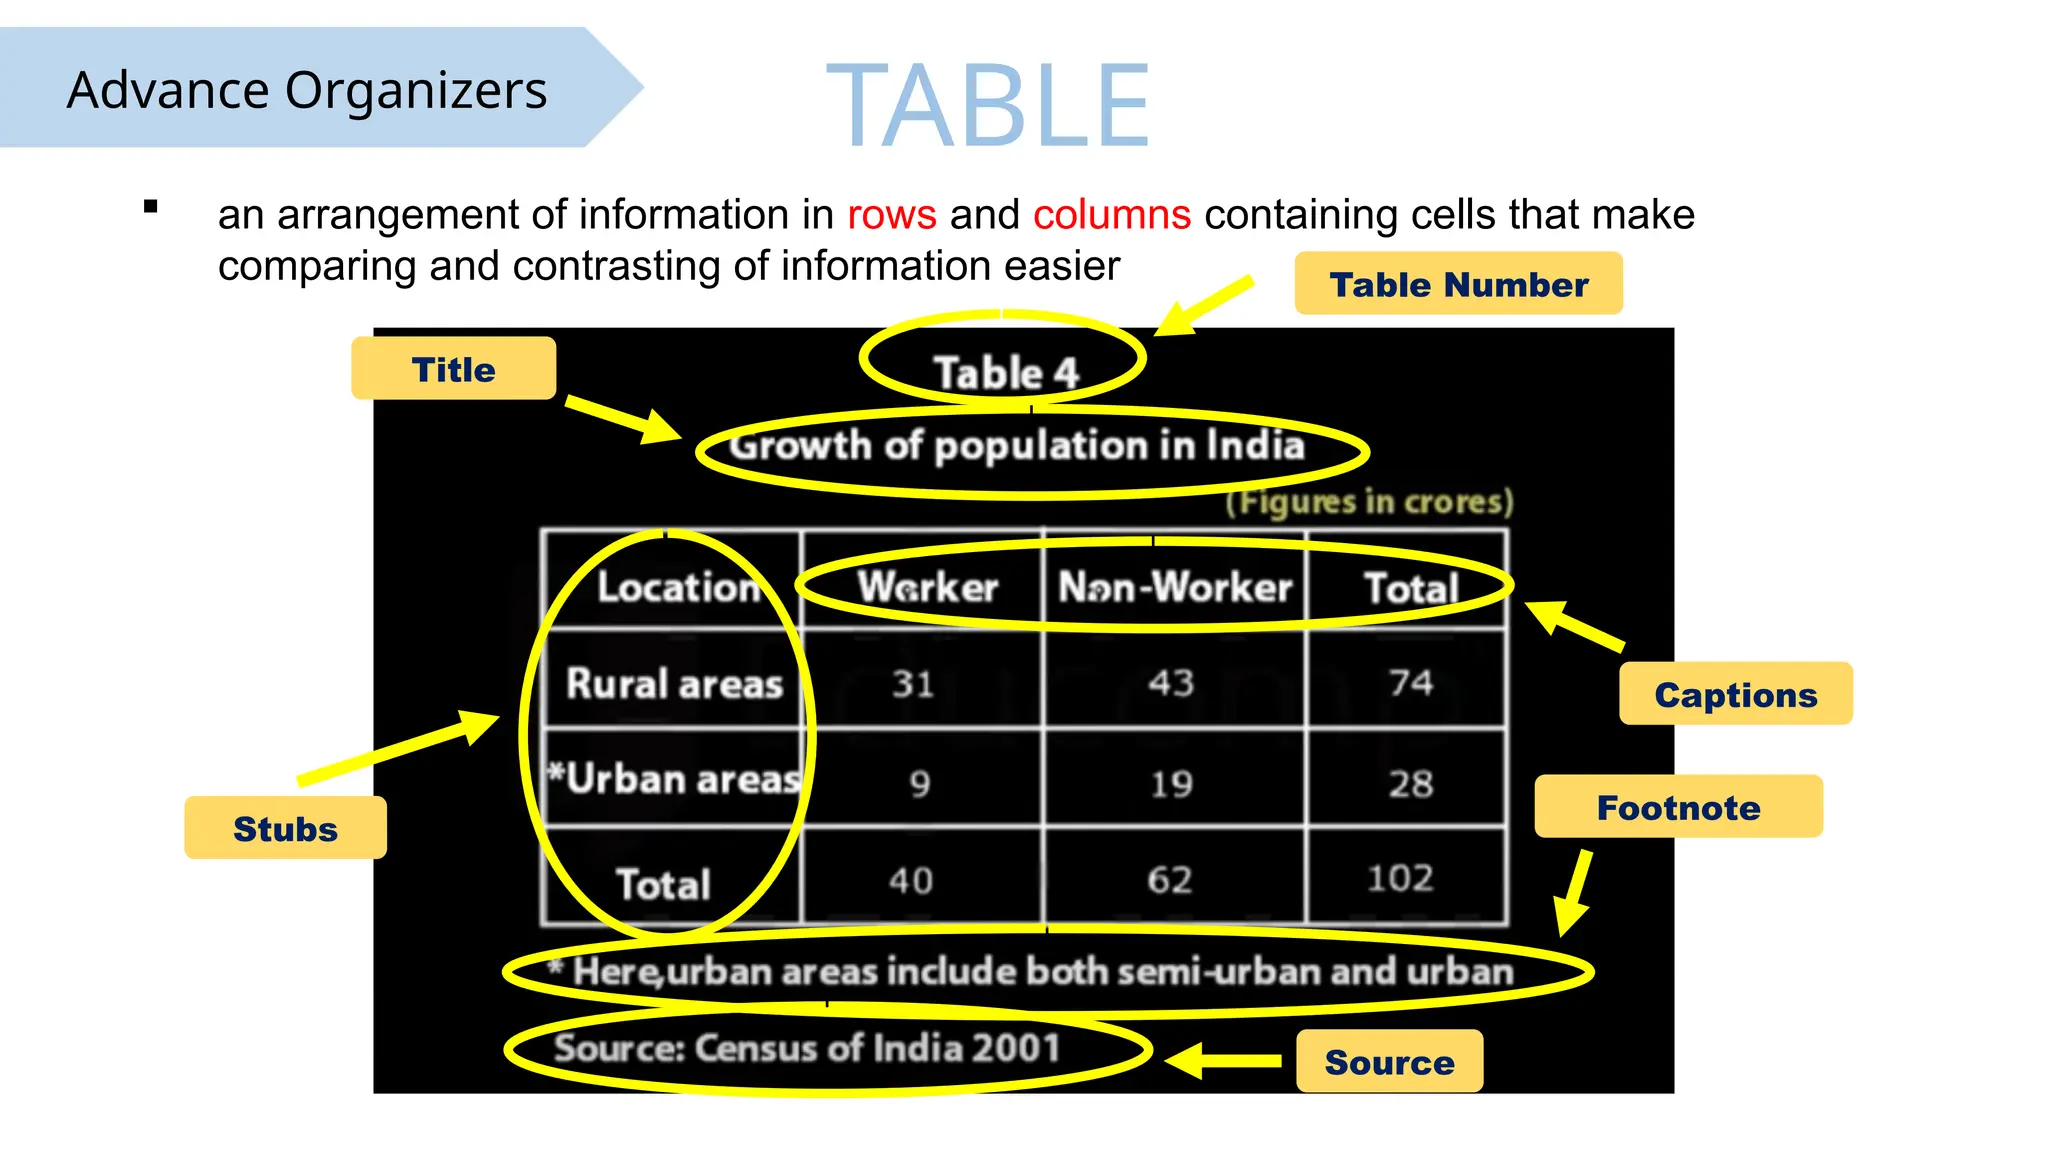
Advance Organizers
TABLE
anarrangement of information in rows and columns containing cells that make
comparing and contrasting of information easier Table Number
Title
Captions
Stubs
Footnote
Source
40.
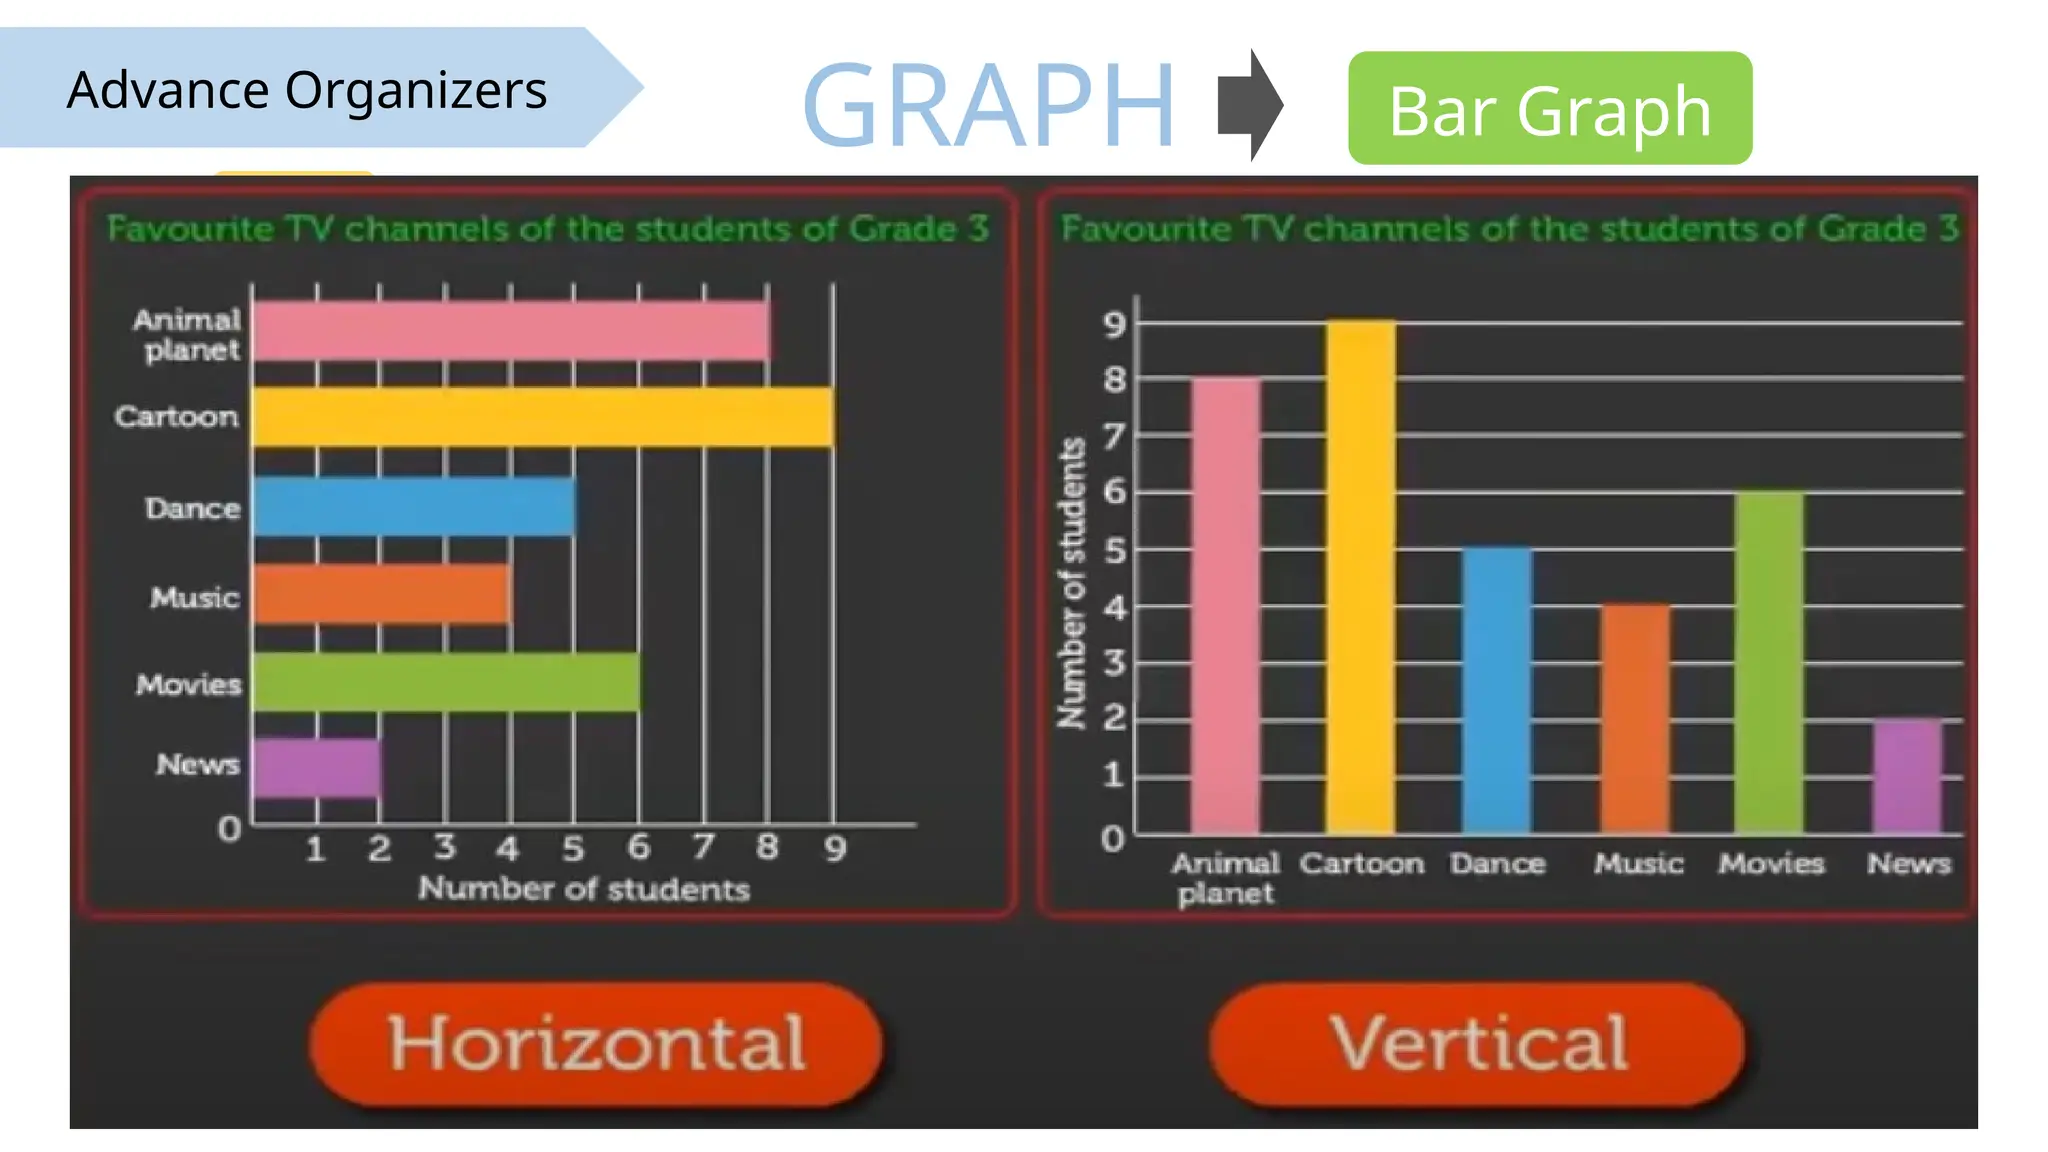
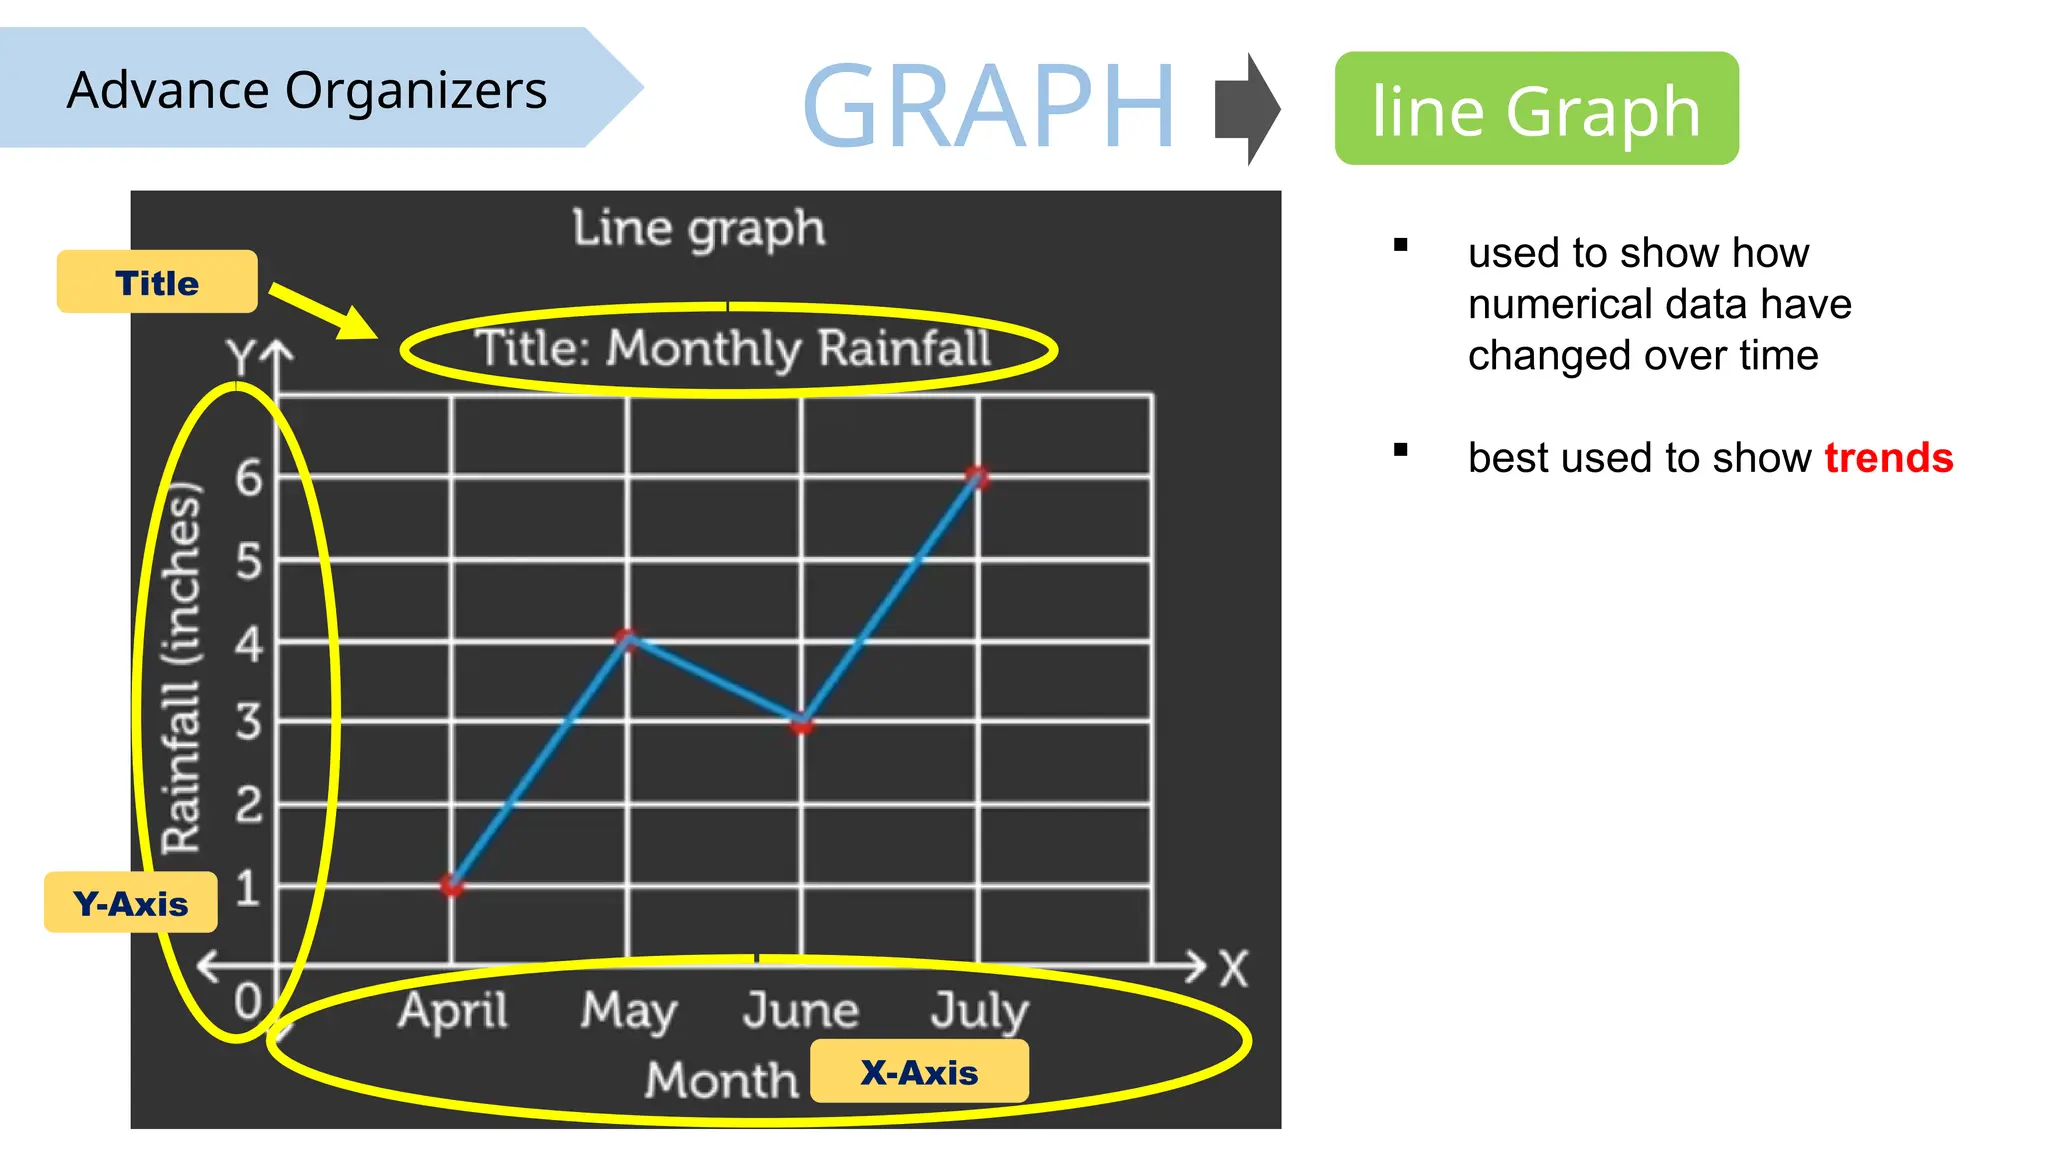
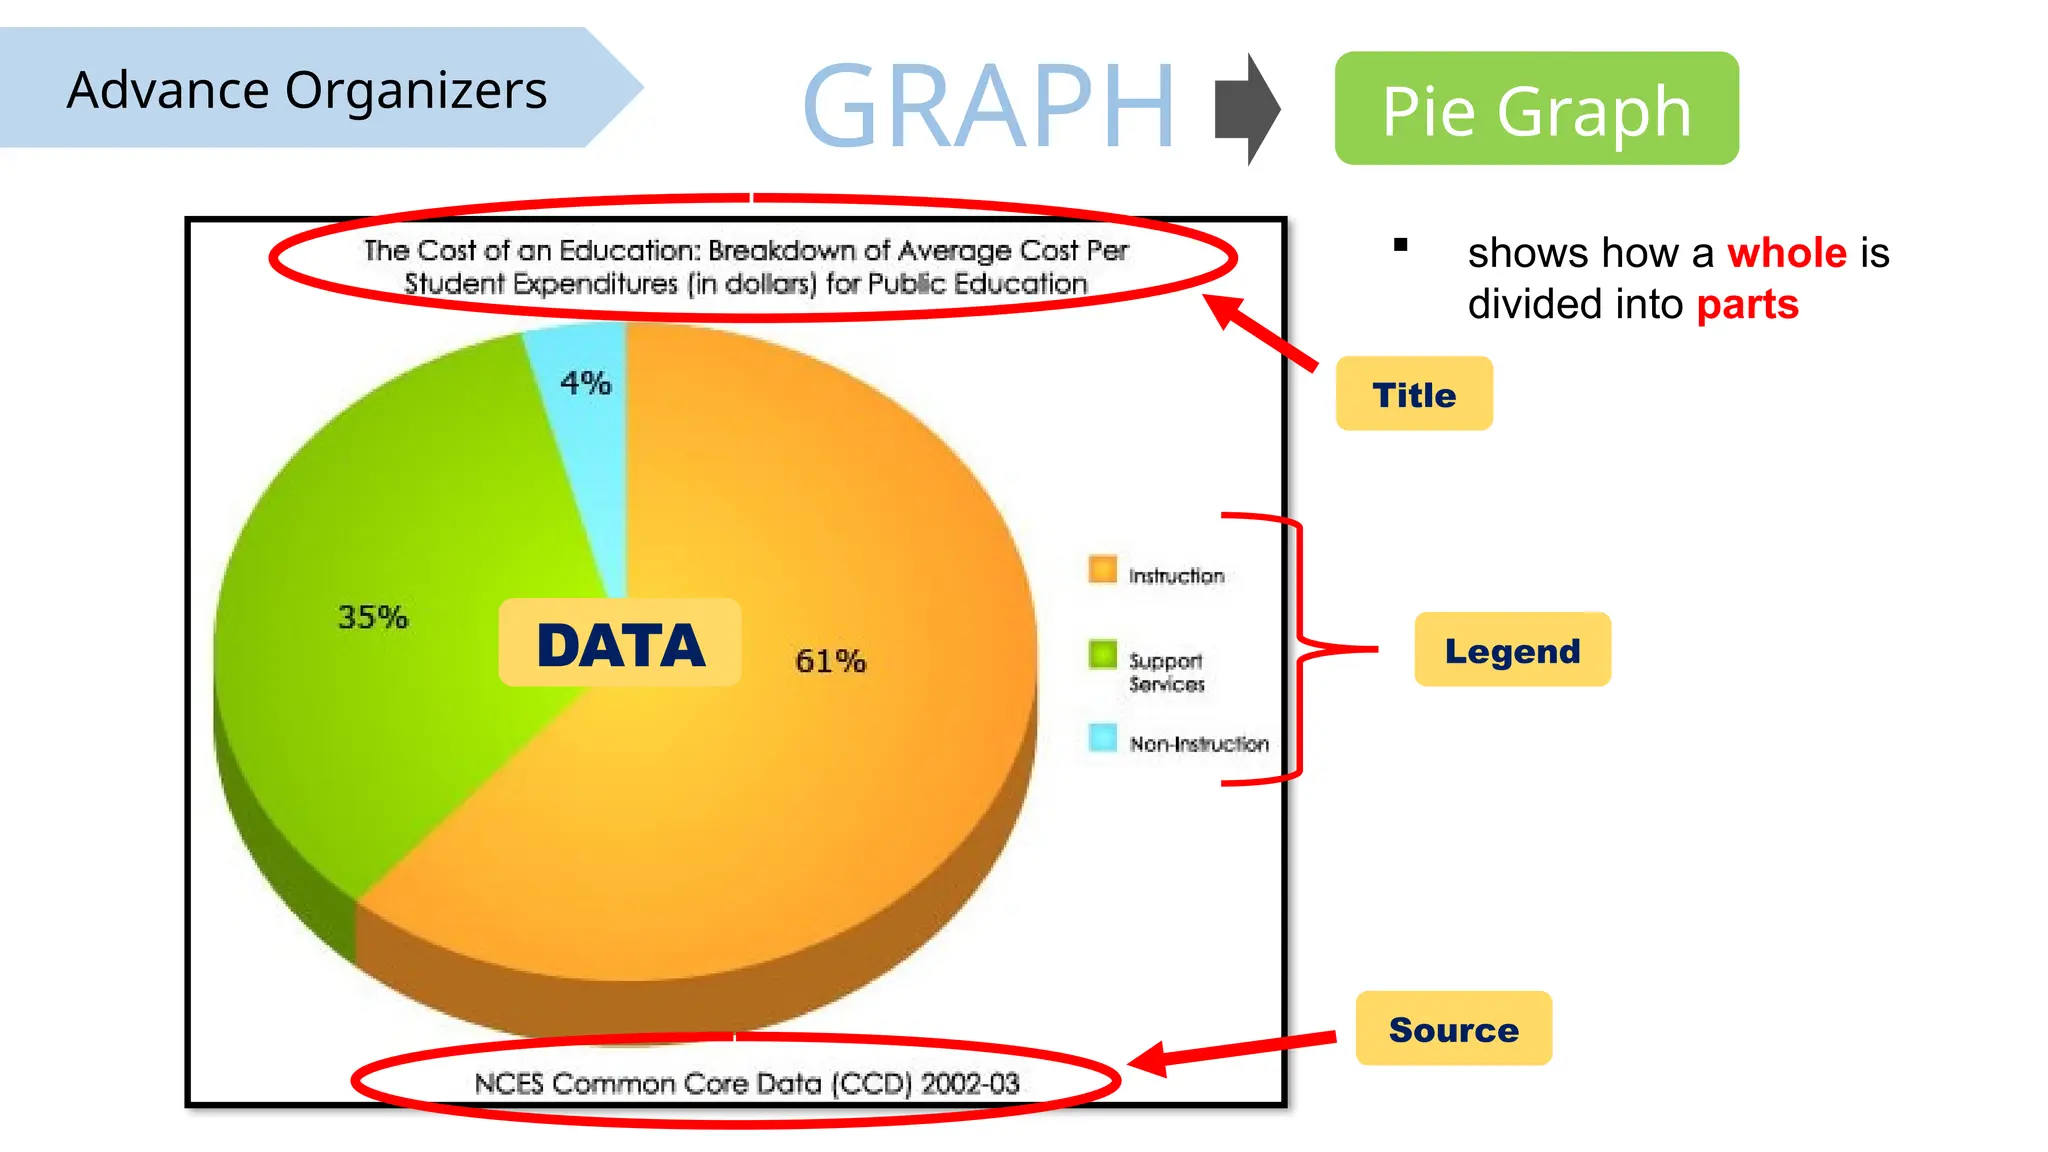
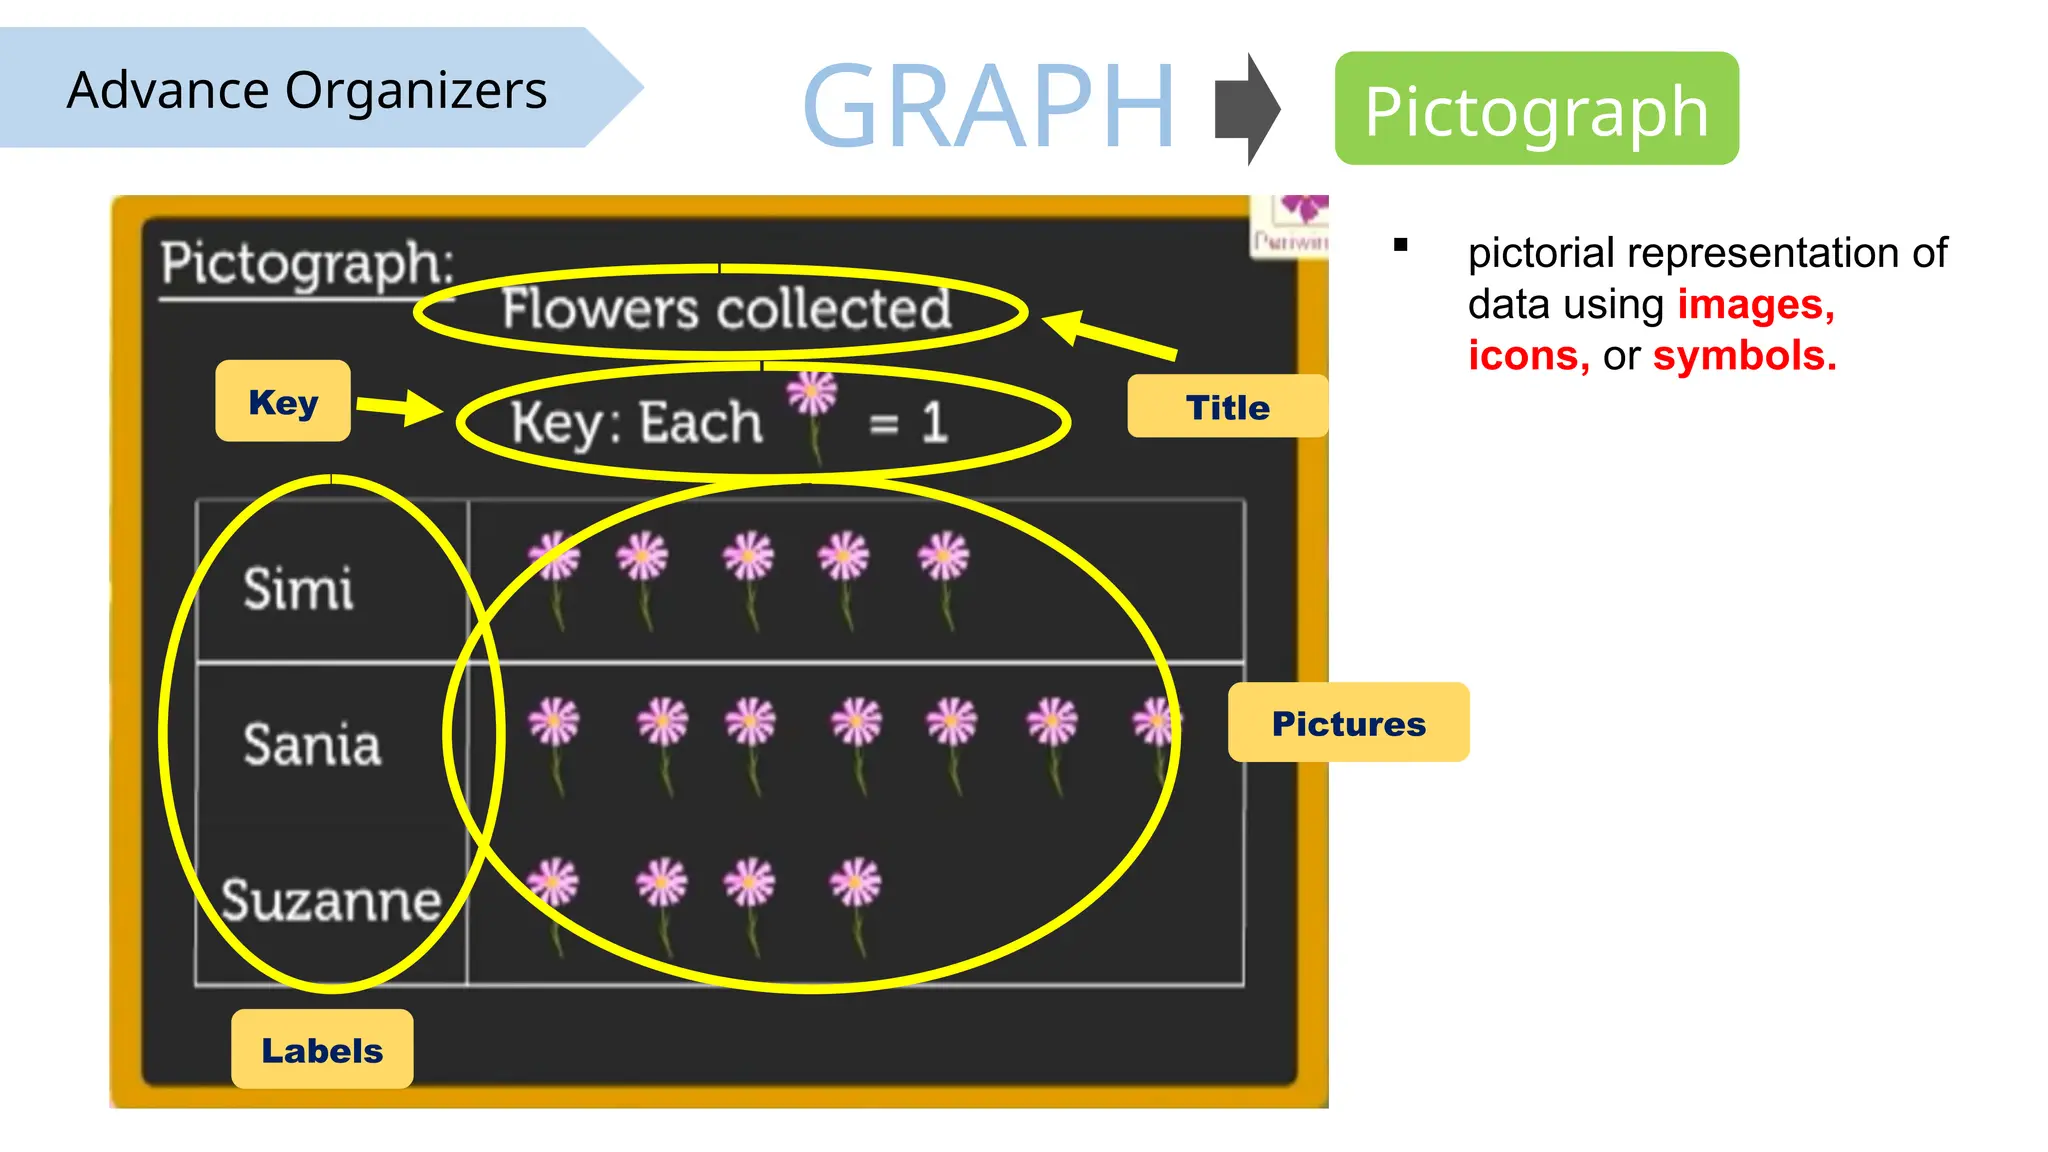
Advance Organizers
GRAPH
usedwhen a simple table cannot adequately
demonstrate important relationships of and within data
(Mind Tools Content Team, 2020)
Bar Graph
uses either vertical or
horizontal bars to show
the data it represents
Title
LABELS
BARS
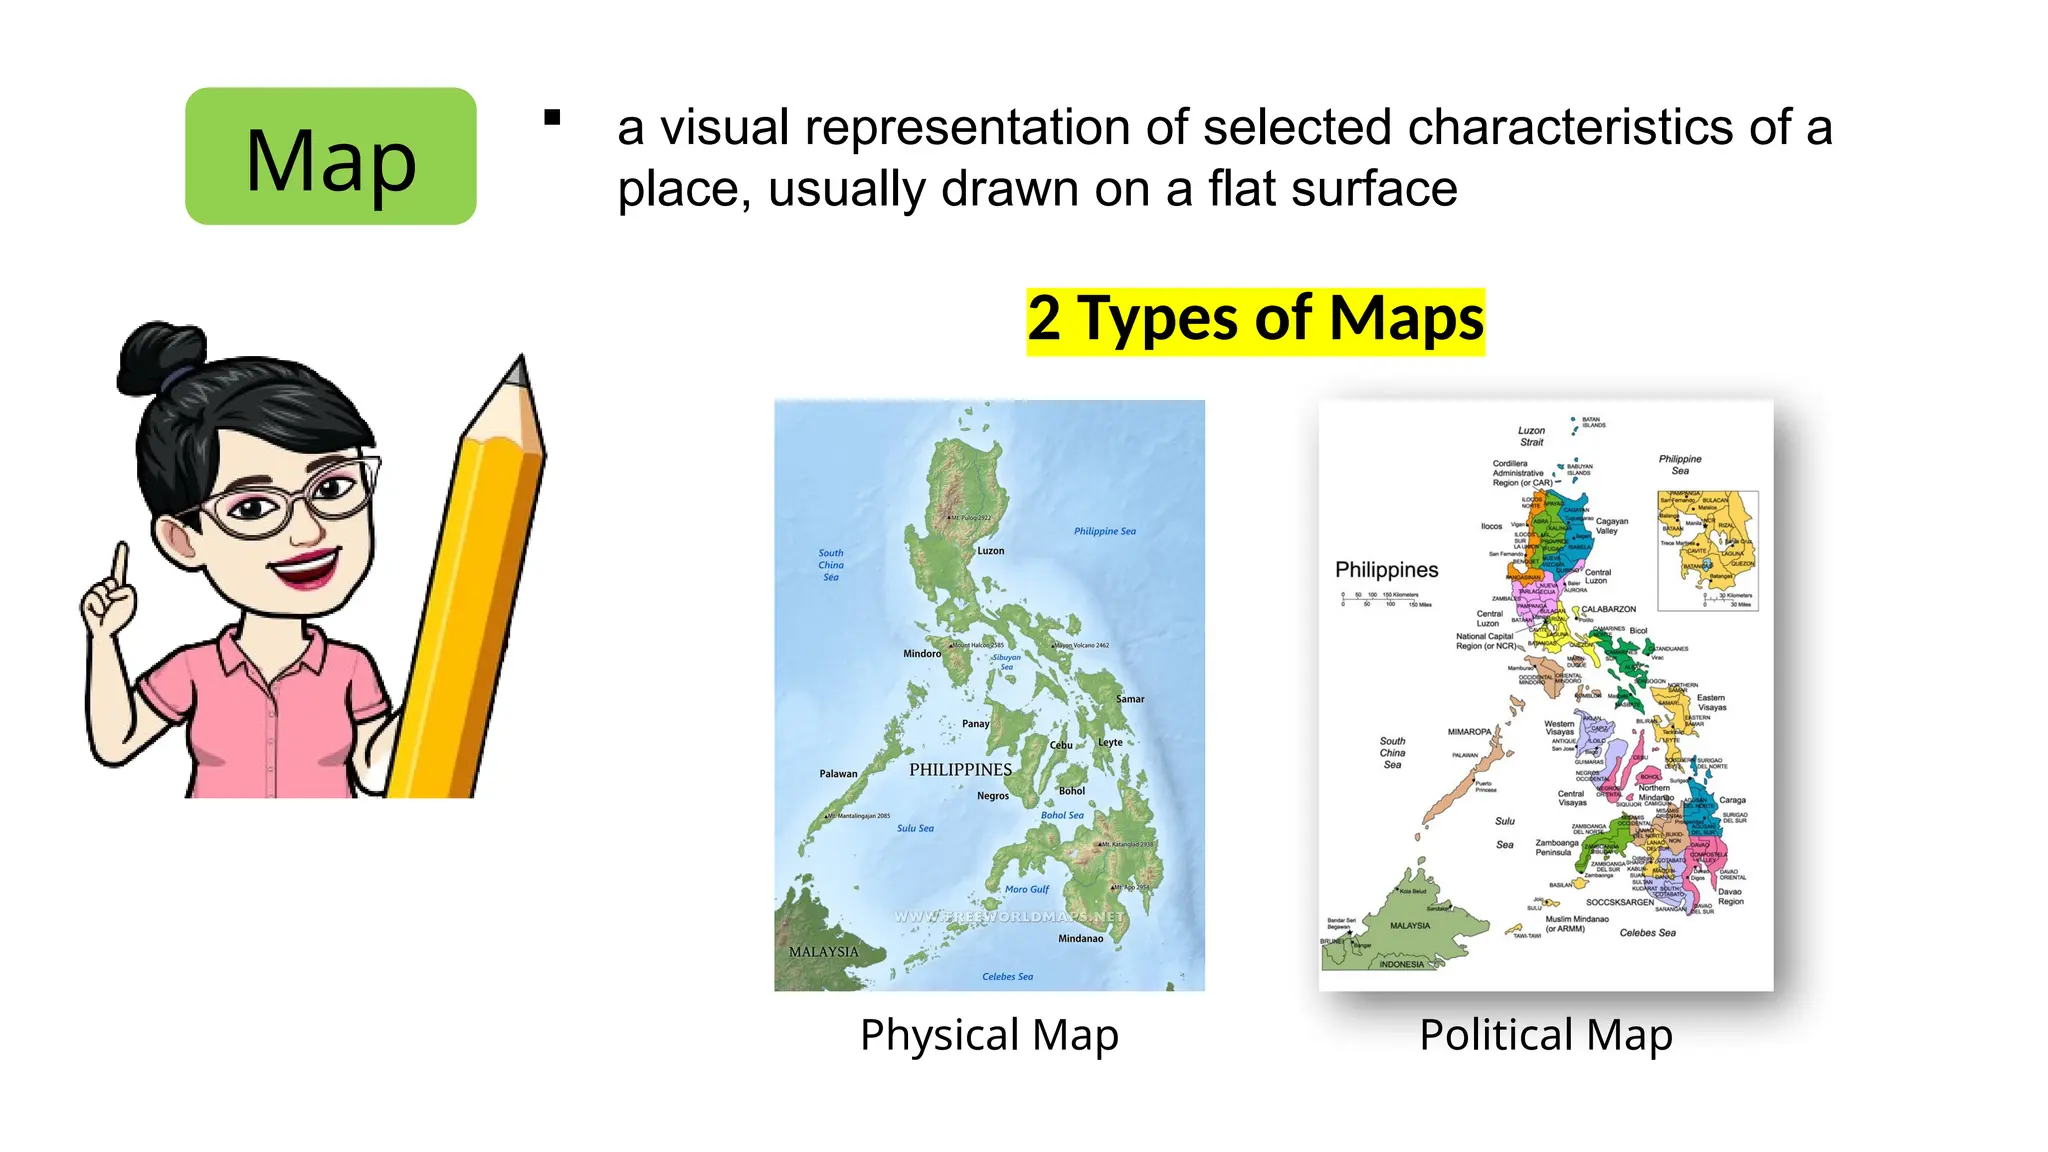
Advance Organizers
Map
a visualrepresentation of selected characteristics of a
place, usually drawn on a flat surface
2 Types of Maps
Physical Map Political Map
46.
Transcoding Linear toNonlinear Text and vice versa
Transcoding Linear to Nonlinear text and vice versa is a
skill that one has to be familiar with since it can be
used in our everyday lives. There will be times when you
would have to transcode a linear text to nonlinear text
to make it easier for other people to understand it and a
nonlinear text to linear text to have a detailed
description of a certain topic.
Learning Task 2:In your notebook, transform the text below into a
non-textual information source.
Sharks and whales are classic examples of two different animals
revealing similar traits in the same environment. One of the similarities
of these two marine animals is their habitat. They both live in the vast
range of depth in their environment. They also have the same fin
structure. They only have a single tail for propulsion and because they
are both large aquatic animals, they both consume large volume of
food; however, sharks hunt for their food. Whales do not have this
hunting tendency. Another difference of sharks to whales is their class.
Whales are mammals while sharks are fish but they both live in the
ocean. Also, whales have bones while sharks only have cartilages.