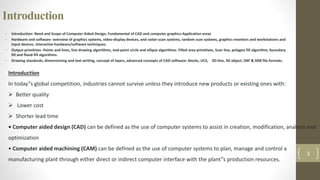
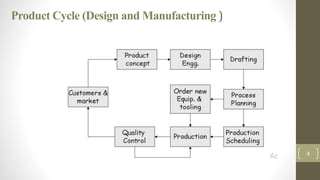
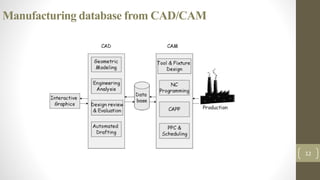
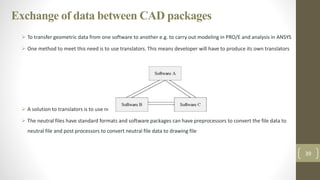
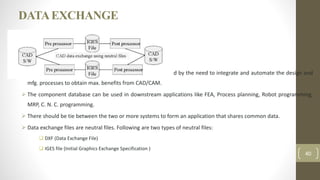
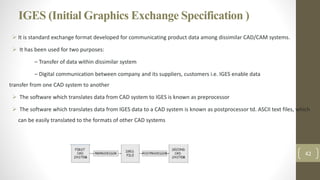
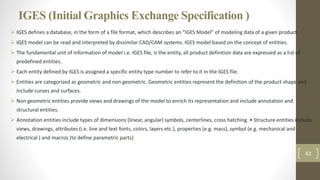
ComputerAided Engineering
1
Course Objective
2
This course will advance the students' knowledge on application of computers in design
and manufacturing development of the product. They learn the basic concepts of
CAD/CAM technology, modeling techniques, methods of product design using CAD
packages, hardware configuration of design workstation and software transformation
principles, along with CAM, CNC, DNC, FMS, CAPP concepts in order to understand various
manufacturing operations, production management modules, scheduling techniques and
MRP concepts
Introduction
• Introduction- Need and Scope of Computer Aided Design, Fundamental of CAD and computer graphics-Application areas
• Hardware and software- overview of graphics systems, video-display devices, and raster-scan systems, random scan systems, graphics monitors and workstations and
input devices. Interactive hardware/software techniques.
• Output primitives- Points and lines, line drawing algorithms, mid-point circle and ellipse algorithms. Filled area primitives, Scan line, polygon fill algorithm, boundary
fill and flood-fill algorithms.
• Drawing standards, dimensioning and text writing, concept of layers, advanced concepts of CAD software- blocks, UCS, 3D-line, 3D object, DXF & DXB file formats.
3
Introduction
In today‟s global competition, industries cannot survive unless they introduce new products or existing ones with:
 Better quality
 Lower cost
 Shorter lead time
• Computer aided design (CAD) can be defined as the use of computer systems to assist in creation, modification, analysis and
optimization
• Computer aided machining (CAM) can be defined as the use of computer systems to plan, manage and control a
manufacturing plant through either direct or indirect computer interface with the plant‟s production resources.
Product Cycle (Design and Manufacturing )
4
Product Cycle revised with CAD/CAM overlaid
5
Need and Scope of CAD
Need
 Reducing lead time
 Creation of 3D Model
 Quick Changes to market
 Documentation
 Make copy as many as possible
 Manual Error Elimination
Scope
 Geometrical Modelling
 Analysis
 Review and Optimization
 Automation Drafting
6
The Design Process
7
The Application of computer
for Design
Conventional
Design
The Design Process – Shigley
8
Conventional
Design
The Design Process – Pahl and Beitz model
9
The Design Process – Earl model
10
The Design Process – Oshuga model
11
Manufacturing database from CAD/CAM
12
Benefits of CAD
 Customer modifications are easier to make
 Rapid response of the design analysis
 Improved accuracy of design
 Avoidance of subcontracting to meet schedules
 Provide better functional analysis to reduce prototype testing
 Avoidance of subcontracting to meet schedules
 Assistance in preparation of documentation
 Minimized transcription errors
 Designs have more standardization
 Fewer errors in NC part programming
 Better communication interfaces and greater understanding among engineers, designers, drafters, management and
different project groups.
13
Hardware Requirements of CAD
CAD system would include the following hardware components
 One or more workstations. These would consist of
 A graphics terminal
 Operator input devices
 One or more plotters and other output devices
 Central Processing unit (CPU)
 Secondary storage
14
Configuration of CAD Workstation
Computer Graphic display
• The graphics display ( is considered an important component for viewing images, it
enables the user to communicate with the displayed image by adding, deleting,
blanking, and moving graphics entities on the display screen.
• The following display devices are used:
• Refresh Cathode Ray Tube
• Random Scan and Raster Scan
• Color CRT Monitors
• Direct View Storage Tubes
• Flat Panel Display
• Lookup Table
15
Digital information
Electrical Signal
Visible image
Block Diagram of display processor
Display
controller
Display
Generator
Display
console
16
Display file
memory
Random Scan Display
• Random Scan System uses an electron beam which operates like a pencil to create a
line image on the CRT screen.
• The picture is constructed out of a sequence of straight line segments Each line
segment is drawn on the screen by directing the beam to move from one point on the
screen to the next, where its x & y coordinates define each
17
Raster Scan Display
• A Raster Scan Display is based on intensity control of pixels in the form of a rectangular
box called Raster on the screen.
• Where Pixel abbreviated as Picture Element, is a single point in a graphic image
Graphics monitors display pictures by dividing the display screen into thousands (or
millions) of pixels, arranged in rows and columns.
• Pixels are combined to form a complete image, video, text or any visible thing on a
computer display
18
Raster Scan Display
• Information of on and off pixels is stored in refresh buffer or Frame buffer.
• Televisions in our house are based on Raster Scan Method
• The raster scan system can store information of each pixel position, so it is suitable for
realistic display of objects.
• Raster Scan provides a refresh rate of 60 to 80 frames per second
19
Image generation in computer graphics
• Cathode Ray Tube
20
Cathode Ray Tube
Techniques
 Stroke writing (line drawing, random position,
vector writing and directed beam )
 Raster scan (digital TV and scan graphics)
Stroke writing vs Raster scan
Stroke writing
21
Raster scan
x2,y2
x1,y1
x3,y3
x5,y5
x4,y4 x6,y6
number of pixels in the raster display might be range from 256 X 256 (a
total of 65,000 points) to 1024 X 1024 (a total of 10,00,000 points)
•
Output Primitives
• Process of representing continuous graphics object as a collection of discrete pixels is
called as Scan conversion.
• Convert each primitive form into a set of pixels in image space is referred to as scan
conversion (or) rasterization.
• Condition
• User can edit graphics object with keyboard, mouse or touch sensitive panel on screen
• Objects should be independent of length & orientation.
22
23
Circle DrawingAlgorithm –
Bresenham’s
24
25
26
27
28
29
Ellipse DrawingAlgorithm – Midpoint
30
31
32
33
34
35
Graphics Standards
 The need for portability of the geometric model among different hardware platforms has led to the
development of device independent graphics
 Simultaneously standards for exchange of drawing data base among software packages have been
developed to facilitate integration of design and manufacturing operations
 The heart of any CAD model is the component database.
 This includes the graphics entities like points, lines, arcs etc. and coordinate points which define the
location of these entities
 This geometric data is used in all downstream applications of CAD, which include finite element
modeling and analysis, process planning, estimation, CNC programming, Robot programming,
programming of CMM, MRP systems 36
Graphics Standards ….
To achieve high level of integration between CAD, analysis and manufacturing operations, the database must contain:
 Shapes of the components ( based on 3-D wire frame or solid model )
 Bill of materials (BOM), of the assembly which the components are used.
 Materials of the components
The manufacturing, test and assembly procedures to carried out to produce a component so that it is capable of
functioning as per requirements of design In designing data structure for CAD database the following factors to be
considered:
 The data must be neutral
 The data structure must be user friendly
 The data base must be portable
37
Graphical Output
The main objective of the Graphical Kernel System, GKS, is the production and manipulation of pictures (in a way that does not depend
on the computer or graphical device being used). Such pictures vary from simple line graphs (to illustrate experimental results, for
example), to engineering drawings, to integrated circuit layouts (using colour to differentiate between layers), to images representing
medical data (from computerized tomographic (CT) scanners) or astronomical data (from telescopes) in grey scale or colour. Each of
these various pictures must be described to GKS, so that they may be drawn
In GKS, pictures are considered to be constructed from a number of basic building blocks. These basic building blocks, or primitives as
they are called, are of a number of types each of which can be used to describe a different component of a picture. The five main
primitives in GKS are:.
• polyline: which draws a sequence of connected line segments.
• polymarker: which marks a sequence of points with the same symbol.
• fill area: which displays a specified area.
• text: which draws a string of characters.
• cell array: which displays an image composed of a variety of colours or grey scales.
38
Exchange of data between CAD packages
 To transfer geometric data from one software to another e.g. to carry out modeling in PRO/E and analysis in ANSYS
 One method to meet this need is to use translators. This means developer will have to produce its own translators
 A solution to translators is to use neutral files
 The neutral files have standard formats and software packages can have preprocessors to convert the file data to
neutral file and post processors to convert neutral file data to drawing file
39
DATAEXCHANGE
 The need for exchanging modeling data is directly motivated by the need to integrate and automate the design and
mfg. processes to obtain max. benefits from CAD/CAM.
 The component database can be used in downstream applications like FEA, Process planning, Robot programming,
MRP, C. N. C. programming.
 There should be tie between the two or more systems to form an application that shares common data.
 Data exchange files are neutral files. Following are two types of neutral files:
 DXF (Data Exchange File)
 IGES file (Initial Graphics Exchange Specification )
40
DXF (Data Exchange File)
 DXF files are std. ASCII text files, which can be easily translated to the formats of other CAD systems
 The DXF facility is available in several drafting packages.
 In case of Auto CAD , the data regarding the created drawing may require to view , modify or plotting. Also data can be
used for analysis purpose like FEA
 In case of Auto CAD , a drawing interchange file (DXF) can be generated from the existing drawing by means of DXFOUT
command.
 On the other hand a drawing interchange file can be converted into Auto CAD drawing by means of DXFIN command
 The general structure of DXF file is as follows: HEADER Section : general information of drawing TABLE Section : Linetype
(LTYPE) table Layer table Text style (STYLE) table User coordinate system (UCS) table View port configuration file (VPORT)
table BLOCKS Section ENTITIES Section END OF FILE
41
IGES (Initial Graphics Exchange Specification )
 It is standard exchange format developed for communicating product data among dissimilar CAD/CAM systems.
 It has been used for two purposes:
– Transfer of data within dissimilar system
– Digital communication between company and its suppliers, customers i.e. IGES enable data
transfer from one CAD system to another
 The software which translates data from CAD system to IGES is known as preprocessor
 The software which translates data from IGES data to a CAD system is known as postprocessor td. ASCII text files, which
can be easily translated to the formats of other CAD systems
42
IGES (Initial Graphics Exchange Specification )
 IGES defines a database, in the form of a file format, which describes an “IGES Model” of modeling data of a given product
 IGES model can be read and interpreted by dissimilar CAD/CAM systems. IGES model based on the concept of entities.
 The fundamental unit of information of model i.e. IGES file, is the entity, all product definition data are expressed as a list of
predefined entities.
 Each entity defined by IGES is assigned a specific entity type number to refer to it in the IGES file.
 Entities are categorized as geometric and non geometric. Geometric entities represent the definition of the product shape and
include curves and surfaces.
 Non geometric entities provide views and drawings of the model to enrich its representation and include annotation and
structural entities.
 Annotation entities include types of dimensions (linear, angular) symbols, centerlines, cross hatching. • Structure entities include
views, drawings, attributes (i.e. line and text fonts, colors, layers etc.), properties (e.g. mass), symbol (e.g. mechanical and
electrical ) and macros (to define parametric parts)
43

Computer Aided Engineering - Introduction

  • 1.
  • 2.
    Course Objective 2 This coursewill advance the students' knowledge on application of computers in design and manufacturing development of the product. They learn the basic concepts of CAD/CAM technology, modeling techniques, methods of product design using CAD packages, hardware configuration of design workstation and software transformation principles, along with CAM, CNC, DNC, FMS, CAPP concepts in order to understand various manufacturing operations, production management modules, scheduling techniques and MRP concepts
  • 3.
    Introduction • Introduction- Needand Scope of Computer Aided Design, Fundamental of CAD and computer graphics-Application areas • Hardware and software- overview of graphics systems, video-display devices, and raster-scan systems, random scan systems, graphics monitors and workstations and input devices. Interactive hardware/software techniques. • Output primitives- Points and lines, line drawing algorithms, mid-point circle and ellipse algorithms. Filled area primitives, Scan line, polygon fill algorithm, boundary fill and flood-fill algorithms. • Drawing standards, dimensioning and text writing, concept of layers, advanced concepts of CAD software- blocks, UCS, 3D-line, 3D object, DXF & DXB file formats. 3 Introduction In today‟s global competition, industries cannot survive unless they introduce new products or existing ones with:  Better quality  Lower cost  Shorter lead time • Computer aided design (CAD) can be defined as the use of computer systems to assist in creation, modification, analysis and optimization • Computer aided machining (CAM) can be defined as the use of computer systems to plan, manage and control a manufacturing plant through either direct or indirect computer interface with the plant‟s production resources.
  • 4.
    Product Cycle (Designand Manufacturing ) 4
  • 5.
    Product Cycle revisedwith CAD/CAM overlaid 5
  • 6.
    Need and Scopeof CAD Need  Reducing lead time  Creation of 3D Model  Quick Changes to market  Documentation  Make copy as many as possible  Manual Error Elimination Scope  Geometrical Modelling  Analysis  Review and Optimization  Automation Drafting 6
  • 7.
    The Design Process 7 TheApplication of computer for Design Conventional Design
  • 8.
    The Design Process– Shigley 8 Conventional Design
  • 9.
    The Design Process– Pahl and Beitz model 9
  • 10.
    The Design Process– Earl model 10
  • 11.
    The Design Process– Oshuga model 11
  • 12.
  • 13.
    Benefits of CAD Customer modifications are easier to make  Rapid response of the design analysis  Improved accuracy of design  Avoidance of subcontracting to meet schedules  Provide better functional analysis to reduce prototype testing  Avoidance of subcontracting to meet schedules  Assistance in preparation of documentation  Minimized transcription errors  Designs have more standardization  Fewer errors in NC part programming  Better communication interfaces and greater understanding among engineers, designers, drafters, management and different project groups. 13
  • 14.
    Hardware Requirements ofCAD CAD system would include the following hardware components  One or more workstations. These would consist of  A graphics terminal  Operator input devices  One or more plotters and other output devices  Central Processing unit (CPU)  Secondary storage 14 Configuration of CAD Workstation
  • 15.
    Computer Graphic display •The graphics display ( is considered an important component for viewing images, it enables the user to communicate with the displayed image by adding, deleting, blanking, and moving graphics entities on the display screen. • The following display devices are used: • Refresh Cathode Ray Tube • Random Scan and Raster Scan • Color CRT Monitors • Direct View Storage Tubes • Flat Panel Display • Lookup Table 15 Digital information Electrical Signal Visible image
  • 16.
    Block Diagram ofdisplay processor Display controller Display Generator Display console 16 Display file memory
  • 17.
    Random Scan Display •Random Scan System uses an electron beam which operates like a pencil to create a line image on the CRT screen. • The picture is constructed out of a sequence of straight line segments Each line segment is drawn on the screen by directing the beam to move from one point on the screen to the next, where its x & y coordinates define each 17
  • 18.
    Raster Scan Display •A Raster Scan Display is based on intensity control of pixels in the form of a rectangular box called Raster on the screen. • Where Pixel abbreviated as Picture Element, is a single point in a graphic image Graphics monitors display pictures by dividing the display screen into thousands (or millions) of pixels, arranged in rows and columns. • Pixels are combined to form a complete image, video, text or any visible thing on a computer display 18
  • 19.
    Raster Scan Display •Information of on and off pixels is stored in refresh buffer or Frame buffer. • Televisions in our house are based on Raster Scan Method • The raster scan system can store information of each pixel position, so it is suitable for realistic display of objects. • Raster Scan provides a refresh rate of 60 to 80 frames per second 19
  • 20.
    Image generation incomputer graphics • Cathode Ray Tube 20 Cathode Ray Tube Techniques  Stroke writing (line drawing, random position, vector writing and directed beam )  Raster scan (digital TV and scan graphics)
  • 21.
    Stroke writing vsRaster scan Stroke writing 21 Raster scan x2,y2 x1,y1 x3,y3 x5,y5 x4,y4 x6,y6 number of pixels in the raster display might be range from 256 X 256 (a total of 65,000 points) to 1024 X 1024 (a total of 10,00,000 points) •
  • 22.
    Output Primitives • Processof representing continuous graphics object as a collection of discrete pixels is called as Scan conversion. • Convert each primitive form into a set of pixels in image space is referred to as scan conversion (or) rasterization. • Condition • User can edit graphics object with keyboard, mouse or touch sensitive panel on screen • Objects should be independent of length & orientation. 22
  • 23.
  • 24.
  • 25.
  • 26.
  • 27.
  • 28.
  • 29.
  • 30.
  • 31.
  • 32.
  • 33.
  • 34.
  • 35.
  • 36.
    Graphics Standards  Theneed for portability of the geometric model among different hardware platforms has led to the development of device independent graphics  Simultaneously standards for exchange of drawing data base among software packages have been developed to facilitate integration of design and manufacturing operations  The heart of any CAD model is the component database.  This includes the graphics entities like points, lines, arcs etc. and coordinate points which define the location of these entities  This geometric data is used in all downstream applications of CAD, which include finite element modeling and analysis, process planning, estimation, CNC programming, Robot programming, programming of CMM, MRP systems 36
  • 37.
    Graphics Standards …. Toachieve high level of integration between CAD, analysis and manufacturing operations, the database must contain:  Shapes of the components ( based on 3-D wire frame or solid model )  Bill of materials (BOM), of the assembly which the components are used.  Materials of the components The manufacturing, test and assembly procedures to carried out to produce a component so that it is capable of functioning as per requirements of design In designing data structure for CAD database the following factors to be considered:  The data must be neutral  The data structure must be user friendly  The data base must be portable 37
  • 38.
    Graphical Output The mainobjective of the Graphical Kernel System, GKS, is the production and manipulation of pictures (in a way that does not depend on the computer or graphical device being used). Such pictures vary from simple line graphs (to illustrate experimental results, for example), to engineering drawings, to integrated circuit layouts (using colour to differentiate between layers), to images representing medical data (from computerized tomographic (CT) scanners) or astronomical data (from telescopes) in grey scale or colour. Each of these various pictures must be described to GKS, so that they may be drawn In GKS, pictures are considered to be constructed from a number of basic building blocks. These basic building blocks, or primitives as they are called, are of a number of types each of which can be used to describe a different component of a picture. The five main primitives in GKS are:. • polyline: which draws a sequence of connected line segments. • polymarker: which marks a sequence of points with the same symbol. • fill area: which displays a specified area. • text: which draws a string of characters. • cell array: which displays an image composed of a variety of colours or grey scales. 38
  • 39.
    Exchange of databetween CAD packages  To transfer geometric data from one software to another e.g. to carry out modeling in PRO/E and analysis in ANSYS  One method to meet this need is to use translators. This means developer will have to produce its own translators  A solution to translators is to use neutral files  The neutral files have standard formats and software packages can have preprocessors to convert the file data to neutral file and post processors to convert neutral file data to drawing file 39
  • 40.
    DATAEXCHANGE  The needfor exchanging modeling data is directly motivated by the need to integrate and automate the design and mfg. processes to obtain max. benefits from CAD/CAM.  The component database can be used in downstream applications like FEA, Process planning, Robot programming, MRP, C. N. C. programming.  There should be tie between the two or more systems to form an application that shares common data.  Data exchange files are neutral files. Following are two types of neutral files:  DXF (Data Exchange File)  IGES file (Initial Graphics Exchange Specification ) 40
  • 41.
    DXF (Data ExchangeFile)  DXF files are std. ASCII text files, which can be easily translated to the formats of other CAD systems  The DXF facility is available in several drafting packages.  In case of Auto CAD , the data regarding the created drawing may require to view , modify or plotting. Also data can be used for analysis purpose like FEA  In case of Auto CAD , a drawing interchange file (DXF) can be generated from the existing drawing by means of DXFOUT command.  On the other hand a drawing interchange file can be converted into Auto CAD drawing by means of DXFIN command  The general structure of DXF file is as follows: HEADER Section : general information of drawing TABLE Section : Linetype (LTYPE) table Layer table Text style (STYLE) table User coordinate system (UCS) table View port configuration file (VPORT) table BLOCKS Section ENTITIES Section END OF FILE 41
  • 42.
    IGES (Initial GraphicsExchange Specification )  It is standard exchange format developed for communicating product data among dissimilar CAD/CAM systems.  It has been used for two purposes: – Transfer of data within dissimilar system – Digital communication between company and its suppliers, customers i.e. IGES enable data transfer from one CAD system to another  The software which translates data from CAD system to IGES is known as preprocessor  The software which translates data from IGES data to a CAD system is known as postprocessor td. ASCII text files, which can be easily translated to the formats of other CAD systems 42
  • 43.
    IGES (Initial GraphicsExchange Specification )  IGES defines a database, in the form of a file format, which describes an “IGES Model” of modeling data of a given product  IGES model can be read and interpreted by dissimilar CAD/CAM systems. IGES model based on the concept of entities.  The fundamental unit of information of model i.e. IGES file, is the entity, all product definition data are expressed as a list of predefined entities.  Each entity defined by IGES is assigned a specific entity type number to refer to it in the IGES file.  Entities are categorized as geometric and non geometric. Geometric entities represent the definition of the product shape and include curves and surfaces.  Non geometric entities provide views and drawings of the model to enrich its representation and include annotation and structural entities.  Annotation entities include types of dimensions (linear, angular) symbols, centerlines, cross hatching. • Structure entities include views, drawings, attributes (i.e. line and text fonts, colors, layers etc.), properties (e.g. mass), symbol (e.g. mechanical and electrical ) and macros (to define parametric parts) 43