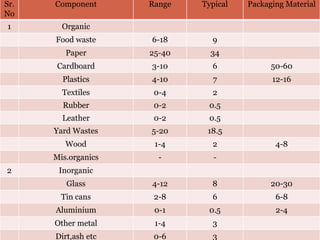
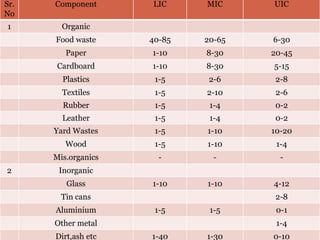
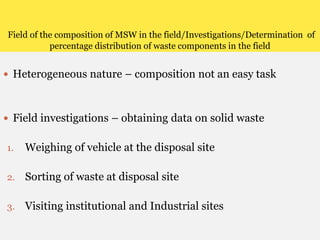
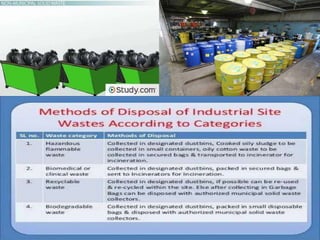
The document discusses the composition, types, and characteristics of municipal solid waste (MSW), emphasizing the importance of analysis for effective waste management planning. It provides insights into the sources of MSW, typical distribution of components, and methodologies for conducting field investigations and sampling. The analysis aims to identify material suitability for processing, recovery, and recycling while informing future management technologies.


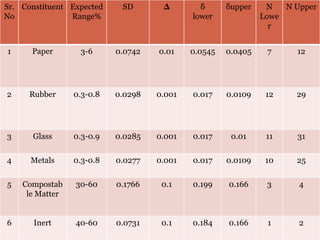
![Number of samples to be collected
To determine the number of samples required for
composition analysis following formula is used
N=(ZSδ)²
Where N=number of samples
Z= standard normal deviate for confidence level desired
(normally 95%)
S= estimated standard deviation ( transformed basis)
δ= sensitivity (transformed basis)
δ=[2arcsin √X- 2arcsin√X+-∆]](https://image.slidesharecdn.com/compositionofsolidwastemanagement2-200730125009/85/Composition-of-solid-waste-management-2-34-320.jpg)