Download to read offline
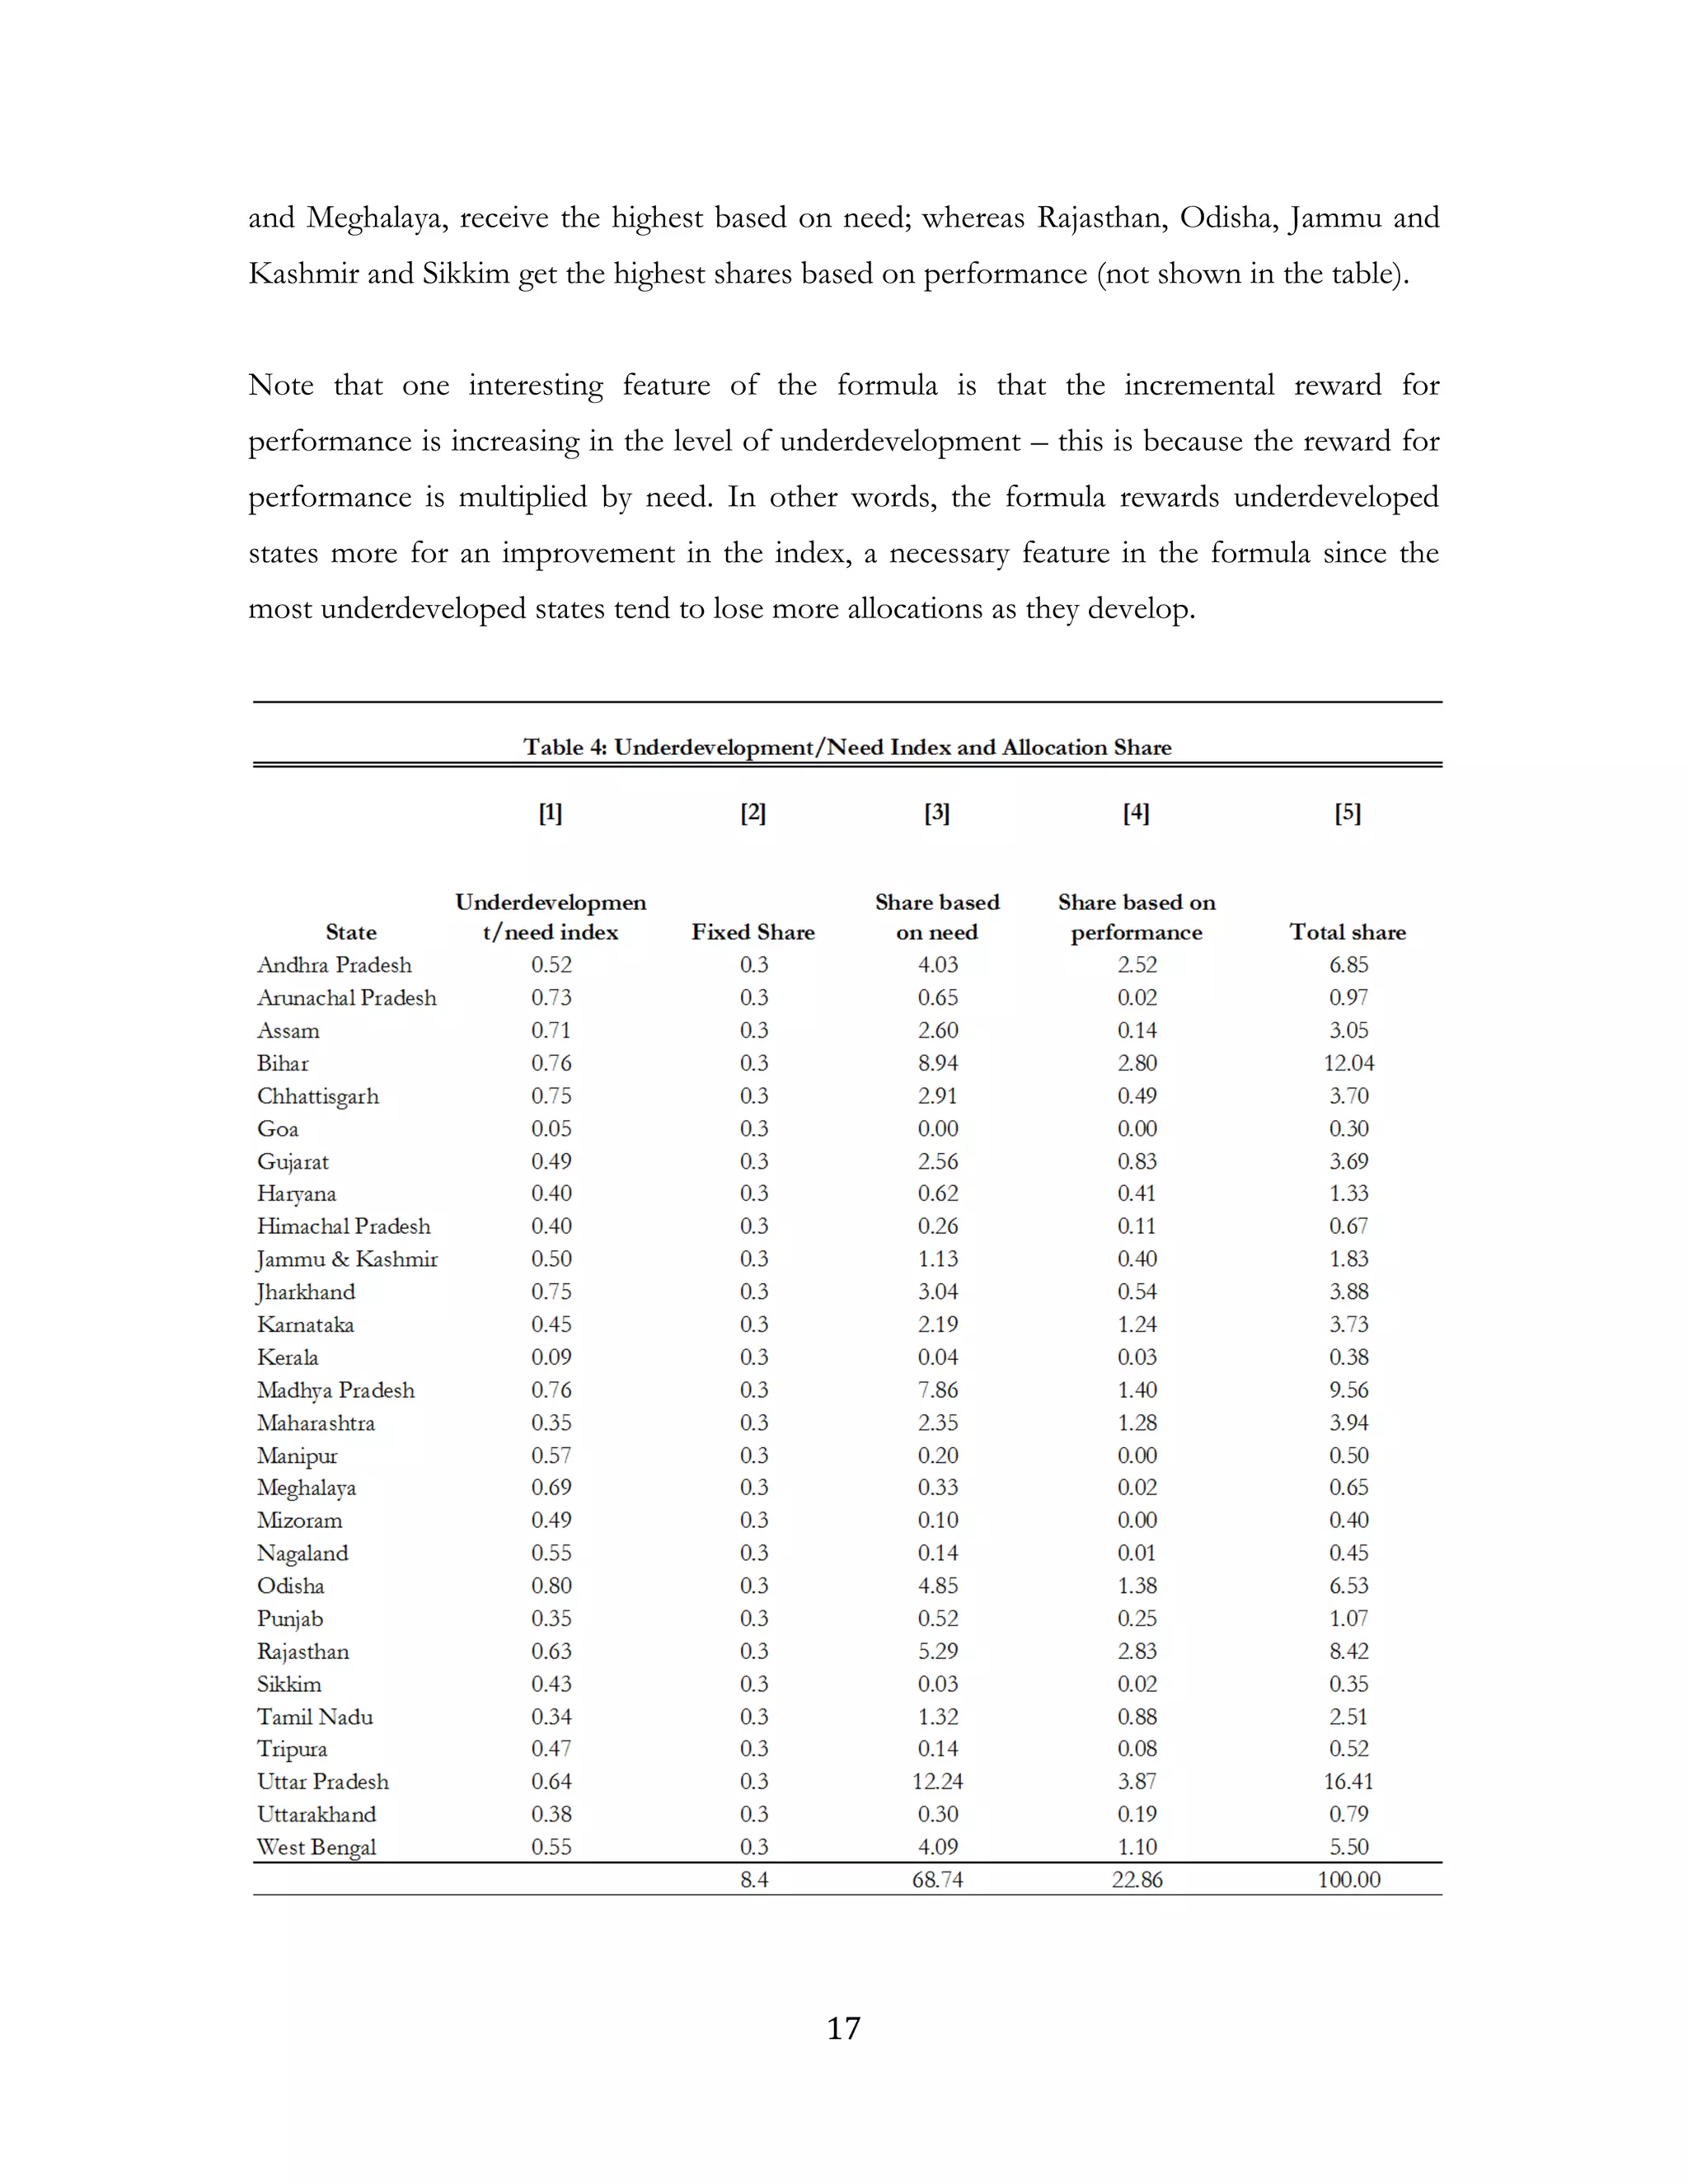
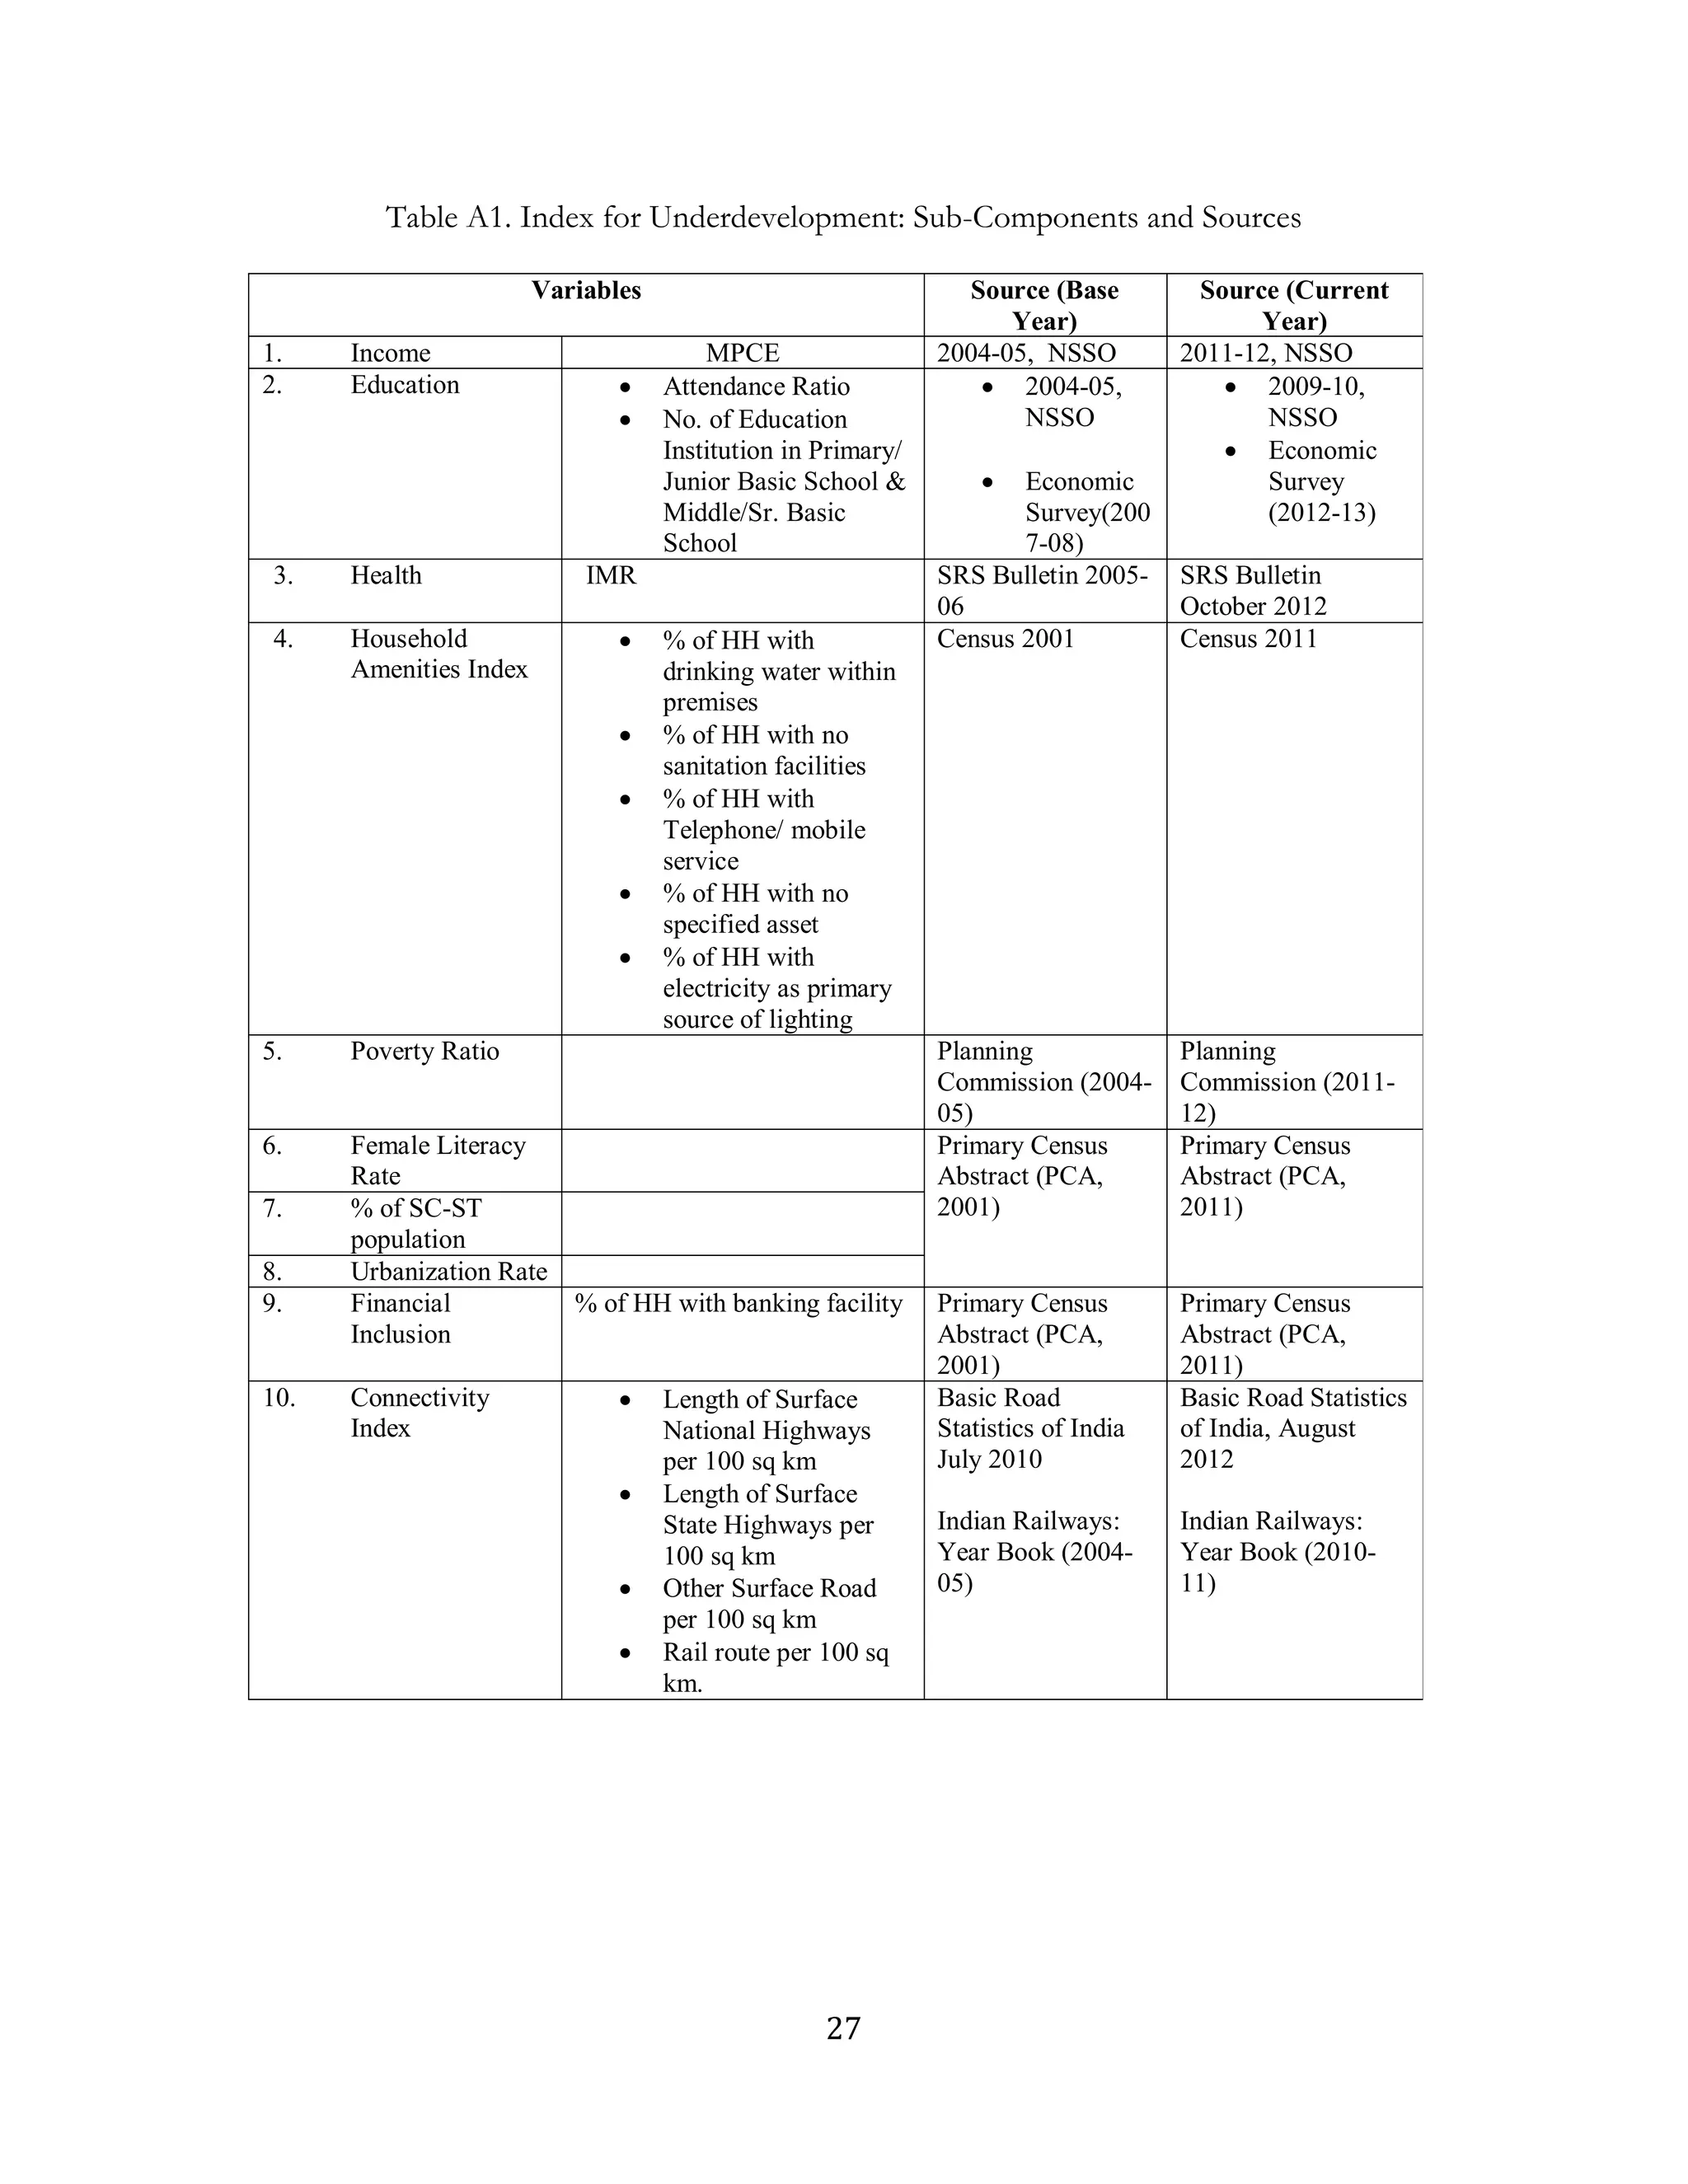
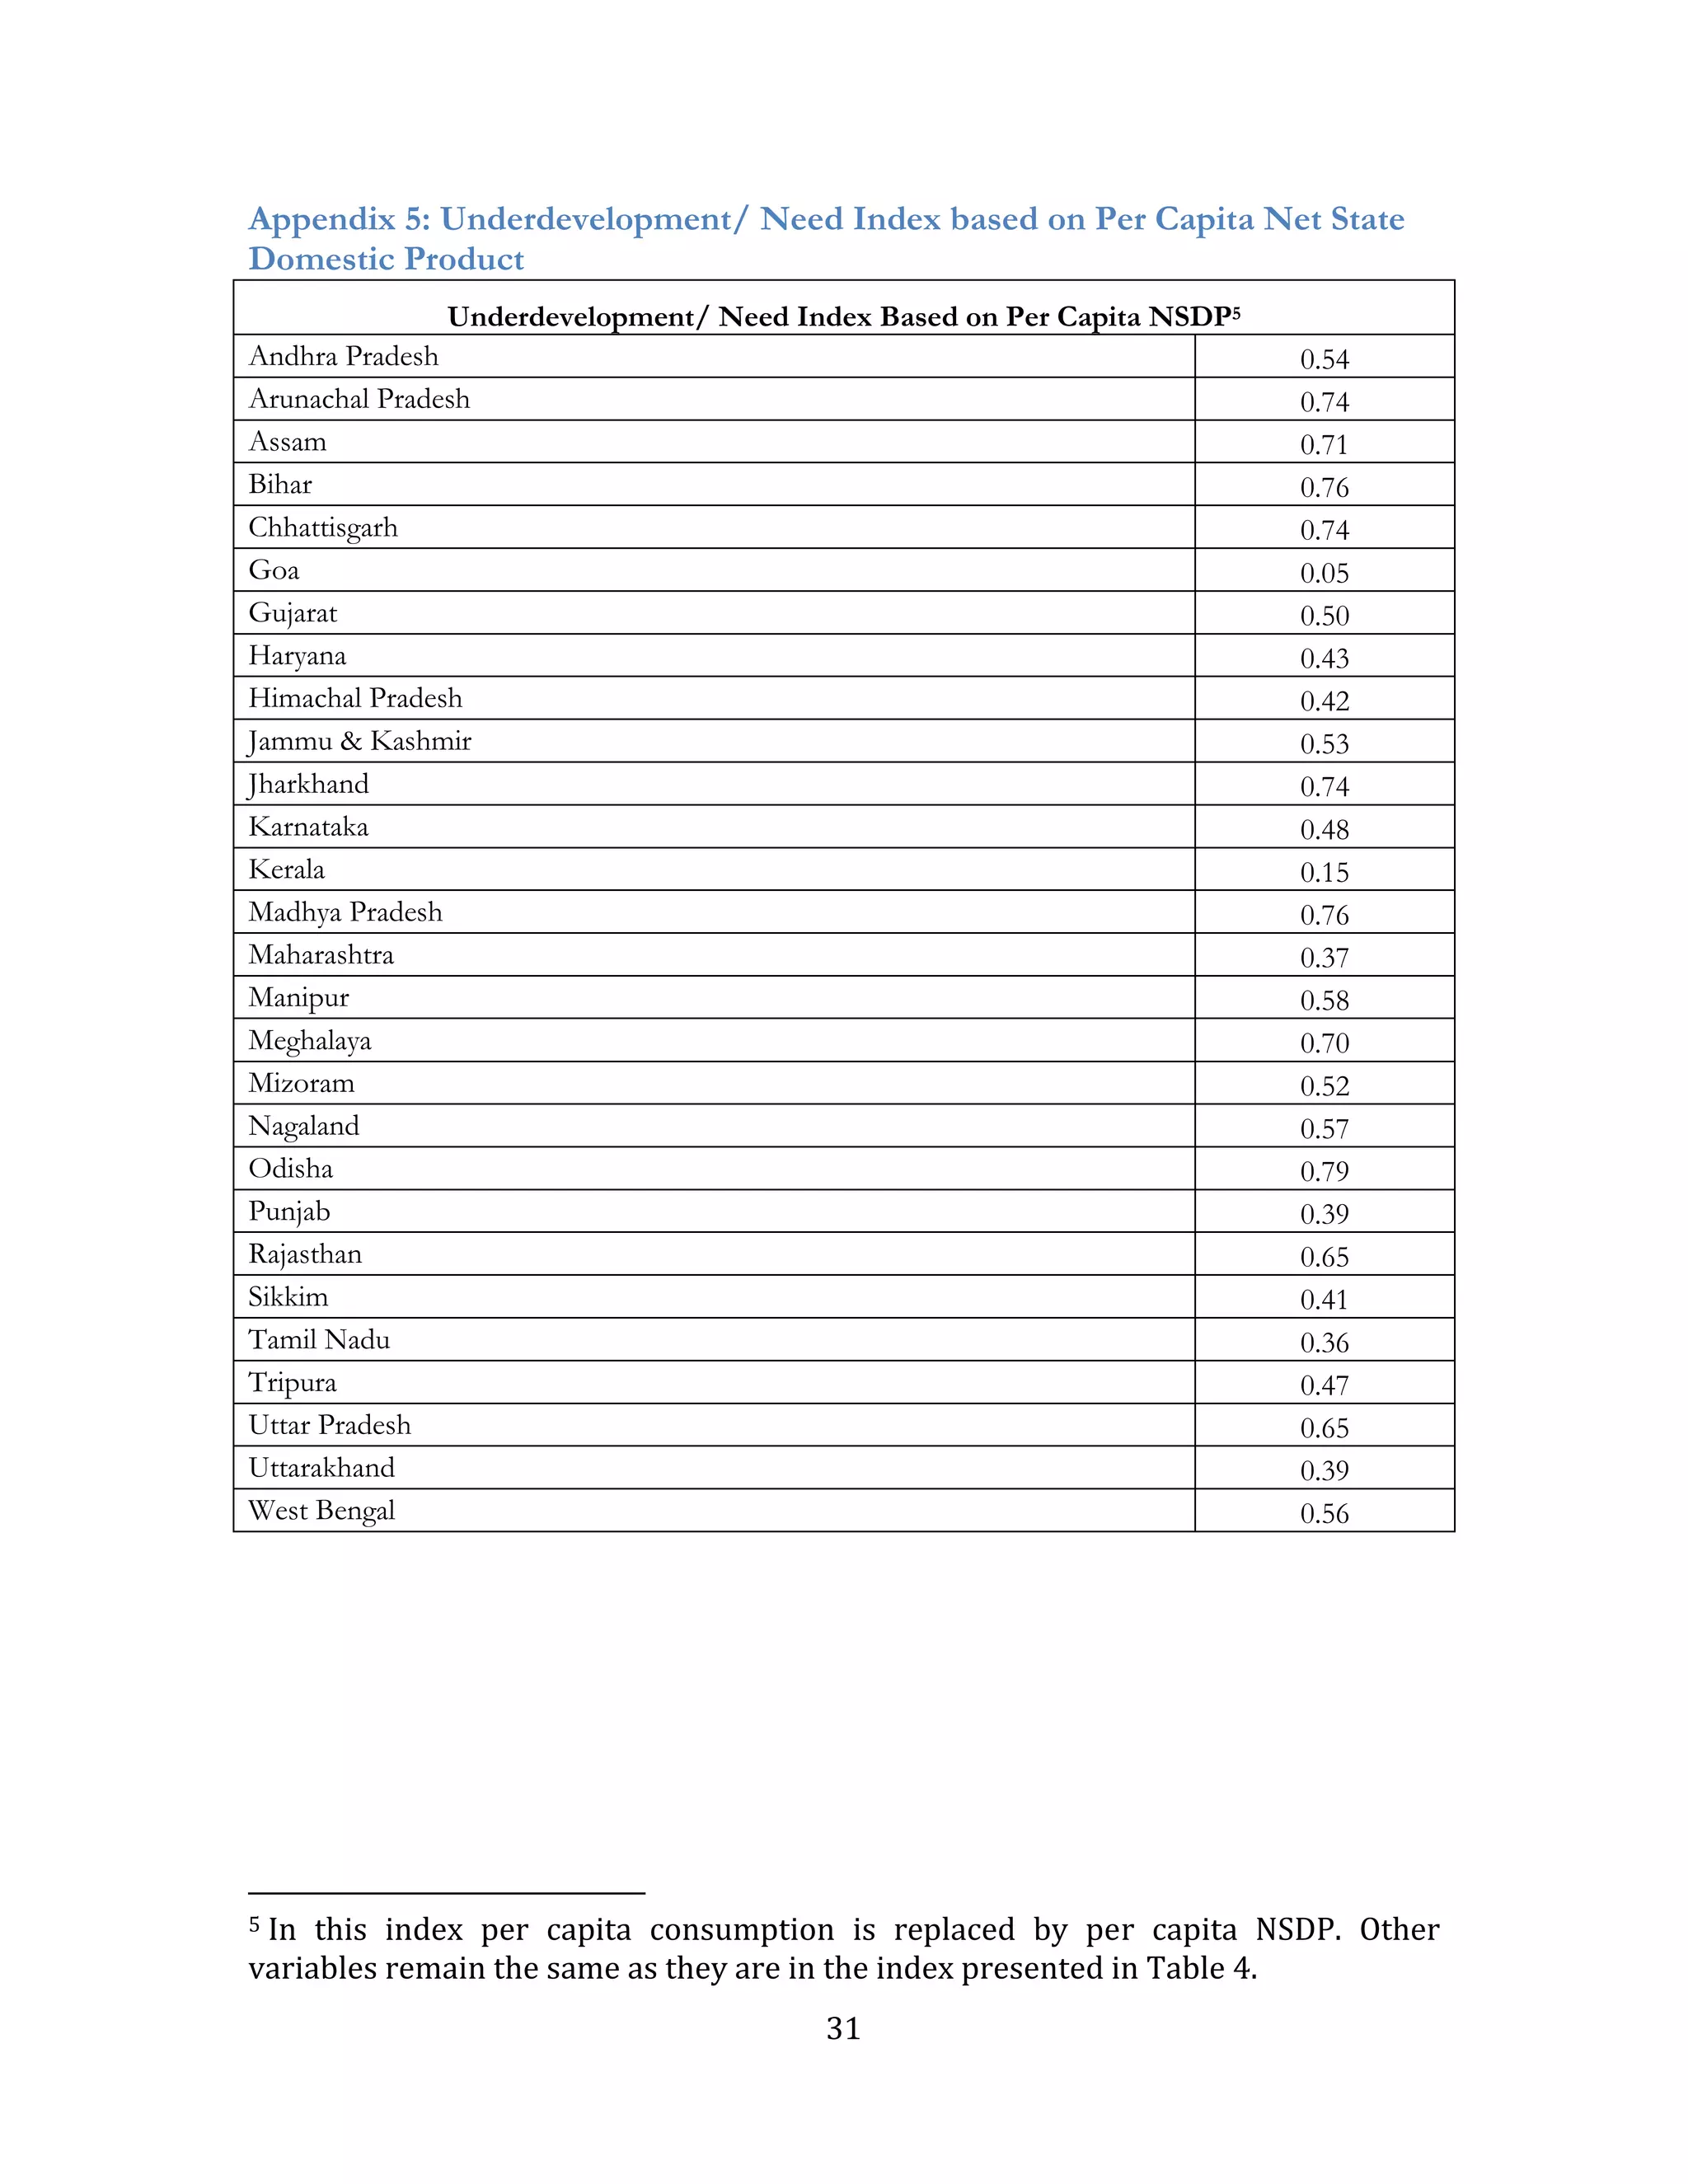
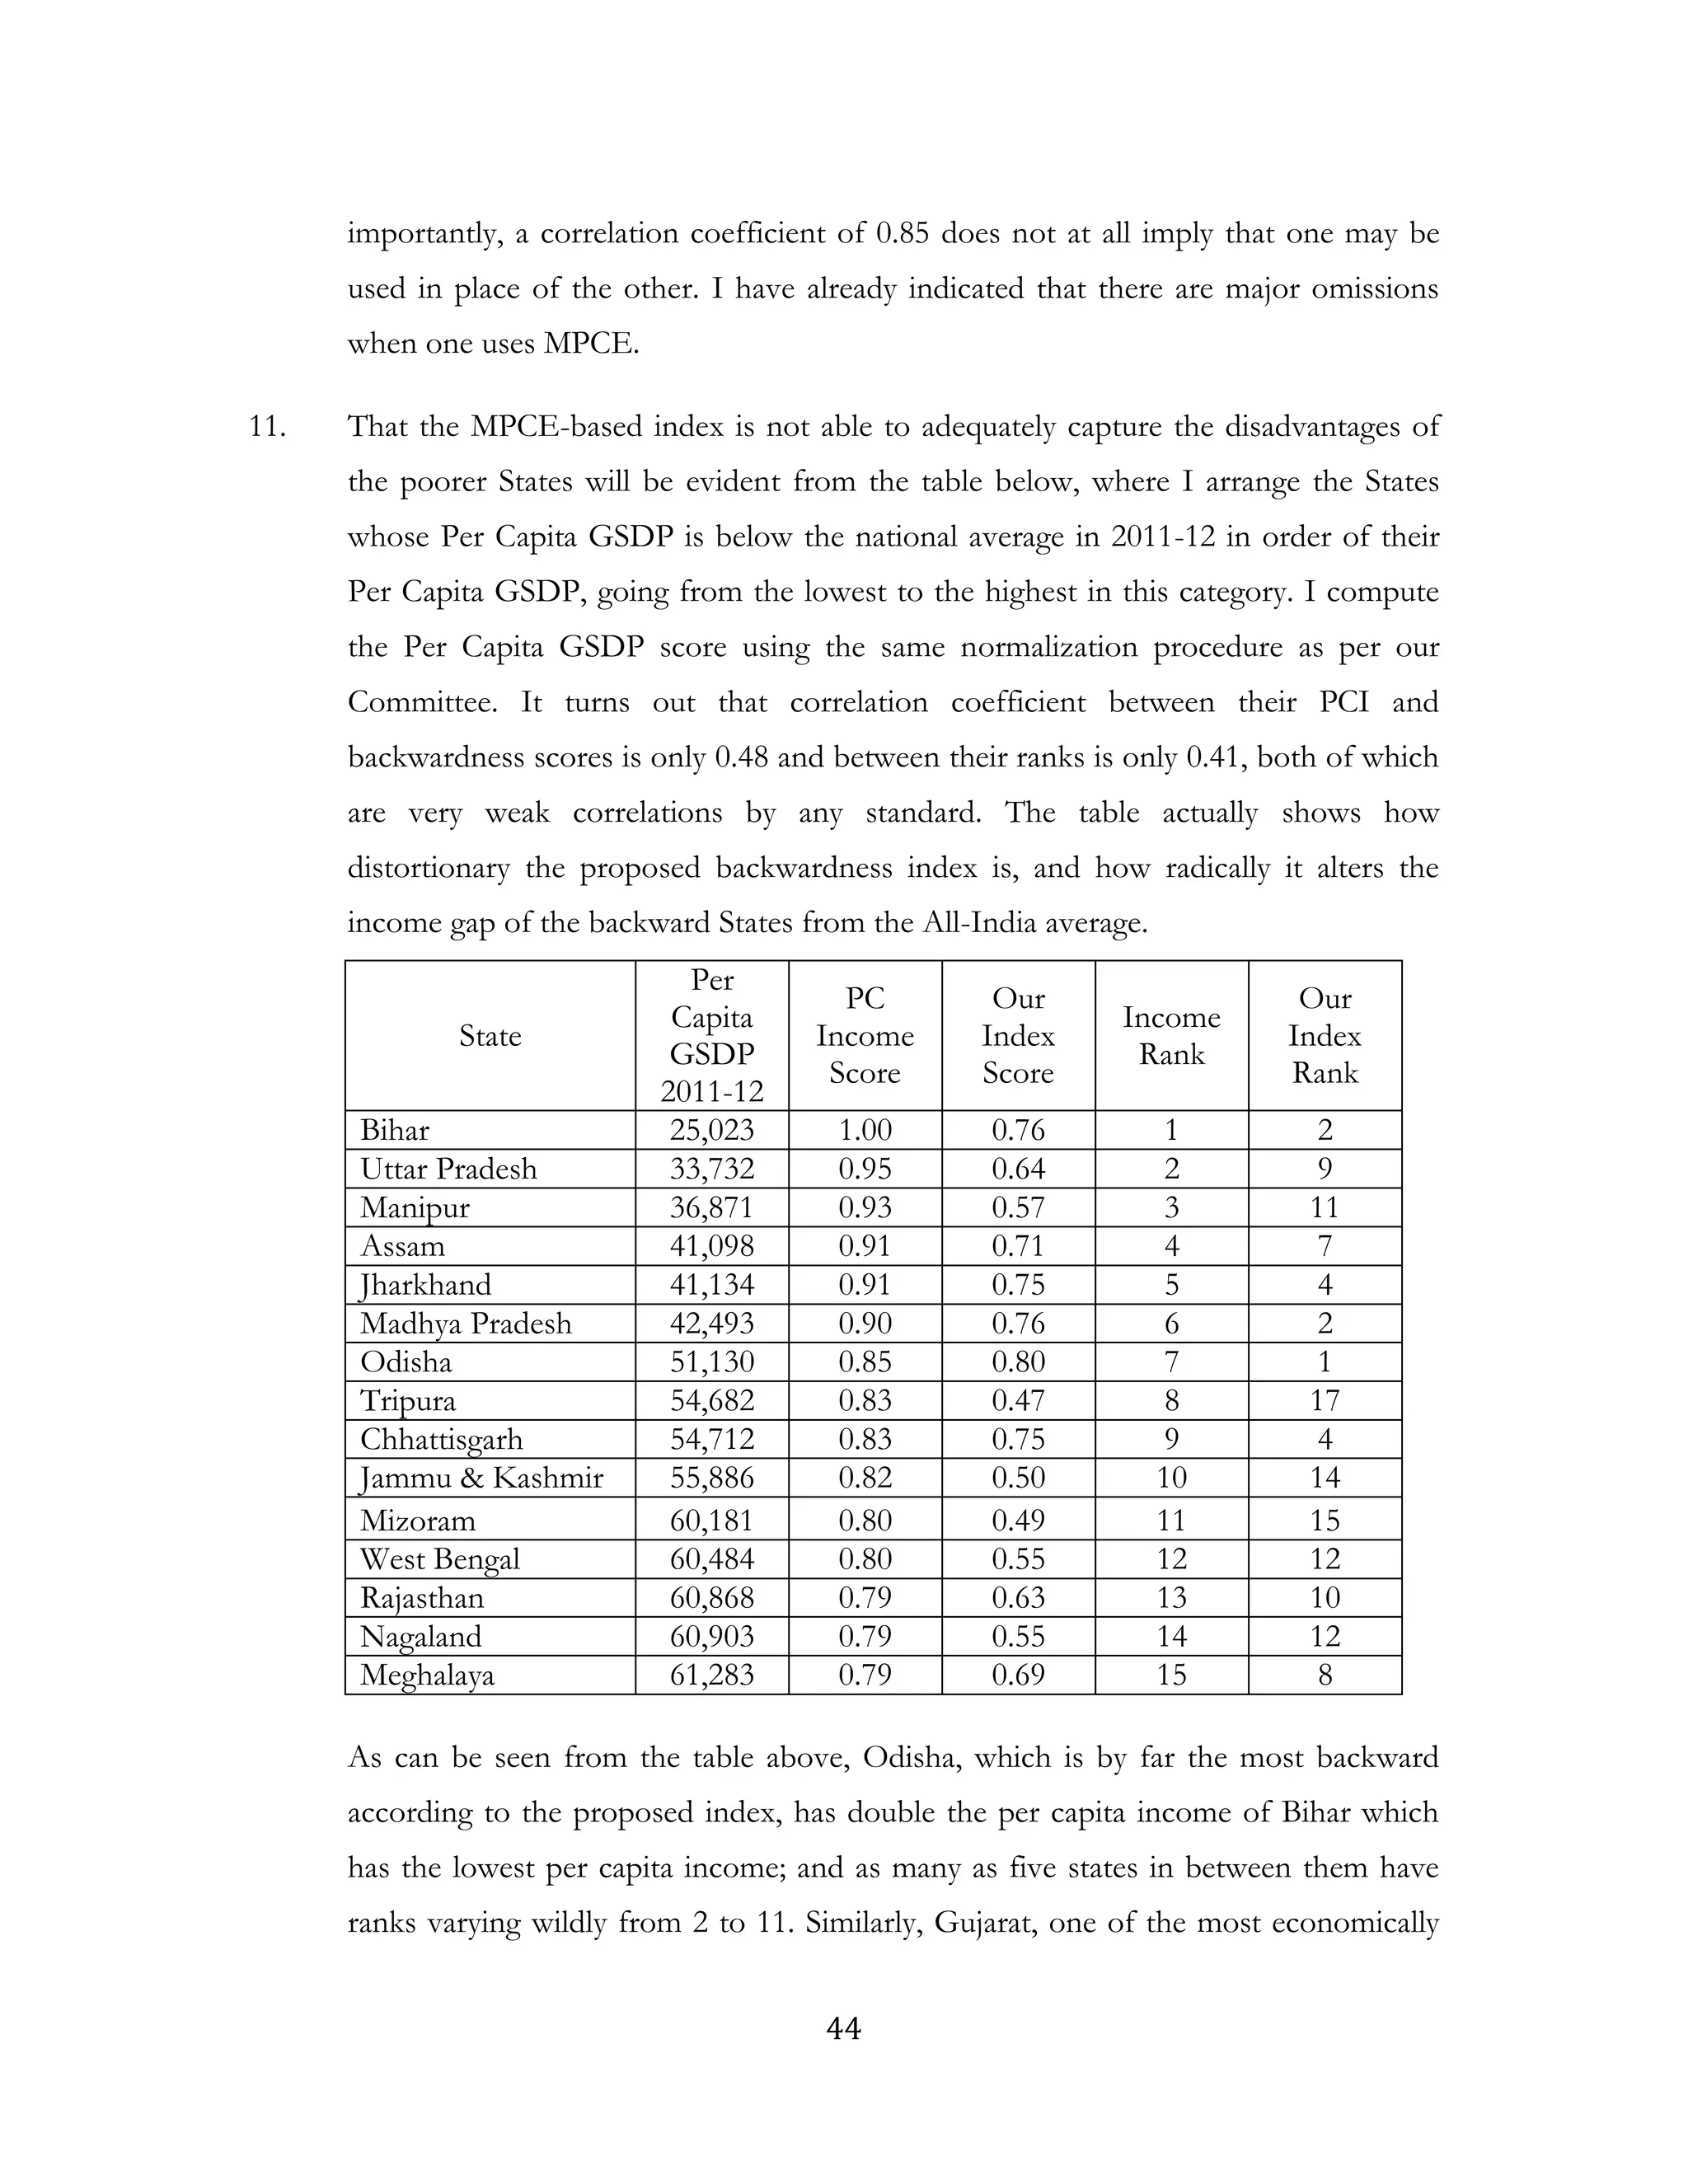
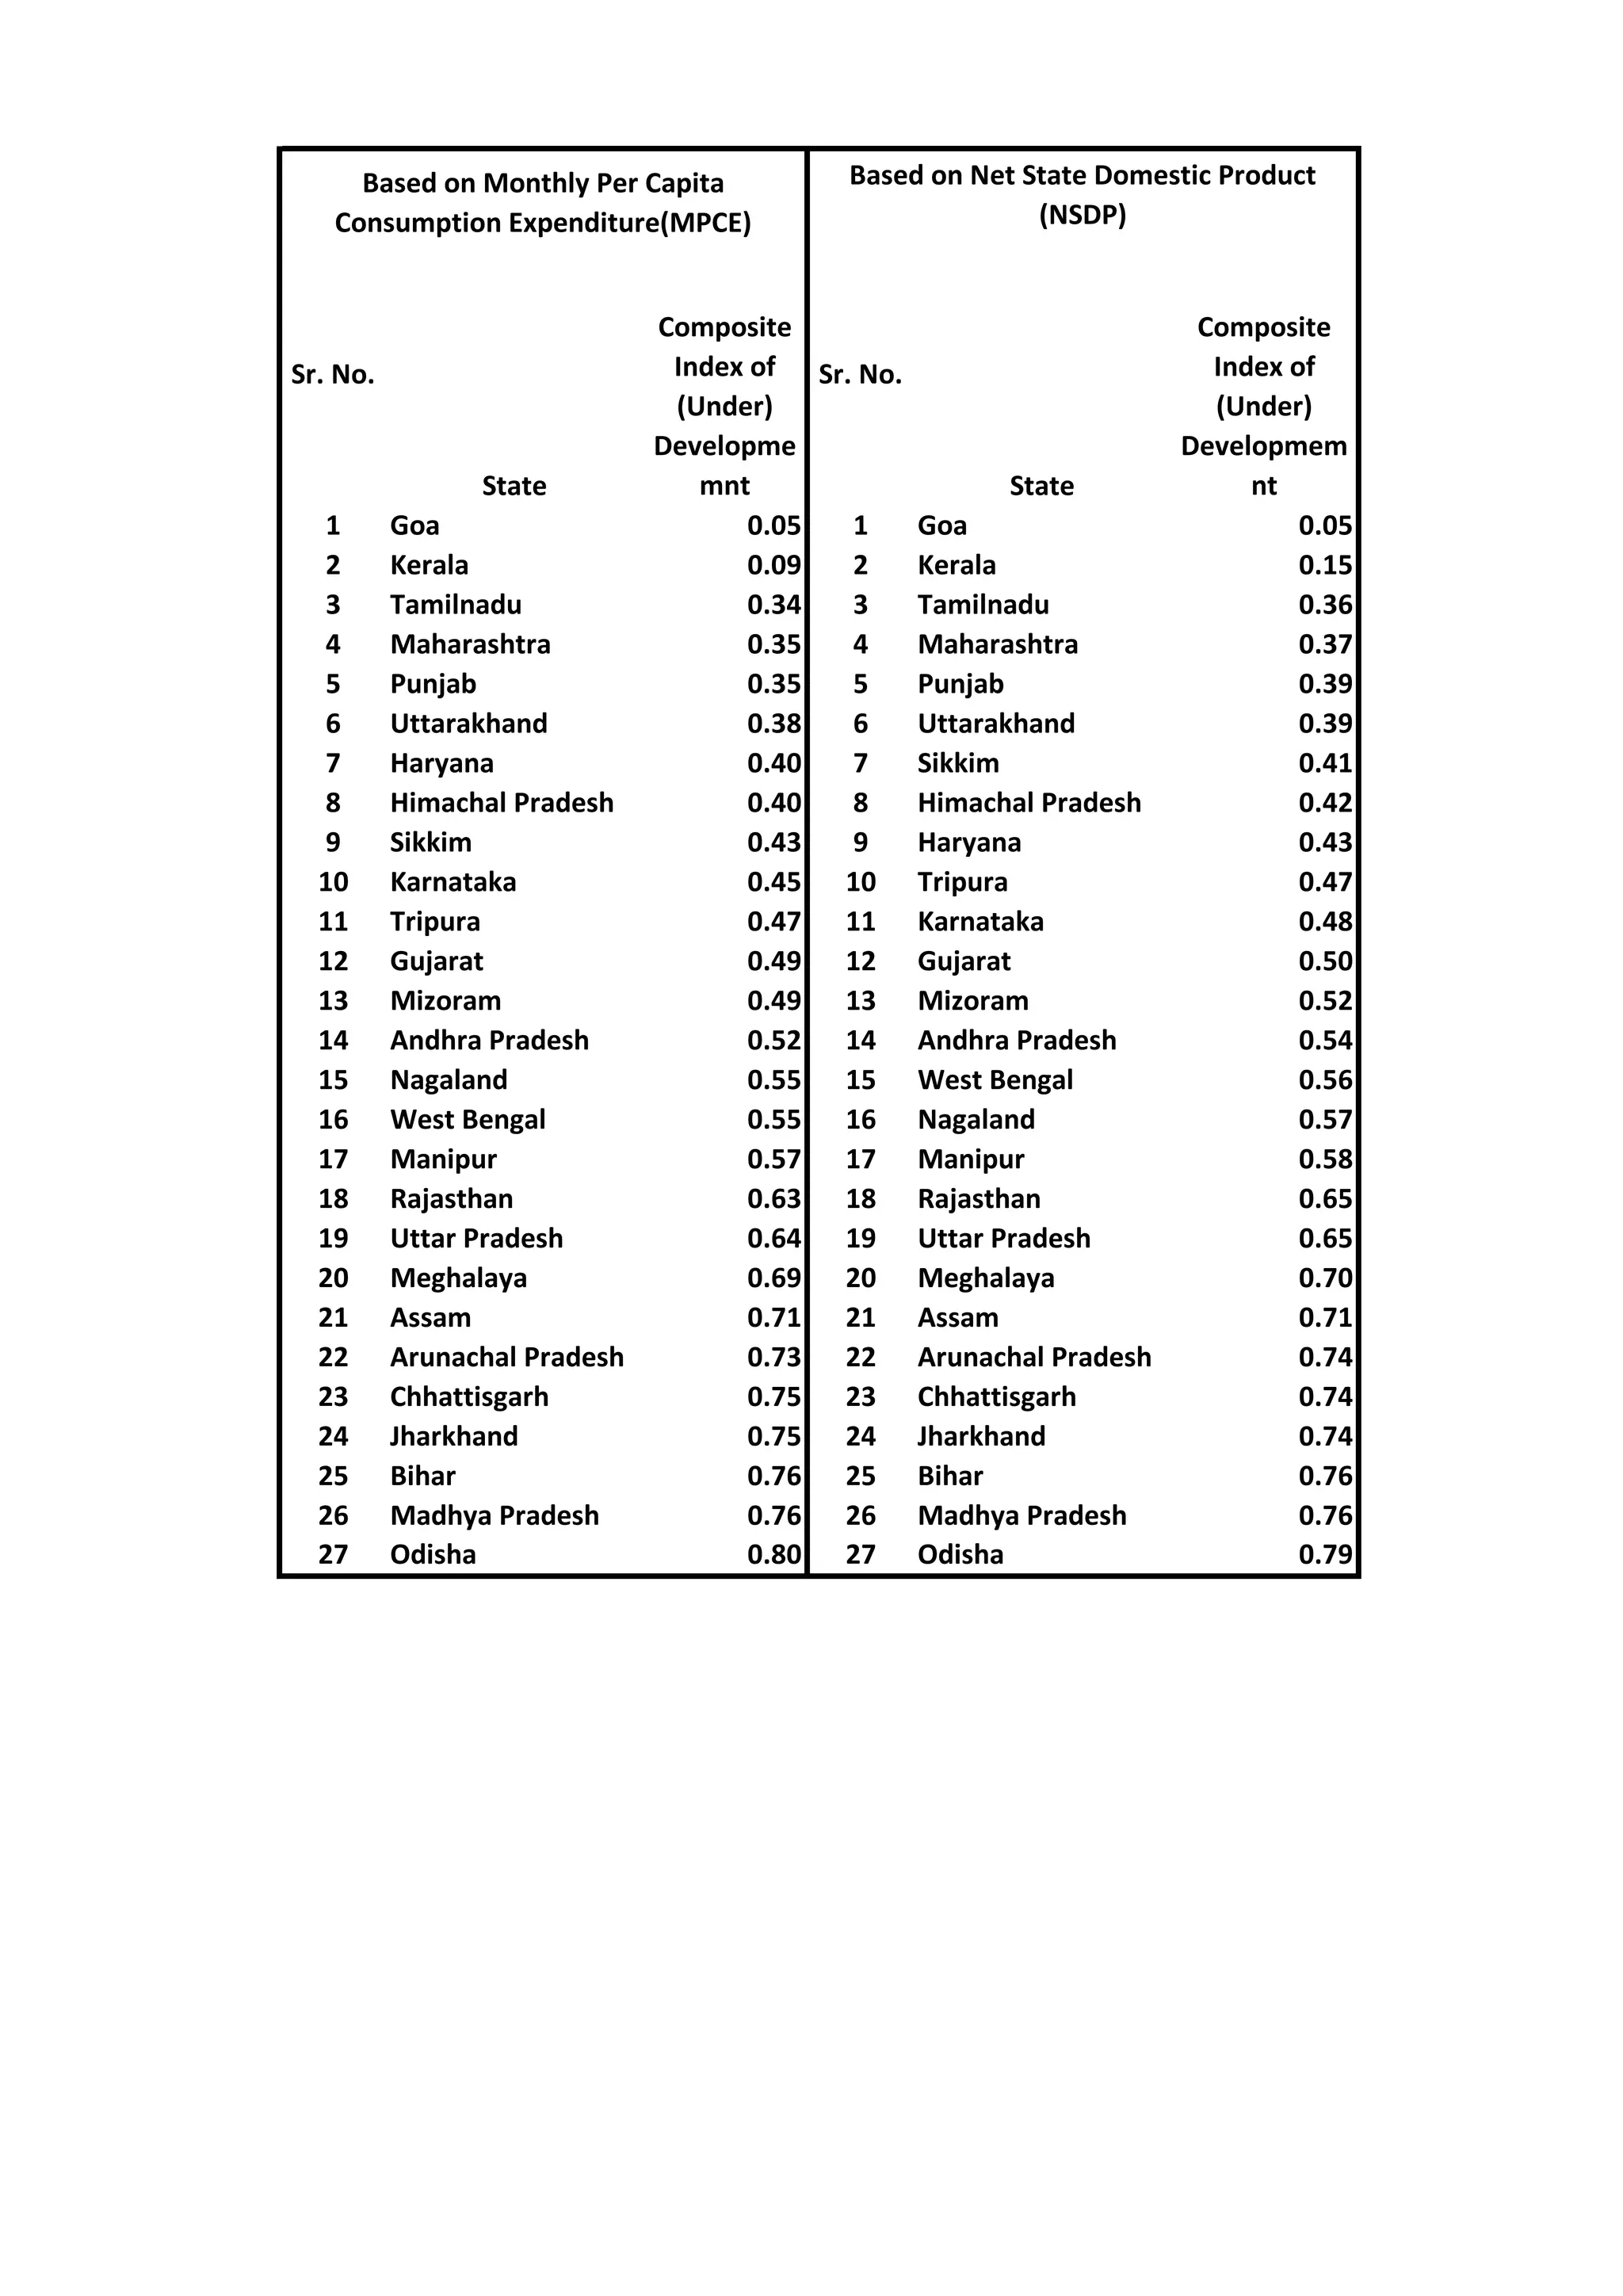

The document discusses a formula for allocating resources to Indian states based on their development needs and performance. It highlights that underdeveloped states receive greater rewards for improvement, emphasizing the issues with using monthly per capita consumption expenditure (mpce) versus net state domestic product (NSDP) for measuring development. The findings indicate significant disparities, questioning the effectiveness of the current index for resource allocation among states.


