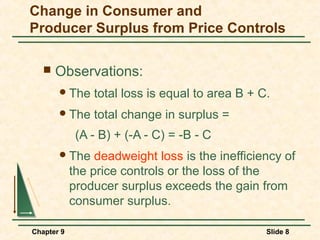
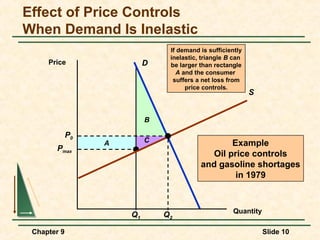
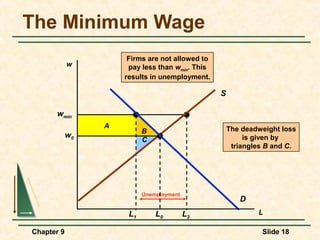
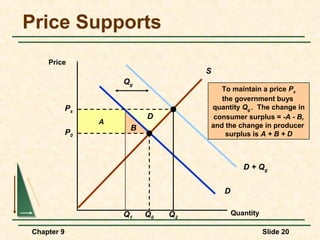
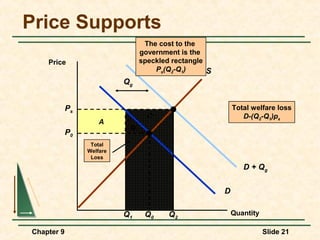
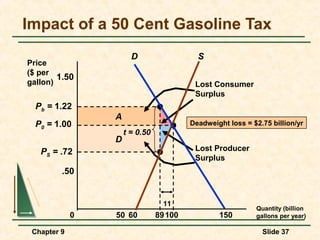
Chapter 9
The Analysis of
 Competitive
   Markets
Topics to be Discussed

      Evaluating the Gains and Losses from
       Government Policies--Consumer and
       Producer Surplus
      The Efficiency of a Competitive Market
      Minimum Prices


Chapter 9                              Slide 2
Topics to be Discussed

      Price Supports and Production Quotas
      The Impact of a Tax or Subsidy


Chapter 9                               Slide 3
Evaluating the Gains and Losses from
Government Policies--Consumer and Producer Surplus


       Review
         Consumer       surplus is the total benefit or
             value that consumers receive beyond what
             they pay for the good.
         Producer     surplus is the total benefit or
             revenue that producers receive beyond
             what it cost to produce a good.


 Chapter 9                                        Slide 4
Consumer and Producer Surplus

     Price

            10
                              Consumer
                              Surplus                     S

              7                                              Between 0 and Q0
                                                            consumers A and B
                                                          receive a net gain from
                                                            buying the product--
              5                                              consumer surplus


 Producer                                                       Between 0 and Q0
 Surplus                                                       producers receive
                                                                 a net gain from
                                                              selling each product--
                                                   D
                                                                producer surplus.

              0
                                      Q0               Quantity
            Consumer A   Consumer B   Consumer C
Evaluating the Gains and Losses from
Government Policies--Consumer and Producer Surplus


       To determine the welfare effect of a
        governmental policy we can measure
        the gain or loss in consumer and
        producer surplus.
       Welfare Effects
        Gains      and losses caused by government
             intervention in the market.

 Chapter 9                                    Slide 6
Change in Consumer and
Producer Surplus from Price Controls
                      Suppose the government
    Price            imposes a price ceiling Pmax
                        which is below the
                      market-clearing price P0.

                                                           S
                               Deadweight Loss
                                                               The gain to consumers is
                                                                the difference between
                                                                the rectangle A and the
                                                                       triangle B.
                           B

            P0
                 A      C
                                                                The loss to producers is
                                                                  the sum of rectangle
      Pmax                                                     A and triangle C. Triangle
                                                               B and C together measure
                                                                 the deadweight loss.
                                                       D

                      Q1           Q0        Q2

Chapter 9                                           Quantity              Slide 7
Change in Consumer and
Producer Surplus from Price Controls

      Observations:
        The    total loss is equal to area B + C.
        The    total change in surplus =
             (A - B) + (-A - C) = -B - C
        The     deadweight loss is the inefficiency of
            the price controls or the loss of the
            producer surplus exceeds the gain from
            consumer surplus.

Chapter 9                                        Slide 8
Change in Consumer and
Producer Surplus from Price Controls

      Observation
        Consumers        can experience a net loss in
            consumer surplus when the demand is
            sufficiently inelastic


Chapter 9                                        Slide 9
Effect of Price Controls
When Demand Is Inelastic
                                If demand is sufficiently
                                inelastic, triangle B can
     Price                 D    be larger than rectangle
                                  A and the consumer
                                 suffers a net loss from
                                     price controls.
                                                            S


                           B

             P0
                  A        C                      Example
       Pmax
                                             Oil price controls
                                          and gasoline shortages
                                                   in 1979


                                                     Quantity
                      Q1       Q2

 Chapter 9                                                      Slide 10
The Efficiency of
a Competitive Market

       When do competitive markets generate
        an inefficient allocation of resources or
        market failure?

        1) Externalities
                Costs or benefits that do not show up as
                 part of the market price (e.g. pollution)


 Chapter 9                                        Slide 11
The Efficiency of
a Competitive Market

       When do competitive markets generate
        an inefficient allocation of resources or
        market failure?

        2) Lack of Information
                Imperfect information prevents
                 consumers from making utility-
                 maximizing decisions.


 Chapter 9                                        Slide 12
The Efficiency of
a Competitive Market

       Government intervention in these
        markets can increase efficiency.
       Government intervention without a
        market failure creates inefficiency or
        deadweight loss.


 Chapter 9                                Slide 13
Welfare Loss When Price
Is Held Below Market-Clearing Level

     Price


                                               S


                                             When price is
                           B               regulated to be no
                                           higher than P1, the
             P0                        deadweight loss given by
                  A    C
                                       triangles B and C results.
             P1


                                        D

                      Q1       Q0

 Chapter 9                          Quantity         Slide 14
Welfare Loss When Price
Is Held Above Market-Clearing Level
                            When price is
     Price                regulated to be no
                        lower than P2 only Q3
                       will be demanded. The
                          deadweight loss is
                                 given                      S
                         by triangles B and C

             P2
                  A        B

             P0                                          What would the deadweight
                       C
                                                             loss be if QS = Q2?


                                                     D

                      Q3         Q0             Q2

 Chapter 9                                      Quantity            Slide 15
Minimum Prices

      Periodically government policy seeks to
       raise prices above market-clearing
       levels.
      We will investigate this by looking at a
       price floor and the minimum wage.


Chapter 9                                Slide 16
Price Minimum
                     If producers produce
    Price            Q2, the amount Q2 - Q3
                         will go unsold.
                                              S

                                                  The change in producer
      Pmin                                            surplus will be
                                                   A - C - D. Producers
                 A                                  may be worse off.
                          B
            P0
                          C


                                   D


                                                    D
                     Q3       Q0       Q2                 Quantity

Chapter 9                                                 Slide 17
The Minimum Wage
                      Firms are not allowed to
            w         pay less than wmin. This
                     results in unemployment.

                                                 S

      wmin
                 A                                   The deadweight loss
                           B
            w0                                            is given by
                           C
                                                      triangles B and C.


                           Unemployment
                                                        D
                      L1       L0         L2                 L

Chapter 9                                                     Slide 18
Price Supports and
Production Quotas

       Much of agricultural policy is based on
        a system of price supports.
        This     is support price is set above the
             equilibrium price and the government buys
             the surplus.

       This is often combined with incentives
        to reduce or restrict production

 Chapter 9                                    Slide 19
Price Supports
    Price
                                    S
                     Qg
                                           To maintain a price Ps
                                           the government buys
            Ps                          quantity Qg . The change in
                          D              consumer surplus = -A - B,
                 A
                      B                 and the change in producer
            P0                              surplus is A + B + D


                                                  D + Qg


                                           D

                     Q1   Q0   Q2              Quantity

Chapter 9                                                 Slide 20
Price Supports
                                 The cost to the
                                government is the
    Price                       speckled rectangle
                                    Ps(Q2-Q1)      S
                           Qg


            Ps                                             Total welfare loss
                                  D                           D-(Q2-Q1)ps
                     A
                            B
            P0
                  Total
                 Welfare
                  Loss
                                                              D + Qg


                                                       D

                           Q1    Q0     Q2                 Quantity

Chapter 9                                                             Slide 21
Price Supports

      Question:
        Is    there a more efficient way to increase
            farmer’s income by A + B + D?


Chapter 9                                       Slide 22
The Impact of a Tax or Subsidy

       The burden of a tax (or the benefit of a
        subsidy) falls partly on the consumer
        and partly on the producer.
       We will consider a specific tax which is
        a tax of a certain amount of money per
        unit sold.


 Chapter 9                                Slide 23
Incidence of a SpecificTax
                         Pb is the price (including
     Price               the tax) paid by buyers.
                      PS is the price sellers receive,
                       net of the tax. The burden
                         of the tax is split evenly.
                                                          S


             Pb                                             Buyers lose A + B, and
                  A                                         sellers lose D + C, and
                                 B
             P0                                          the government earns A + D
                        t        C                       in revenue. The deadweight
                  D
                                                                 loss is B + C.
             PS


                                                            D

                            Q1       Q0              Quantity

 Chapter 9                                                           Slide 24
Incidence of a Specific Tax

       Four conditions that must be satisfied
        after the tax is in place:

        1) Quantity sold and Pb must be on the
           demand line: QD = QD(Pb)

        2) Quantity sold and PS must be on the
           supply line: QS = QS(PS)

 Chapter 9                               Slide 25
Incidence of a Specific Tax

       Four conditions that must be satisfied
        after the tax is in place:

        3) QD = QS

        4) Pb - PS = tax


 Chapter 9                               Slide 26
Impact of a Tax Depends
        on Elasticities of Supply and Demand
           Burden on Buyer                Burden on Seller
Price            D                Price                   S

   Pb

                              S
             t                      Pb
   P0                               P0
   PS
                                              t
                                                                         D
                                    PS


                 Q1 Q0   Quantity                 Q1 Q0       Quantity
The Impact of a Tax or Subsidy

       Pass-through fraction
         ES/(ES -   Ed)
         For     example, when demand is perfectly
             inelastic (Ed = 0), the pass-through fraction
             is 1, and all the tax is borne by the
             consumer.


 Chapter 9                                        Slide 28
The Effects of a Tax or Subsidy

       A subsidy can be analyzed in much the
        same way as a tax.
       It can be treated as a negative tax.
       The seller’s price exceeds the buyer’s
        price.


 Chapter 9                                Slide 29
Subsidy
    Price


                               S

                                    Like a tax, the benefit
            PS                       of a subsidy is split
                                    between buyers and
            P0             s         sellers, depending
                                   upon the elasticities of
            Pb                      supply and demand.


                                   D


                 Q0   Q1       Quantity

Chapter 9                                    Slide 30
Subsidy

      With a subsidy (s), the selling price Pb is
       below the subsidized price PS so that:
       s   = PS - Pb


Chapter 9                                 Slide 31
Subsidy

      The benefit of the subsidy depends
       upon Ed /ES.
        If   the ratio is small, most of the benefit
            accrues to the consumer.
        If  the ratio is large, the producer benefits
            most.


Chapter 9                                        Slide 32
A Tax on Gasoline

      Measuring the Impact of a 50 Cent
       Gasoline Tax
        Intermediate-run     EP of demand = -0.5
             QD = 150 - 50P
        EP   of supply = 0.4
             QS = 60 + 40P
        QS =   QD at $1 and 100 billion gallons per
            year (bg/yr)
Chapter 9                                      Slide 33
A Tax on Gasoline

      With a 50 cent tax
        QD   = 150 - 50Pb = 60 + 40PS = QS
        150    - 50(PS+ .50) = 60 + 40PS
        PS =   .72
        Pb   = .5 + PS
        Pb   = $1.22


Chapter 9                                     Slide 34
A Tax on Gasoline

      With a 50 cent tax
       Q   = 150 -(50)(1.22) = 89 bg/yr
       Q   falls by 11%


Chapter 9                                  Slide 35
Impact of a 50 Cent Gasoline Tax
                       D                 S
Price
($ per
        1.50
gallon)                                  Lost Consumer
                                         Surplus
  Pb = 1.22                                        The annual revenue
                                                  from the tax is .50(89)
                 A                              or $44.5 billion. The buyer
  P0 = 1.00                                    pays 22 cents of the tax, and
                     t = 0.50                  the producer pays 28 cents.
                 D
   PS = .72                              Lost Producer
                                         Surplus
         .50


                                  11
                                                           Quantity (billion
             0   50 60          89 100        150          gallons per year)

 Chapter 9                                                   Slide 36
Impact of a 50 Cent Gasoline Tax
                       D                   S
Price
($ per
        1.50
gallon)                                   Lost Consumer
                                          Surplus
  Pb = 1.22
                 A
  P0 = 1.00                              Deadweight loss = $2.75 billion/yr
                     t = 0.50
                 D
   PS = .72                               Lost Producer
                                          Surplus
         .50


                                  11
                                                            Quantity (billion
             0   50 60          89 100           150        gallons per year)

 Chapter 9                                                    Slide 37
Summary

      Simple models of supply and demand
       can be used to analyze a wide variety of
       government policies.
      In each case, consumer and producer
       surplus are used to evaluate the gains
       and losses to consumers and
       producers.


Chapter 9                              Slide 38
Summary

      When government imposes a tax or
       subsidy, price usually does not rise or
       fall by the full amount of the tax or
       subsidy.
      Government intervention generally
       leads to a deadweight loss.


Chapter 9                                Slide 39
Summary

      Government intervention in a
       competitive market is not always a bad
       thing.


Chapter 9                              Slide 40
End of Chapter 9
The Analysis of
 Competitive
   Markets

Competitive market

  • 1.
    Chapter 9 The Analysisof Competitive Markets
  • 2.
    Topics to beDiscussed  Evaluating the Gains and Losses from Government Policies--Consumer and Producer Surplus  The Efficiency of a Competitive Market  Minimum Prices Chapter 9 Slide 2
  • 3.
    Topics to beDiscussed  Price Supports and Production Quotas  The Impact of a Tax or Subsidy Chapter 9 Slide 3
  • 4.
    Evaluating the Gainsand Losses from Government Policies--Consumer and Producer Surplus  Review  Consumer surplus is the total benefit or value that consumers receive beyond what they pay for the good.  Producer surplus is the total benefit or revenue that producers receive beyond what it cost to produce a good. Chapter 9 Slide 4
  • 5.
    Consumer and ProducerSurplus Price 10 Consumer Surplus S 7 Between 0 and Q0 consumers A and B receive a net gain from buying the product-- 5 consumer surplus Producer Between 0 and Q0 Surplus producers receive a net gain from selling each product-- D producer surplus. 0 Q0 Quantity Consumer A Consumer B Consumer C
  • 6.
    Evaluating the Gainsand Losses from Government Policies--Consumer and Producer Surplus  To determine the welfare effect of a governmental policy we can measure the gain or loss in consumer and producer surplus.  Welfare Effects Gains and losses caused by government intervention in the market. Chapter 9 Slide 6
  • 7.
    Change in Consumerand Producer Surplus from Price Controls Suppose the government Price imposes a price ceiling Pmax which is below the market-clearing price P0. S Deadweight Loss The gain to consumers is the difference between the rectangle A and the triangle B. B P0 A C The loss to producers is the sum of rectangle Pmax A and triangle C. Triangle B and C together measure the deadweight loss. D Q1 Q0 Q2 Chapter 9 Quantity Slide 7
  • 8.
    Change in Consumerand Producer Surplus from Price Controls  Observations:  The total loss is equal to area B + C.  The total change in surplus = (A - B) + (-A - C) = -B - C  The deadweight loss is the inefficiency of the price controls or the loss of the producer surplus exceeds the gain from consumer surplus. Chapter 9 Slide 8
  • 9.
    Change in Consumerand Producer Surplus from Price Controls  Observation  Consumers can experience a net loss in consumer surplus when the demand is sufficiently inelastic Chapter 9 Slide 9
  • 10.
    Effect of PriceControls When Demand Is Inelastic If demand is sufficiently inelastic, triangle B can Price D be larger than rectangle A and the consumer suffers a net loss from price controls. S B P0 A C Example Pmax Oil price controls and gasoline shortages in 1979 Quantity Q1 Q2 Chapter 9 Slide 10
  • 11.
    The Efficiency of aCompetitive Market  When do competitive markets generate an inefficient allocation of resources or market failure? 1) Externalities  Costs or benefits that do not show up as part of the market price (e.g. pollution) Chapter 9 Slide 11
  • 12.
    The Efficiency of aCompetitive Market  When do competitive markets generate an inefficient allocation of resources or market failure? 2) Lack of Information  Imperfect information prevents consumers from making utility- maximizing decisions. Chapter 9 Slide 12
  • 13.
    The Efficiency of aCompetitive Market  Government intervention in these markets can increase efficiency.  Government intervention without a market failure creates inefficiency or deadweight loss. Chapter 9 Slide 13
  • 14.
    Welfare Loss WhenPrice Is Held Below Market-Clearing Level Price S When price is B regulated to be no higher than P1, the P0 deadweight loss given by A C triangles B and C results. P1 D Q1 Q0 Chapter 9 Quantity Slide 14
  • 15.
    Welfare Loss WhenPrice Is Held Above Market-Clearing Level When price is Price regulated to be no lower than P2 only Q3 will be demanded. The deadweight loss is given S by triangles B and C P2 A B P0 What would the deadweight C loss be if QS = Q2? D Q3 Q0 Q2 Chapter 9 Quantity Slide 15
  • 16.
    Minimum Prices  Periodically government policy seeks to raise prices above market-clearing levels.  We will investigate this by looking at a price floor and the minimum wage. Chapter 9 Slide 16
  • 17.
    Price Minimum If producers produce Price Q2, the amount Q2 - Q3 will go unsold. S The change in producer Pmin surplus will be A - C - D. Producers A may be worse off. B P0 C D D Q3 Q0 Q2 Quantity Chapter 9 Slide 17
  • 18.
    The Minimum Wage Firms are not allowed to w pay less than wmin. This results in unemployment. S wmin A The deadweight loss B w0 is given by C triangles B and C. Unemployment D L1 L0 L2 L Chapter 9 Slide 18
  • 19.
    Price Supports and ProductionQuotas  Much of agricultural policy is based on a system of price supports. This is support price is set above the equilibrium price and the government buys the surplus.  This is often combined with incentives to reduce or restrict production Chapter 9 Slide 19
  • 20.
    Price Supports Price S Qg To maintain a price Ps the government buys Ps quantity Qg . The change in D consumer surplus = -A - B, A B and the change in producer P0 surplus is A + B + D D + Qg D Q1 Q0 Q2 Quantity Chapter 9 Slide 20
  • 21.
    Price Supports The cost to the government is the Price speckled rectangle Ps(Q2-Q1) S Qg Ps Total welfare loss D D-(Q2-Q1)ps A B P0 Total Welfare Loss D + Qg D Q1 Q0 Q2 Quantity Chapter 9 Slide 21
  • 22.
    Price Supports  Question:  Is there a more efficient way to increase farmer’s income by A + B + D? Chapter 9 Slide 22
  • 23.
    The Impact ofa Tax or Subsidy  The burden of a tax (or the benefit of a subsidy) falls partly on the consumer and partly on the producer.  We will consider a specific tax which is a tax of a certain amount of money per unit sold. Chapter 9 Slide 23
  • 24.
    Incidence of aSpecificTax Pb is the price (including Price the tax) paid by buyers. PS is the price sellers receive, net of the tax. The burden of the tax is split evenly. S Pb Buyers lose A + B, and A sellers lose D + C, and B P0 the government earns A + D t C in revenue. The deadweight D loss is B + C. PS D Q1 Q0 Quantity Chapter 9 Slide 24
  • 25.
    Incidence of aSpecific Tax  Four conditions that must be satisfied after the tax is in place: 1) Quantity sold and Pb must be on the demand line: QD = QD(Pb) 2) Quantity sold and PS must be on the supply line: QS = QS(PS) Chapter 9 Slide 25
  • 26.
    Incidence of aSpecific Tax  Four conditions that must be satisfied after the tax is in place: 3) QD = QS 4) Pb - PS = tax Chapter 9 Slide 26
  • 27.
    Impact of aTax Depends on Elasticities of Supply and Demand Burden on Buyer Burden on Seller Price D Price S Pb S t Pb P0 P0 PS t D PS Q1 Q0 Quantity Q1 Q0 Quantity
  • 28.
    The Impact ofa Tax or Subsidy  Pass-through fraction  ES/(ES - Ed)  For example, when demand is perfectly inelastic (Ed = 0), the pass-through fraction is 1, and all the tax is borne by the consumer. Chapter 9 Slide 28
  • 29.
    The Effects ofa Tax or Subsidy  A subsidy can be analyzed in much the same way as a tax.  It can be treated as a negative tax.  The seller’s price exceeds the buyer’s price. Chapter 9 Slide 29
  • 30.
    Subsidy Price S Like a tax, the benefit PS of a subsidy is split between buyers and P0 s sellers, depending upon the elasticities of Pb supply and demand. D Q0 Q1 Quantity Chapter 9 Slide 30
  • 31.
    Subsidy  With a subsidy (s), the selling price Pb is below the subsidized price PS so that: s = PS - Pb Chapter 9 Slide 31
  • 32.
    Subsidy  The benefit of the subsidy depends upon Ed /ES.  If the ratio is small, most of the benefit accrues to the consumer.  If the ratio is large, the producer benefits most. Chapter 9 Slide 32
  • 33.
    A Tax onGasoline  Measuring the Impact of a 50 Cent Gasoline Tax  Intermediate-run EP of demand = -0.5 QD = 150 - 50P  EP of supply = 0.4 QS = 60 + 40P  QS = QD at $1 and 100 billion gallons per year (bg/yr) Chapter 9 Slide 33
  • 34.
    A Tax onGasoline  With a 50 cent tax  QD = 150 - 50Pb = 60 + 40PS = QS  150 - 50(PS+ .50) = 60 + 40PS  PS = .72  Pb = .5 + PS  Pb = $1.22 Chapter 9 Slide 34
  • 35.
    A Tax onGasoline  With a 50 cent tax Q = 150 -(50)(1.22) = 89 bg/yr Q falls by 11% Chapter 9 Slide 35
  • 36.
    Impact of a50 Cent Gasoline Tax D S Price ($ per 1.50 gallon) Lost Consumer Surplus Pb = 1.22 The annual revenue from the tax is .50(89) A or $44.5 billion. The buyer P0 = 1.00 pays 22 cents of the tax, and t = 0.50 the producer pays 28 cents. D PS = .72 Lost Producer Surplus .50 11 Quantity (billion 0 50 60 89 100 150 gallons per year) Chapter 9 Slide 36
  • 37.
    Impact of a50 Cent Gasoline Tax D S Price ($ per 1.50 gallon) Lost Consumer Surplus Pb = 1.22 A P0 = 1.00 Deadweight loss = $2.75 billion/yr t = 0.50 D PS = .72 Lost Producer Surplus .50 11 Quantity (billion 0 50 60 89 100 150 gallons per year) Chapter 9 Slide 37
  • 38.
    Summary  Simple models of supply and demand can be used to analyze a wide variety of government policies.  In each case, consumer and producer surplus are used to evaluate the gains and losses to consumers and producers. Chapter 9 Slide 38
  • 39.
    Summary  When government imposes a tax or subsidy, price usually does not rise or fall by the full amount of the tax or subsidy.  Government intervention generally leads to a deadweight loss. Chapter 9 Slide 39
  • 40.
    Summary  Government intervention in a competitive market is not always a bad thing. Chapter 9 Slide 40
  • 41.
    End of Chapter9 The Analysis of Competitive Markets

Editor's Notes