The document compares the power management capabilities of Dell OpenManage Power Center and IBM Systems Director Active Energy Manager. It finds that Dell OpenManage Power Center provided more precise power limiting, with actual power usage within 2% of the set limit, while IBM Active Energy Manager's actual usage was 4-8% lower than the limit. This tighter control with Dell allows for greater server density within the same power capacity. The Dell PowerEdge R720 also offered better performance per watt and supports higher temperatures than the IBM System x3650 M4 tested.
Overcoming Rack Power Limits with Virtual Power Systems Dynamic Redundancy an...Steve Houck
Summary
This paper describes how SourceMix, a dynamic redundancy technology from VPS, allows Intel® Rack Scale Design (Intel® RSD) customers to take full advantage of system composability and module upgradeability by extending the existing data center power infrastructure.
Virtual Power Systems - Intelligent Control of Energy (ICE) and Software Defi...Steve Houck
VPS provides a Software Defined Power solution using intelligent batteries and software to optimize power distribution in data centers. This allows data centers to increase power utilization from 20-60% to over 90% by peak shaving and dynamically allocating power budgets. It can generate 20-50% additional revenue and defer $10-15M/MW in CapEx and $1M/MW/yr in OpEx. The solution is deployed non-disruptively using VPS hardware and software to monitor and control power distribution.
Smart energy is a trending concept in a field crowded with competing and complementary terms, technologies, and approaches – but has the business case yet been made? Andy Lawrence will share his views on where this technology segment is headed.
Managing power in the datacenter can be a good strategy to reduce power and cooling overheard while allowing servers operate at the most efficient power levels and do as much work as possible within your specific power policies.
We found that using Intel Node Manager to set power limits on servers running various workloads increased performance per watt by up to 42.8 percent compared to running the same workloads with no power management solution.
StruxureWare is Schneider Electric's DCIM software suite that integrates various data center management applications. It provides visibility and control of infrastructure assets from the building level down to the server. The software suite monitors and manages key metrics like power, cooling capacity, and IT asset usage. It helps optimize data center performance and efficiency through features like real-time monitoring, capacity planning, and energy analytics. Schneider Electric is a leading DCIM provider due to its comprehensive product portfolio, expertise, and ability to deliver an end-to-end solution for data center management.
A data center infrastructure management (DCIM) system collects and manages information about a data center's assets, resource use, and operational status. This information is analyzed and distributed to help optimize the data center's performance and meet business goals. Implementing DCIM solutions such as instrumentation, monitoring, and analytics can improve efficiency, reduce costs, and enable proactive management of the physical infrastructure and IT systems. Emerson Network Power provides a comprehensive portfolio of DCIM hardware and software products to help organizations gain visibility and control over their data center resources.
Understanding Power Redundancy Levels in Data CentersMDC Data Centers
Redundancy is a critical factor when choosing a Data Center provider because it directly affects the level of systems availability. There are several power components in a Data Center, and every one of them is a point of failure, which can incur significant financial and data losses for your company.
Get to know more about levels of redundancy and choose what's best for your business.
The combination of Cisco's UCS Manager and Schneider Electric's DCIM solution provides Cisco UCS customers with an opportunity to bridge the gap between IT and Facilities, offer transparency across the two silos, and positively impact the rest of the organization – both in terms of efficiency, uptime and capex/opex costs. This is achieved by optimising the existing physical infrastructure capacities, thus reducing overprovisioning and improving the balance between supply and demand, resulting in continual availability and optimal energy efficiency.
DCIM: An Integral Part of the Software Defined Data CentreConcurrentThinking
Do you know what DCIM is? Discover with Concurrent Thinking how to improve your data centre efficiency, how to overcome challenges in data centres and what the future of DCIM is.
Find out more here: http://www.concurrent-thinking.com/
The document discusses strategies for making data centers more energy efficient without compromising performance or reliability. It outlines 10 best practices including using more efficient processors and power supplies, server virtualization, improved cooling practices, and monitoring systems. Implementing these holistic strategies from the IT equipment level upwards can significantly reduce energy usage through cascading effects while freeing up capacity.
The document discusses APC by Schneider Electric solutions for data centers and IT environments. It introduces their latest SMB solution called the Netshelter CX, which is a soundproofed "server room in a box" available in three sizes. It also discusses how cloud computing impacts data center power and infrastructure, and how APC can help through services like efficiency assessments and claims of efficiency entitlement. The document promotes APC's software solutions for data center management and optimization through virtual machine migration and communication between physical and virtual infrastructure systems.
Improving your PUE while consolidating into an existing live data centerSchneider Electric
While there are multiple consolidation options to consider, upgrading an existing data center has a significantly lower capital investment, requires no new real estate acquisition, can be phased to match IT refresh cycles and IT virtualization, and can be done while the data center is live. This session explores these considerations which are particularly important in the Federal space as well as a high density POD overlay discussion and approaches to reducing PUE.
DCIM tools help data center managers improve planning, lower costs, and speed up information delivery by providing visibility into data center infrastructure and automation of manual processes. They solve problems around maintaining availability and responding quickly to business needs while lowering costs during consolidation and cloud computing initiatives. DCIM tools provide concise summaries of capacity, assets, and performance to help answer questions around planning, operations, and analytics. Their use is important for reducing operational expenses by 10-30% annually while improving productivity.
Presentation provides an overview of Dell Data Center Networking portfolio overview and product offerings. Content includes
Discussion on Dell Open Networking strategy and Dell reference architectures for Data Center Networking.
The document summarizes the IBM Power 730 Express server, highlighting its high performance, density, energy efficiency, and ability to run multiple workloads in a virtualized environment. It details the server's POWER7+ processor technology, memory capacity, I/O capabilities, and virtualization and reliability features. The Power 730 Express is a two-socket rack server supporting up to 16 cores, large memory capacity, and various operating systems.
[Case study] Green Mountain Power: Reducing the duration of outagesSchneider Electric
Customer benefits:
• Eliminates the need to print thousands of maps, design packets and work order forms
• Saves on labor costs
• Support for both Web and desktop access
The document describes the architecture of an application server system. It includes application servers, database servers, storage arrays, and other supporting servers. The application servers are organized into pools connected to shared query, cache, and indexing servers. The database servers are clustered with redundancy and housed in high capacity storage arrays. Specific servers and storage are designated for different regions and databases.
Data Center Cooling Design - Datacenter-serverroommarlisaclark
Keep your data center cool and healthy with our smart Data Center Cooling Design which makes sure your data centers never get exhausted and work efficiently. Visit: http://www.datacenter-serverroom.com/rack-row-room-data-center-cooling
Overview of the Dreamwatts smart meter technology that allows you to manage and control your building's energy consumption from your desktop. You can set your thermostats to start and stop automatically, and see clearly where you can save money. Visit bottomlinecomfort.com for a demo.
Preventing Database Perfomance Issues | DB OptimizerMichael Findling
DB Optimizer is designed for database performance tools that focus on what is happening in the database and fixing it, rather than preventing problems. DB Optimizer (particularly when used in conjunction with J Optimizer) will help to data management groups closer together anbd collaborate.
Data Center Floor Design - Your Layout Can Save of Kill Your PUE & Cooling Ef...Maria Demitras
Implementing data center best practices and using CFD models allowed Great Lakes to suggest a data center layout that would improve PUE and efficiency. Jason Hallenbeck, DCDC, explains the concepts behind how data center floor design can save or kill your PUE and cooling efficiency—as found in this proposal. Find Jason presenting at the BICSI Fall Conference on September 14th at 1:30 pm.
MoreVRP is a database performance monitoring and acceleration tool, and offers DBAs the capability to have real-time monitoring and resource management and control.
- The document provides basic performance tuning guidelines for MySQL databases, including checking for hardware/software issues, measuring performance at different system levels, changing one variable at a time, and tracking changes to enable rollback.
- It recommends starting with simple fixes like updates before optimizing the database configuration, and notes performance tuning is only needed to address identified problems rather than tuning for its own sake.
- Specific MySQL configuration variables are listed that could improve performance on systems with over 2GB RAM, such as increasing buffer sizes and adjusting logging settings.
Learn how the IBM i delivers a highly scalable and virus resistant architecture with a stable database and middleware foundation for efficiently deploying business processing applications. For more information on Power systems, visit http://ibm.co/Lx6hfc.
Teradata Aggregate Join Indices And Dimensional Modelspepeborja
The document discusses using aggregate join indices and dimensional models in Teradata to improve query performance for reporting and analytics workloads while maintaining a normalized 3NF data model. It provides an example comparing querying sales data from the past year versus the current year using the 3NF model versus a dimensional model with and without aggregate join indices. Using the dimensional model and join indices reduced the data volume accessed, eliminated table joins, and improved performance metrics like CPU usage, disk I/O, and elapsed time. Maintaining both models allows enjoying benefits of each while technology like join indices provides dimensional access at different granularities with low overhead.
Multicore processors integrate multiple processor cores into a single chip to boost performance while minimizing heat output. As server density and performance demands increase, multicore technology provides an alternative to increasing clock speeds alone. IT organizations should consider software optimization, balancing performance across platform elements, and the scalability benefits of multicore processors to enhance enterprise systems while addressing power and cooling challenges.
The document provides an overview of database fundamentals including what a database is, relational databases, primary keys, foreign keys, advantages of relational databases, data warehousing, active data warehousing, and Teradata. Key points include:
- A database is a collection of logically related and shared data that is protected and managed.
- A relational database consists of related tables with rows and columns. Primary keys uniquely identify rows and foreign keys define relationships between tables.
- Relational databases are easy to use, understand, and allow for flexible responses to changing business needs.
- A data warehouse contains extracted and consolidated data from operational systems for analysis and reporting.
- Active data warehousing provides timely access
Effective power management is quickly becoming a major concern for data centers of all sizes. Specialized power management software is now available to help meet these needs. We tested two of these power management tools, Dell OpenManage Power Center and JouleX Energy Manager for Data Centers.
Both Dell OpenManage Power Center 2.0 and JouleX Energy Manager address some of the most common critical power tasks for your data center servers. JouleX Energy Manager is a product that includes additional features, but you must pay upfront acquisition costs and incur recurring software maintenance costs for potentially less-common features that just a subset of IT departments may implement. In contrast, Dell OpenManage Power Center, when used in conjunction with iDRAC Enterprise, comes at a very compelling price point – $0.00. This translates to a great value and an immediate return on investment.
Dell OpenManage Enterprise Power Manager 3.0 delivered faster server power monitoring and capping vs. completing tasks manually
Knowing an controlling how much power your servers use is a critical step in improving sustainability and managing your organization’s carbon footprint. It could also help your bottom line by potentially
reducing power bills. Simplifying server power monitoring and management tasks can mean saving time and effort for IT admins, too. If you are using Dell PowerEdge servers, OpenManage Enterprise Power Manager 3.0 automates critical tasks that can help you control, or even reduce, your data center’s power consumption faster and more easily than using manual processes with iDRAC. In addition to automating the data collection and power capping tasks we tested, the Power Manager 3.0 extension enabled us to scale out the node count without adding time and effort to the task.
Dell PowerEdge M820 blades: Balancing performance, density, and high availabi...Principled Technologies
Finding a server that can deliver the right balance of high workload performance, density, and RAS features can help you meet both infrastructure and business goals at the same time.
In our tests, the single-width Dell PowerEdge M820 blade delivered 19.3 percent better Oracle Database 12c performance than the HP ProLiant BL680c G7 in half the space, meaning it could deliver 2.38 times more transactions per U. The value of the denser Dell PowerEdge M820 was clear in our cost analysis of the two systems. Because the Dell PowerEdge M820 takes up less space, you need fewer enclosures, less rack space, and can save on port costs. In our sample comparison of two performance-equivalent solutions, we found that the Dell PowerEdge M820 solution could save up to 42.1 percent compared to an HP ProLiant BL680c G7 solution. That’s money that you can use to buy even more servers for greater performance or to innovate elsewhere. We also found that the Dell PowerEdge M820 took high availability into account by utilizing key RAS features to help increase your workload uptime.
If you’re looking for a dense blade solution to lower costs with the power to handle your important workloads and keep them running, our study shows that the Dell PowerEdge M820 blade addresses all those concerns.
The Dell OpenManage Enterprise Power Manager 3.0 plug-in provides sustainability insights through automated data collection and reporting. It tracks power usage metrics, identifies idle servers, estimates carbon emissions, and detects devices exceeding power thresholds - helping optimize infrastructure utilization and reduce energy costs and carbon footprint. The plug-in interfaces all functionality through a single console for improved visibility and workload management.
This document discusses Intel's Intelligent Power Node Manager solution for managing power usage in data centers. It notes that power and cooling costs are a major challenge as data needs increase exponentially. The Power Node Manager allows data center managers to set a power budget or "cap" for each server to better utilize existing power capacity and increase compute density. It provides real-time power monitoring and enables power capping to maintain performance within the set limit or adjust if the limit is exceeded. This allows data centers to squeeze more performance from their existing power infrastructure.
Systems management savings with Dell OpenManage on 13G Dell PowerEdge servers Principled Technologies
Administrators can spend their time doing routine tasks such as firmware updates, or they can spend their time on other initiatives to make your data center and your business more successful. Older servers keep admins focused on routine tasks instead of innovation because they just don’t have the capabilities to streamline management in a meaningful way to lessen the burden of routine management tasks.
In our hands-on tests, we found that Dell PowerEdge R730 servers with Dell OpenManage dramatically reduced the time it took to deploy, update, monitor, and maintain servers compared to completing the tasks manually on older systems. We estimate that you could save as much as 91.3 percent of administrator time—nearly 800 hours—over two years for a 200-server deployment.
Don’t let your older servers continue to be a time sink for administrators. By upgrading to new Dell PowerEdge R730 servers with new systems management features to handle routine tasks, you can potentially redirect those resources to innovation in other areas.
Using Lenovo ThinkServer Smart Grid Technology with Intel Node Manager Technology allows you to plan, observe, and manage your power utilization on Lenovo servers. In processor-intensive workloads, you can lower power and achieve increased performance per watt for maximum efficiency. In IO-intensive workloads, where unused processor utilization exists, you can increase server density per rack (per unit power) and recoup unused power without significantly affecting overall performance. These and the other features of Lenovo ThinkServer Smart Grid Technology offer new flexible and powerful ways for administrators to manage data center power usage and control costs.
Windows server power_efficiency___robben_and_worthington__finalBruce Worthington
Computer Measurement Group Journal, Spring 2009.
Windows Server power efficiency has improved from release to release over the past decade. This paper presents the methodology and data used to validate the existing Windows Server power management algorithms, covers server-class processor and component power measurements, and discusses some Windows’ power measurement tools and future power optimizations.
The 16th Generation Dell PowerEdge R760 server with Broadcom NICs: Save money...Principled Technologies
Principled Technologies testing showed that a 16th Generation Dell PowerEdge R760 server featuring a Broadcom BCM57508-P2100G NIC delivered all three vs. previous‑generation PowerEdge servers
Conclusion
Organizations don’t have to choose between saving money, doing more work, and using less energy; the new 16th Generation Dell PowerEdge R760 servers with Broadcom NICs do all three. In our hands-on testing, the new 16th Generation Dell PowerEdge R760 server featuring a Broadcom NIC offered 166.1 percent more Ops/s per US dollar, 129.5 percent more Ops/s, and 24.2 percent better performance per watt than the 14th Generation Dell PowerEdge R740 server. This means the PowerEdge R760 with a Broadcom NIC did over twice as much work at a lower cost with nearly 25 percent better power efficiency than the PowerEdge R740. When compared to the 15th Generation Dell PowerEdge R750, the PowerEdge R760 processed 29.8 percent more Ops/s at a lower cost in terms of Ops/s per US dollar and offered 3.8 percent better performance per watt.
In addition to lowering cooling costs and carbon emissions, choosing the latest-generation servers can help businesses lower other operating costs, such as maintenance and security compliance. Because the latest-generation Dell PowerEdge R760 servers offer more compute capacity, fewer servers can do more work, potentially reducing licensing costs and the physical footprint of a data center. Newer servers often feature the most recent manageability and security features, which can make it easier for businesses to manage their servers and protect their data. By choosing servers with better performance, businesses can reduce the response time of their systems and provide a better user experience.
Increasingly, businesses are under pressure to reduce the energy consumption and cost of their data centers while maintaining or increasing performance. Key web technologies such as Redis can offer businesses a competitive edge, but they also require a large amount of data processing. Businesses can meet these challenges with Dell PowerEdge R760 servers with Broadcom NICs that offer better costefficiency, performance, and power-efficiency.
This document discusses ways to improve data center efficiency. It notes that data centers currently consume 1.5-2.2% of global power usage. Improving efficiency can save electricity and costs. Metrics like PUE measure efficiency by comparing total energy use to IT equipment energy use. Google achieved a PUE of 1.16 through innovations like integrated server UPS batteries and optimized cooling. The document outlines various hardware, software, and operational strategies data centers can use to improve efficiency, such as virtualization, lean operating systems, storage optimization, and intelligent workload scheduling.
This document discusses how to design data centers for maximum energy efficiency. It identifies the main culprits of inefficiency as power equipment, cooling equipment, lighting, oversized equipment, and poor configuration. It recommends 8 characteristics of highly efficient data centers, including using scalable power and cooling, row-based cooling, high-efficiency UPS, high voltage distribution, variable speed drives, capacity management tools, and room layout tools. The document outlines 7 key elements of efficient data center design that incorporate these characteristics and can save up to 40% on energy costs.
This document summarizes the key steps in calculating power and cost savings from virtualizing servers. It discusses identifying needs and developing a baseline by measuring current hardware usage. It then covers calculating power savings based on virtual infrastructure configurations and average wattages. Finally, it outlines how to determine total cost of ownership savings from reductions in hardware, facilities, support and other expenses. The overall goal is to demonstrate savings across multiple stakeholder groups from customers to C-level executives to operations managers to end users.
Dell PowerEdge R720 rack server solutions for virtual desktop infrastructures Principled Technologies
Getting more value out of your servers is a smart way to reduce datacenter and VDI costs. In our tests, the Dell PowerEdge R720 server not only cost up to 5.4 percent less per user than the HP server, it also consumed 3.8 percent less power per virtual desktop user than the HP server when running workloads. When extrapolated over an entire rack of servers and with datacenters full of these racks, the potential savings both in hardware costs and in power costs could be dramatic.
Dell OpenManage Enterprise Power Manager 3.0 provides data center managers with end-to-end insights into their data centers that enable them to improve power usage and track greenhouse gas emissions. It allows automated collection of server utilization metrics, location information, and power consumption data to identify resources using high energy or underutilized power. The plugin also features carbon emission tracking and an energy cost calculator to help guide infrastructure optimization and consolidation efforts to reduce costs while meeting sustainability goals.
Increase security, sustainability, and efficiency with robust Dell server man...Principled Technologies
Compared to the Supermicro management portfolio
Conclusion
Choosing a vendor for server purchases is about more than just the hardware platform. Decision-makers must also consider more long-term concerns, including system/data security, energy efficiency, and ease of management. These concerns make the systems management tools a vendor offers as important as the hardware.
We investigated the features and capabilities of server management tools from Dell and Supermicro, comparing Dell iDRAC9 against Supermicro IPMI for embedded server management and Dell OpenManage Enterprise and CloudIQ against Supermicro Server Manager for one-to-many device and console management and monitoring. We found that the Dell management tools provided more comprehensive security, sustainability, and management/monitoring features and capabilities than Supermicro servers did. In addition, Dell tools automated more tasks to ease server management, resulting in significant time savings for administrators versus having to do the same tasks manually with Supermicro tools.
When making a server purchase, a vendor’s associated management products are critical to protect data, support a more sustainable environment, and to ease the maintenance of systems. Our tests and research showed that the Dell management portfolio for PowerEdge servers offered more features to help organizations meet these goals than the comparable Supermicro management products.
Intel Intelligent Power Node Manager is a server power management system that reports actual power usage and caps power usage to maximize efficiency. It allows data center managers to set power budgets for servers to enable up to 20% more dense deployments. When paired with Intel Data Center Manager, it can help optimize entire data centers by monitoring individual server power consumption and temperatures to link cooling to actual power demand.
Server consolidation with the NEC Express5800/A2040b: Power and performance a...Principled Technologies
For your data center to keep pace with the growth of your business, your database servers must be able to run as many VMs as possible with the lowest amount of power per unit of performance, and do so in the smallest amount of rack space. If you have a collection of aging servers taking up too much space and using too much power in your data center, consider consolidating them into the NEC Express5800/A2040b server powered by the Intel Xeon processor E7-4890 v2. Based on our findings, a single NEC Express5800/A2040b can replace nine HP ProLiant DL385 G6 legacy servers with VMs running heavy database workloads. This means the NEC Express5800/A2040b server can deliver similar VM database performance while using 77.8 percent less rack space, freeing up your data center space for future growth and potentially saving you from costly infrastructure expansions. What’s more, the NEC Express5800/A2040b server delivered 57.0 percent power savings while running the same workload as the legacy server, which resulted in 123.7 percent better performance per watt. The added power efficiency can save your business in recurring power and cooling costs of your data center. These advantages, combined with steady performance, make the NEC Express5800/A2040b server a wise choice for your data center.
As our tests show, investing in the powerful new Dell PowerEdge R920 running Oracle VM Server 3.2.8 with Oracle Database 12c VMs achieves cost savings without compromising performance. In our testing, a single Dell PowerEdge R920 could perform five times the work of a single HP ProLiant DL385 G6 server; the costs to power and cool the Dell PowerEdge would be 43 percent less than the five servers it could replace. The three-year software licensing costs of the Dell PowerEdge R920 server would be 22 percent lower than the licensing costs for the five-server solution. These dramatic savings—which come out to $212,091 for our single test environment — could grow to millions of dollars in a larger consolidation effort.
The Dell PowerEdge R410 and PowerEdge T410 servers are 11th-generation Dell PowerEdge servers designed to meet the needs of small and medium businesses in a cost-effective way. They are comprehensively tested to help ensure compliance with stringent 11th-generation PowerEdge server standards for electrical, mechanical, thermal, and acoustic design. Base configurations include cost-optimized components like cabled power supplies and hard drives, while more advanced features are available as optional upgrades. This allows the servers to provide high performance suitable for SMB needs at an affordable price.
Process 84% more MySQL database activity with the latest-gen Dell PowerEdge R...Principled Technologies
The 16th Generation server handled more database transactions than a previous-generation PowerEdge R750 server with vSphere 7
New servers and software versions can be a boon for your organization. If you’re running MySQL workloads for web applications, retail, or other use cases, your organization could see a performance boost by upgrading to latest-generation Dell PowerEdge R760 servers running VMware vSphere 8.0. In our testing, a PowerEdge R760 server handled 84.5 percent more NOPM than an older Dell PowerEdge R750 server. We also found that Live Optics infrastructure monitoring software allows you to view performance data for new PowerEdge R760 and vSphere 8.0 environments so you can manage those resources to optimize your MySQL workloads.
Similar to Competitive Analysis Dell Open Manage Power Center vs IBM Active Energy Manager (20)
Driving Business Innovation: Latest Generative AI Advancements & Success StorySafe Software
Are you ready to revolutionize how you handle data? Join us for a webinar where we’ll bring you up to speed with the latest advancements in Generative AI technology and discover how leveraging FME with tools from giants like Google Gemini, Amazon, and Microsoft OpenAI can supercharge your workflow efficiency.
During the hour, we’ll take you through:
Guest Speaker Segment with Hannah Barrington: Dive into the world of dynamic real estate marketing with Hannah, the Marketing Manager at Workspace Group. Hear firsthand how their team generates engaging descriptions for thousands of office units by integrating diverse data sources—from PDF floorplans to web pages—using FME transformers, like OpenAIVisionConnector and AnthropicVisionConnector. This use case will show you how GenAI can streamline content creation for marketing across the board.
Ollama Use Case: Learn how Scenario Specialist Dmitri Bagh has utilized Ollama within FME to input data, create custom models, and enhance security protocols. This segment will include demos to illustrate the full capabilities of FME in AI-driven processes.
Custom AI Models: Discover how to leverage FME to build personalized AI models using your data. Whether it’s populating a model with local data for added security or integrating public AI tools, find out how FME facilitates a versatile and secure approach to AI.
We’ll wrap up with a live Q&A session where you can engage with our experts on your specific use cases, and learn more about optimizing your data workflows with AI.
This webinar is ideal for professionals seeking to harness the power of AI within their data management systems while ensuring high levels of customization and security. Whether you're a novice or an expert, gain actionable insights and strategies to elevate your data processes. Join us to see how FME and AI can revolutionize how you work with data!
Why You Should Replace Windows 11 with Nitrux Linux 3.5.0 for enhanced perfor...SOFTTECHHUB
The choice of an operating system plays a pivotal role in shaping our computing experience. For decades, Microsoft's Windows has dominated the market, offering a familiar and widely adopted platform for personal and professional use. However, as technological advancements continue to push the boundaries of innovation, alternative operating systems have emerged, challenging the status quo and offering users a fresh perspective on computing.
One such alternative that has garnered significant attention and acclaim is Nitrux Linux 3.5.0, a sleek, powerful, and user-friendly Linux distribution that promises to redefine the way we interact with our devices. With its focus on performance, security, and customization, Nitrux Linux presents a compelling case for those seeking to break free from the constraints of proprietary software and embrace the freedom and flexibility of open-source computing.
TrustArc Webinar - 2024 Global Privacy SurveyTrustArc
How does your privacy program stack up against your peers? What challenges are privacy teams tackling and prioritizing in 2024?
In the fifth annual Global Privacy Benchmarks Survey, we asked over 1,800 global privacy professionals and business executives to share their perspectives on the current state of privacy inside and outside of their organizations. This year’s report focused on emerging areas of importance for privacy and compliance professionals, including considerations and implications of Artificial Intelligence (AI) technologies, building brand trust, and different approaches for achieving higher privacy competence scores.
See how organizational priorities and strategic approaches to data security and privacy are evolving around the globe.
This webinar will review:
- The top 10 privacy insights from the fifth annual Global Privacy Benchmarks Survey
- The top challenges for privacy leaders, practitioners, and organizations in 2024
- Key themes to consider in developing and maintaining your privacy program
Let's Integrate MuleSoft RPA, COMPOSER, APM with AWS IDP along with Slackshyamraj55
Discover the seamless integration of RPA (Robotic Process Automation), COMPOSER, and APM with AWS IDP enhanced with Slack notifications. Explore how these technologies converge to streamline workflows, optimize performance, and ensure secure access, all while leveraging the power of AWS IDP and real-time communication via Slack notifications.
Goodbye Windows 11: Make Way for Nitrux Linux 3.5.0!SOFTTECHHUB
As the digital landscape continually evolves, operating systems play a critical role in shaping user experiences and productivity. The launch of Nitrux Linux 3.5.0 marks a significant milestone, offering a robust alternative to traditional systems such as Windows 11. This article delves into the essence of Nitrux Linux 3.5.0, exploring its unique features, advantages, and how it stands as a compelling choice for both casual users and tech enthusiasts.
GraphRAG for Life Science to increase LLM accuracyTomaz Bratanic
GraphRAG for life science domain, where you retriever information from biomedical knowledge graphs using LLMs to increase the accuracy and performance of generated answers
Pushing the limits of ePRTC: 100ns holdover for 100 daysAdtran
At WSTS 2024, Alon Stern explored the topic of parametric holdover and explained how recent research findings can be implemented in real-world PNT networks to achieve 100 nanoseconds of accuracy for up to 100 days.
Dr. Sean Tan, Head of Data Science, Changi Airport Group
Discover how Changi Airport Group (CAG) leverages graph technologies and generative AI to revolutionize their search capabilities. This session delves into the unique search needs of CAG’s diverse passengers and customers, showcasing how graph data structures enhance the accuracy and relevance of AI-generated search results, mitigating the risk of “hallucinations” and improving the overall customer journey.
Best 20 SEO Techniques To Improve Website Visibility In SERPPixlogix Infotech
Boost your website's visibility with proven SEO techniques! Our latest blog dives into essential strategies to enhance your online presence, increase traffic, and rank higher on search engines. From keyword optimization to quality content creation, learn how to make your site stand out in the crowded digital landscape. Discover actionable tips and expert insights to elevate your SEO game.
GraphSummit Singapore | The Art of the Possible with Graph - Q2 2024Neo4j
Neha Bajwa, Vice President of Product Marketing, Neo4j
Join us as we explore breakthrough innovations enabled by interconnected data and AI. Discover firsthand how organizations use relationships in data to uncover contextual insights and solve our most pressing challenges – from optimizing supply chains, detecting fraud, and improving customer experiences to accelerating drug discoveries.
Sudheer Mechineni, Head of Application Frameworks, Standard Chartered Bank
Discover how Standard Chartered Bank harnessed the power of Neo4j to transform complex data access challenges into a dynamic, scalable graph database solution. This keynote will cover their journey from initial adoption to deploying a fully automated, enterprise-grade causal cluster, highlighting key strategies for modelling organisational changes and ensuring robust disaster recovery. Learn how these innovations have not only enhanced Standard Chartered Bank’s data infrastructure but also positioned them as pioneers in the banking sector’s adoption of graph technology.
UiPath Test Automation using UiPath Test Suite series, part 5DianaGray10
Welcome to UiPath Test Automation using UiPath Test Suite series part 5. In this session, we will cover CI/CD with devops.
Topics covered:
CI/CD with in UiPath
End-to-end overview of CI/CD pipeline with Azure devops
Speaker:
Lyndsey Byblow, Test Suite Sales Engineer @ UiPath, Inc.
How to Get CNIC Information System with Paksim Ga.pptxdanishmna97
Pakdata Cf is a groundbreaking system designed to streamline and facilitate access to CNIC information. This innovative platform leverages advanced technology to provide users with efficient and secure access to their CNIC details.
Full-RAG: A modern architecture for hyper-personalizationZilliz
Mike Del Balso, CEO & Co-Founder at Tecton, presents "Full RAG," a novel approach to AI recommendation systems, aiming to push beyond the limitations of traditional models through a deep integration of contextual insights and real-time data, leveraging the Retrieval-Augmented Generation architecture. This talk will outline Full RAG's potential to significantly enhance personalization, address engineering challenges such as data management and model training, and introduce data enrichment with reranking as a key solution. Attendees will gain crucial insights into the importance of hyperpersonalization in AI, the capabilities of Full RAG for advanced personalization, and strategies for managing complex data integrations for deploying cutting-edge AI solutions.
HCL Notes and Domino License Cost Reduction in the World of DLAUpanagenda
Webinar Recording: https://www.panagenda.com/webinars/hcl-notes-and-domino-license-cost-reduction-in-the-world-of-dlau/
The introduction of DLAU and the CCB & CCX licensing model caused quite a stir in the HCL community. As a Notes and Domino customer, you may have faced challenges with unexpected user counts and license costs. You probably have questions on how this new licensing approach works and how to benefit from it. Most importantly, you likely have budget constraints and want to save money where possible. Don’t worry, we can help with all of this!
We’ll show you how to fix common misconfigurations that cause higher-than-expected user counts, and how to identify accounts which you can deactivate to save money. There are also frequent patterns that can cause unnecessary cost, like using a person document instead of a mail-in for shared mailboxes. We’ll provide examples and solutions for those as well. And naturally we’ll explain the new licensing model.
Join HCL Ambassador Marc Thomas in this webinar with a special guest appearance from Franz Walder. It will give you the tools and know-how to stay on top of what is going on with Domino licensing. You will be able lower your cost through an optimized configuration and keep it low going forward.
These topics will be covered
- Reducing license cost by finding and fixing misconfigurations and superfluous accounts
- How do CCB and CCX licenses really work?
- Understanding the DLAU tool and how to best utilize it
- Tips for common problem areas, like team mailboxes, functional/test users, etc
- Practical examples and best practices to implement right away
HCL Notes and Domino License Cost Reduction in the World of DLAU
Competitive Analysis Dell Open Manage Power Center vs IBM Active Energy Manager
1. A PRINCIPLED TECHNOLOGIES TEST REPORT
Commissioned by Dell Inc.; October 2012
SERVER POWER MANAGEMENT COMPARISON: DELL OPENMANAGE
POWER CENTER AND IBM SYSTEMS DIRECTOR ACTIVE ENERGY MANAGER
In your data center, you need both strong and continuous performance to handle the
needs of your employees and customers, and advanced management technologies to keep
operational expenses down. High among these operational expenses are the power costs related
to running and cooling your servers.
We tested two applications—Dell OpenManage Power Center managing a Dell
PowerEdge R720 server and IBM® Systems Director Active Energy Manager, an IBM Systems
Director plug-in, managing an IBM System x3650 M4 server—with the goal of understanding the
ways that their respective power management tools affect performance and power usage in the
data center. We focused on the tools’ approaches to setting power limits, also known as power
capping.
In our tests, the Dell OpenManage Power Center provided more precise power limiting
than IBM Active Energy Manager. The difference between the actual power used by the Dell
solution and the power limit we set was 2 percent or less, versus a difference of 4 to 8 percent
with the IBM solution. The smaller gap lets administrators maximize the number of servers that
can fit within the data center’s total power capacity. Increasing data center density in this way
saves money. Dell OpenManage Power Center also offered greater management flexibility out of
the box, including the ability to easily set priorities among servers and to initiate an emergency
power response.
The Dell PowerEdge R720 also offered greater performance per watt and supports a
much higher working temperature, through the Dell Fresh Air initiative, than the IBM System
x3650 M4. These energy-saving features can lead to significant data center energy cost savings
for your enterprise.
2. A Principled Technologies test report 2Server power management comparison: Dell OpenManage Power
Center and IBM Systems Director Active Energy Manager
THE POWER OF POWER LIMITS
One of the biggest sources of return from an investment in the latest equipment
and management software is being able to take advantage of new power-saving
technologies. In the typical server, power utilization increases as the server load
increases. Being able to limit or cap the amount of power a server or group of servers
consumes offers great flexibility, often without decreasing performance.
Power management tools let you as the administrator set power limits at the
data center, room, aisle, rack, or server level. You can also set different power limits for
different times. For example, you can give a server a lower power limit in the evenings,
when less work is taking place, and a higher limit during the day, when greater
performance is needed. Being able to set these limits can dramatically boost data center
rack density as you can now safely add extra servers to the same circuit without fear of
tripping the breaker.
Two approaches to power management: Dell OpenManage Power Center and IBM Active
Energy Manager
Dell OpenManage Power Center, using Intel Node Manager Technology, lets IT
administrators look at the data center power usage. Power Center is an open,
standards-based power management application that can read power usage
information from Dell PowerEdge servers, power distribution units, uninterruptable
power supplies, or Dell PowerEdge blade server chassis.
As an IT administrator, you know that you can only manage power utilization if
you can collect data related to it. OpenManage Power Center offers many advanced
features for monitoring your data center power utilization. You can view instantaneous
power usage or temperature and examine power usage over specific time increments
(15 minutes, 1 hour, 1 day, 1 week, 1 month, 3 months, or 1 year). OpenManage Power
Center shows peak, average, and minimum power across the data center, room, aisle,
rack, or server. Understanding your power utilization opens a wide range of
opportunities for server density, power savings, and uptime improvements.
To learn more about Dell OpenManage Power Center, visit
http://www.dell.com/us/enterprise/p/dell-openmanage-power-center/pd, or see an
additional report from Principled Technologies, at:
http://www.principledtechnologies.com/clients/reports/Dell/R720_power_0312.pdf
According to the IBM Web site, “IBM Systems Director Active Energy Manager is
an IBM Systems Director plug-in. Use Active Energy Manager to monitor and manage
the power and cooling needs of IBM servers and BladeCenter® systems. Non-IBM
systems can also be monitored using metering products, such as power distribution
units (PDU), sensors, and integration with facility software.
3. A Principled Technologies test report 3Server power management comparison: Dell OpenManage Power
Center and IBM Systems Director Active Energy Manager
“The tasks you can perform on Active Energy Manager resources include the
following: monitoring and collecting power consumption data; managing power, which
includes setting power savings options and power caps and automating power-related
tasks; configuring metering devices, such as PDUs and sensors; exporting data; viewing
events; calculating energy cost; setting thresholds; creating and setting power policies;
and monitoring power and cooling equipment that affect IT resources.”
For more detailed information on Active Energy Manager, visit
http://pic.dhe.ibm.com/infocenter/director/v6r1x/index.jsp?topic=/aem_420/fr
b0_main.html.
For testing, we applied the power caps on the input power. This worked fine on
the Dell PowerEdge R720 out of the box. However, the IBM System x3650 M4 did not
cap the input power correctly. We worked with IBM support and applied a patch to get
this feature working correctly. A Technote showing this patch is available at
http://www-01.ibm.com/support/
docview.wss?rs=0&q1=eServerOnDemandKBRCH&q2=649755169&uid=nas7d686520ea
29f65dc86257aa00031f774&loc=en_US&cs=utf-8&lang=
WHAT WE FOUND
When looking at a power management solution, it is important to understand
how the application lets you set power limits for optimum data center and system
management. Dell OpenManage Power Center and IBM Active Energy Manager handle
power limiting differently, with the main difference being the size of the gap between
the intended power limit and the actual power usage.
To understand this difference and its importance, you must first understand
what these two numbers mean. The intended power limit is the setting you enter in the
management software as a level not to be exceeded. For example, an intended limit of
80 percent means the server should never use more than 80 percent of its maximum
capacity at any time. The actual power limit is the amount of power the server actually
uses. Note that the actual power limit average should always be below the intended
limit.
To illustrate the difference between these two levels, we present graphs of both
systems’ actual power usage under two conditions: when we set the intended power
limit to 80 percent of their total power and when we set no power limit. We used a Dell
PowerEdge R720 with Dell OpenManage Power Center and an IBM System x3650 M4
with the IBM Active Energy Manager for this evaluation. Because the two servers have
different power draws, the intended limits of the two servers differ accordingly. We
chose this approach to avoid unfairly penalizing either of the servers by setting an
identical limit on both systems.
4. A Principled Technologies test report 4Server power management comparison: Dell OpenManage Power
Center and IBM Systems Director Active Energy Manager
Figure 1 shows the power usage at 1-second intervals over a 2-minute period
for the Dell PowerEdge R720 with an 80 percent power limit of 304 watts and with no
power limit. (Note: To magnify the power variations during the run, we do not start the
vertical axis of the chart at zero.) As Figure 1 shows, with the 304-watt intended limit,
actual power usage of the Dell PowerEdge R720 averaged slightly over 302 watts. While
it did reach the 304-watt limit, it never went over. The maximum difference between
the intended 80 percent of faceplate power (304 watts) and the actual power limit was
2 percent.
Figure 1: Actual power
usage of the Dell
PowerEdge R720 with an
80 percent power limit
stayed within 2 percent
of the limit. (To magnify
the power variations
during the run, we do
not start the vertical axis
at zero.)
280
300
320
340
360
380
400
420
10
20
30
40
50
60
70
80
90
100
110
120
Watts
Seconds
Dell PowerEdge R720 usage with and without
80% power limit of 304 watts
Actual
usage with
80% power
limit
Actual
usage with
no power
limit
80% limit
(304 watts)
Figure 2 shows the power usage at 1-second intervals over a 2-minute period
for the IBM System x3650 M4 with a 325-watt power limit and with no power limit. (As
in Figure 1, to magnify the power variations during the run, we do not start the vertical
axis of the chart at zero.) As Figure 2 shows, with the 325-watt intended limit, actual
power usage averaged around 310 watts, roughly 5 percent lower than intended power
limit.
While a larger difference between the intended and actual power limit does
guarantee that the power will not exceed the set limit, it also means that you cannot
configure a server rack as densely. For example, 20 servers with a 325-watt power limit
would be a total of 6,500 watts, while the actual power used would be 6,200 watts. This
means that 300 watts are allocated but unused. In this example, if the percentage
difference between the intended limit and actual power were closer, as with the Dell
PowerEdge R720, you could essentially put another server in the rack using the same
total power limit.
5. A Principled Technologies test report 5Server power management comparison: Dell OpenManage Power
Center and IBM Systems Director Active Energy Manager
Figure 2: Actual power usage
of the IBM System x3650 M4
with an 80 percent power limit
was roughly 5 percent lower
than the limit. (To magnify the
power variations during the
run, we do not start the
vertical axis at zero.) 280
300
320
340
360
380
400
420
10
20
30
40
50
60
70
80
90
100
110
120
Watts
Seconds
IBM System x3650 M4 usage with and without
80% power limit of 325 watts
Actual
usage
with 80%
power
limit
Actual
usage
with no
power
limit
The impact of power limiting
In addition to evaluating how both applications handle power limiting, we also
looked at the performance-per-watt advantages of the new Dell PowerEdge R720 server
at different power levels compared to the IBM System x3650 M4 server.
To test the performance per watt, we used DVD Store 2.1 (DS2), which reports
performance in orders per minute (OPM), running Microsoft SQL Server 2008 R2 with
6GB databases on both servers. For this workload testing, we used four SQL database
instances with two DVD Store databases. We used one client for each database for a
total of eight clients. (For details about that workload, see Appendix C.) Figure 3 shows
the results from our test.
As Figure 3 shows, running the PowerEdge R720 at as much as a 40 percent
power reduction provides performance-per-watt advantages over the IBM System
x3650 M4. In fact, running the PowerEdge R720 with a 30 percent power reduction
provides the highest performance-per-watt advantage. One practical application of the
data is with CPU-intensive nightly batch jobs, where it does not matter if the job takes a
few more minutes. Our findings show that you could run most efficiently if you limited
the power at 70 percent.
6. A Principled Technologies test report 6Server power management comparison: Dell OpenManage Power
Center and IBM Systems Director Active Energy Manager
Figure 3: The Dell PowerEdge
R720 was able to provide
better performance per watt
at each power limit when
compared to the IBM System
x3650 M4.
0
250
500
750
1,000
1,250
1,500
No limit 90% limit 80% limit 70% limit 60% limit
Performanceperwatt
Performance-per-watt impact of limiting power usage
Dell
PowerEdge
R720
IBM
System
X3650 M4
To test the limit feature, we used DVD Store 2.1 running eight Microsoft SQL
Server 2008 R2 6GB databases on both servers. To find the maximum performance per
watt, we ran each system as close to 100 percent processor utilization as possible.
Figure 4 shows the results from our test.
Total
OPM
CPU %
Power set
point (W)
Power utilization (W) Perf/
wattPeak No activity
Dell PowerEdge R720
No power limit 473,737 99.0 NA 377 108.9 1,256.6
90% power limit 443,318 99.0 342 338 109.1 1,311.6
80% power limit 406,205 99.0 304 302 109.1 1,345.0
70% power limit 363,644 99.0 266 264 109.2 1,377.4
60% power limit 307,349 98.8 228 226 109.3 1,360.0
IBM System x3650 M4
No power limit 474,443 99.1 NA 406 113.3 1,168.6
90% power limit 423,058 99.1 366 335 112.4 1,262.9
80% power limit 406,644 99.1 325 310 113.3 1,311.8
70% power limit 367,696 99.0 285 273 112.8 1,346.9
60% power limit 311,597 99.0 244 233 110.9 1,337.3
Figure 4: DVD Store results with CPU and power utilization. Higher OPM and performance/watt are better. Lower power
utilization is better.
7. A Principled Technologies test report 7Server power management comparison: Dell OpenManage Power
Center and IBM Systems Director Active Energy Manager
DELL OPENMANAGE KEY FEATURES
Dell OpenManage offers several key features to help manage your data center
to ensure server uptime and utilize power in the best way possible. We explain these
features in the section below.
Reliability during a power outage
Data center servers must stay up and available for users. Dell OpenManage
Power Center offers a feature to reduce power in the event of an emergency such as
drop in data center power or cooling.
Dell OpenManage has an option called Emergency Power Reduction (EPR). The
administrator can initiate EPR by simply clicking a button in the management console to
initiate the power reduction. This feature is available at all levels from the data center
down to an individual server, which enables administrators to be extremely precise in
selecting what to slow down.
To test the EPR feature, we ran a database workload using 100 percent
processor utilization on the Dell PowerEdge R720 while running on battery backup. First,
we ran the server with no power limits. We then repeated the test after selecting the
EPR option.
As Figure 5 shows, the Dell PowerEdge R720 ran longer with the emergency
power reduction feature enabled. While in EPR mode, the PowerEdge R720 is able to
run nearly four times as long, maximizing up time during a power outage.
Figure 5: Running on battery
backup with the emergency power
reduction feature enabled let the
Dell PowerEdge R720 run much
longer. 11
41
0
10
20
30
40
50
Max power Max power with emergency
power reduction feature
Minutes
Dell PowerEdge R720operationtime
using battery backup
IBM Active Energy Manager provides options for an administrator to set up a
group policy with power capping in the event of a power change, but the setup requires
many more steps. In addition, administrators must set the static power caps in advance
8. A Principled Technologies test report 8Server power management comparison: Dell OpenManage Power
Center and IBM Systems Director Active Energy Manager
of an emergency power event. We did not test the IBM emergency feature as a
comparison since there is no predefined emergency power feature on the IBM as with
Dell OpenManage. We found Dell OpenManage’s EPR simpler to initiate in the event of
a power failure.
Power limit response time
Because Dell OpenManage Power Center offers a low percentage difference
between the intended and actual limit, it is important for the software to react quickly
in the event that the power demand exceeds the intended limit. This fast reaction time
allows administrators to increase the server density on circuits without fear of
overloading. To test this feature, we implemented a power limit of 225 watts on the
server and then began the database workload. As the workload ran, the server power
increased up to the 225-watt limit. Figure 6 shows that within 300 milliseconds of going
over the power limit, the power came back down and stayed within 1 percent of the
power limit. (Note: To magnify the power variations during the run, we do not start the
vertical axis of the chart at zero.)
Figure 6: When power
usage on the Dell
PowerEdge R720
exceeded the limit, it
came back down in less
than half a second. (To
magnify the power
variations during the run,
we do not start the
vertical axis at zero.) 210
212
214
216
218
220
222
224
226
228
230
1 2 3 4 5 6 7 8 9 10 11 12 13 14 15
Power(W)
Time - 1 increment is ~200 ms (every 5 = 1 second)
Response time with 225-watt power limit
Thermal balancing
Another major advantage of the Dell PowerEdge R720 server over the IBM
System x3650 M4 server is its ability to operate at much higher temperatures. Through
the Dell Fresh Air initiative, Dell servers are now rated to operate at up to 113 degrees
Fahrenheit, allowing data centers to save substantially on cooling costs.1
Published
1
http://en.community.dell.com/dell-blogs/direct2dell/b/direct2dell/archive/2012/03/06/12-things-you-need-to-know-about-dell-
poweredge-12th-generation-servers-and-solutions-part-iii.aspx
9. A Principled Technologies test report 9Server power management comparison: Dell OpenManage Power
Center and IBM Systems Director Active Energy Manager
specifications for the IBM System x3650 M42
indicate that it supports operation at up to
104 degrees.
For most data center managers, the best approach will be to examine
temperature and usage patterns to determine the “sweet spot” where the data center is
providing the highest possible energy savings. For more information on the Dell Fresh
Air initiative, see www.dell.com/freshair.
Implementing server priority on the Dell PowerEdge R720
When using power limiting, it is important to provide proper server
performance to your applications. OpenManage Power Center offers the ability to set a
dynamic limit and to set priorities at the room, aisle, or server rack levels. When
applying the dynamic limit, you specify a priority of high, medium, or low for each group
based on its performance and power needs. For example, if applying a dynamic limit on
a server rack, you specify which servers are higher or lower priority.
To test this feature, we used the SPECjbb®2005 benchmark3
to apply a constant
workload on three servers in a rack. We ran each server at 100 percent CPU utilization.
The three Dell PowerEdge R720 servers consumed approximately 1,150 total watts. We
set a dynamic limit of 850 watts and gave each server a different priority—one high, one
medium, and one low. As Figure 7 shows, total power usage dropped precipitously
when the limit was applied, and the usage of the three servers varied according to their
priority.
We then stopped the workload on the high-priority server. Once OpenManage
Power Center identified available watts for the medium- and low-priority servers, they
were allowed to consume more power up to the limit of 850 total watts.
2
http://www.redbooks.ibm.com/abstracts/tips0850.html (Note: See “Supported environment” in the “Physical and electrical
specifications” section for operating temperature.)
3
SPECjbb2005 is an industry-standard benchmark created by the Standard Performance Evaluation Corp. (SPEC) to measure a
server’s Java performance. (Note: SPEC and SPECjbb2005 are trademarks of the Standard Performance Evaluation Corporation.)3
SPECjbb2005 is an industry-standard benchmark created by the Standard Performance Evaluation Corp. (SPEC) to measure a
server’s Java performance. (Note: SPEC and SPECjbb2005 are trademarks of the Standard Performance Evaluation Corporation.)
10. A Principled Technologies test report 10Server power management comparison: Dell OpenManage Power
Center and IBM Systems Director Active Energy Manager
Figure 7: With Dell
PowerEdge R720 servers,
you can implement a total
power limit for the group,
saving power on lower-
priority servers and
maintaining availability for
higher-priority servers.
0
200
400
600
800
1,000
1,200
1 21 41 61 81 101 121 141 161
Power(W)
Seconds
Power utilizationby priority during dynamic power limit
High
priority
Medium
priority
Low
priority
Total
power
The server priority feature is included with Dell OpenManage Power Center and
works automatically with your existing power distribution units (PDU), so other than the
purchase of the Dell PowerEdge servers, no special hardware is required.
While IBM Active Energy Manager provides the option to set group power
capping it does not have the ability to set priorities, but rather divides the allotted
power by the number of systems. This approach leaves power unutilized. For example,
in our testing we applied a 500-watt power cap on a group of two servers. When
running equal workloads, both servers used 250 watts of power. However, when we
stopped the workload on one server, the power draw dropped to the 110-watt idle
power level, while the other server continued to use only 250 watts of power. This left
140 watts of power unused. In the Dell OpenManage approach, the 140 watts of power
would be made available to the other server.
CONCLUSION
As data centers grow, their power needs increase and space becomes more and
more of a premium. These rising costs make it essential to manage your data center as
effectively as possible.
Using Dell OpenManage Power Center with Intel Node Manager Technology in
conjunction with the latest Dell PowerEdge servers offers a completely new approach to
data center power usage. Dell OpenManage Power Center allows managers to collect,
observe, and optimize power utilization to increase uptime and make better power-
usage decisions.
In our testing, we saw a gap of only 2 percent between actual usage and the
intended power limit; this small difference can let you fit more servers into your data
center without exceeding your total available power. While implementing power limits,
11. A Principled Technologies test report 11Server power management comparison: Dell OpenManage Power
Center and IBM Systems Director Active Energy Manager
the Dell PowerEdge R720 maintained consistent performance and delivered up to 7.5
percent more performance per watt than the IBM System x3650 M4 managed by IBM
Active Energy Manager.
Dell OpenManage Power Center features extended operation time by almost
four times using battery backup with their Emergency Power Reduction feature and
permitted us to implement server prioritizing.
In addition, through the Dell Fresh Air initiative the latest Dell PowerEdge R720
servers allow you to run at higher temperatures—up to 113 degrees—which can lead to
significant data center cost savings.
Overall, the Dell OpenManage Power Center gives data center managers greater
confidence and control over server power usage, which leads to an efficient, optimized
data center with significant cost savings.
12. A Principled Technologies test report 12Server power management comparison: Dell OpenManage Power
Center and IBM Systems Director Active Energy Manager
APPENDIX A – SERVER AND STORAGE CONFIGURATION INFORMATION
Figure 8 provides configuration information for the two servers we tested.
System Dell PowerEdge R720 IBM System x3650 M4
Power supplies
Total number 2 2
Vendor and model number Dell D750E-S1 Emerson™ 7001605-J000
Wattage of each (W) 750 750
Cooling fans
Total number 6 8
Vendor and model number AVC® DBTC0638B2V Delta Electronics® GFC0812DS
Dimensions (h x w) of each 2.5" x 2.5" 3" x 3"
Volts 12 12
Amps 1.2 1.8
General
Number of processor packages 2 2
Number of cores per processor 8 8
Number of hardware threads per core 2 2
System power management policy Balanced Balanced
CPU
Vendor Intel® Intel
Name Xeon® Xeon
Model number E5-2680 E5-2680
Stepping C1 C1
Socket type LGA2011 LGA2011
Core frequency (GHz) 2.70 2.70
Bus frequency (GT/s) 8.0 8.0
L1 cache 32 KB + 32 KB (per core) 32 KB + 32 KB (per core)
L2 cache 256 KB (per core) 256 KB (per core)
L3 cache 20 MB 20 MB
Platform
Vendor and model number Dell PowerEdge R720 IBM System X3650 M4
Motherboard model number 00W9X3 00D2887
BIOS name and version Dell 0.3.38 IBM VVE120CUS-1.20
BIOS settings Default Default
Memory module(s)
Total RAM in system (GB) 64 64
Vendor and model number Hynix® HMT31GR7BFR4A-H9 Samsung® M393B1K70CH0-YH9
Type PC3L-10600R PC3L-10600R
Speed (MHz) 1,333 1,333
Speed running in the system (MHz) 1,333 1,333
Timing/Latency (tCL-tRCD-tRP-
tRASmin)
9-9-9-36 9-9-9-27
Size (GB) 8 8
Number of RAM modules 8 8
13. A Principled Technologies test report 13Server power management comparison: Dell OpenManage Power
Center and IBM Systems Director Active Energy Manager
System Dell PowerEdge R720 IBM System x3650 M4
Chip organization Double-sided Double-sided
Rank Dual Dual
Operating system
Name Microsoft® Windows® Server 2008 R2 Microsoft Windows Server 2008 R2
Build number 7601 7601
File system NTFS NTFS
Language English English
Graphics
Vendor and model number Matrox® G200e Matrox G200eR2
Driver Matrox 2.4.1.0 Matrox 2.4.1.0
RAID controller
Vendor and model number PERC H710P Mini IBM ServeRAID M5110e
Firmware version 3.130.05-1311 23.7.0-0029
Driver version Dell 5.1.90.64 LSI 5.2.127.64
Cache size 1 GB 1 GB
Hard drive # 1
Vendor and model number Seagate® ST9300605SS IBM System X MBF2300RC
Number of disks in system 2 2
Size (GB) 300 300
Buffer size (MB) 64 16
RPM 10,000 10,000
Type SAS SAS
Hard drive # 2
Vendor and model number Pliant® LB 150S Pliant LB 150S
Number of disks in system 2 2
Size (GB) 150 150
Buffer size (MB) N/A N/A
RPM N/A N/A
Type SAS SAS
Ethernet adapters
Vendor and model number Intel I350 Gigabit Controller Intel I350 Gigabit Controller
Type Integrated Integrated
Driver Intel 11.14.42.0 Intel 11.14.48.0
Optical drive(s)
Vendor and model number TEAC DV-28SW TEAC DV-28SW
Type DVD-ROM DVD-ROM
USB ports
Number 4 external, 1 internal 6 external, 2 internal
Type 2.0 2.0
Figure 8: System configuration information for the test servers.
14. A Principled Technologies test report 14Server power management comparison: Dell OpenManage Power
Center and IBM Systems Director Active Energy Manager
APPENDIX B – CONFIGURING POWER-LIMITING SOFTWARE
For testing, we used Dell OpenManage Power Center version 1.0.2.7253 to control the Dell PowerEdge R720
server. OpenManage communicated with the PowerEdge R720 through the onboard iDRAC 7 Enterprise variant, running
software version 1.20.20. We used the isolated management port for iDRAC communication.
Installing Dell OpenManage Power Center
We installed OpenManage on a Dell PowerEdge 2950 III with dual Intel Xeon processors E5405 and 16 GB of
system memory. We used the default options for the OpenManage installation as the installation document outlined.
After installation, we used the Discovery option to locate and configure our test servers.
Setting the power limit for Dell OpenManage Power Center
1. Select the server or rack as needed for testing.
2. Click the Policies tab.
3. Click the Create New Policy button to create a power limit.
4. Enter the desired limit in the Power Cap Value box.
5. Click Next through the remaining wizard windows.
6. After creating the limit, use the Enable/Disable button on the Policies tab to enable or disable the power limit.
7. Click the Emergency Power Reduction button on the same page to enable EPR for testing.
Installing IBM System Director and Active Energy Manager
For the IBM System Director and Active Energy Manager installation, we installed IBM System Director 6.3.1.1
on an IBM System x3850 M2 with dual Intel Xeon processors E7210 and 32 GB of system memory. This system acted as
the management server for all System Director and Active Energy Manager tasks and the installed version of System
Director includes IBM Active Energy Manager 4.4.1. We installed IBM System Director with default installation options,
as the installation documentation outlined. We followed the Pre-installation Worksheet prior to the main installation to
ensure proper configuration.
IBM Active Energy Manager communicated with the IBM System x3650 M4 through the Integrated Management
Module (IMM) 2 management port. Our test systems used an IMM2 Advanced license and firmware version 1.65. We
used the Discovery Manager option from the Home menu in IBM System Director to discover the IBM System x3650 M4
system.
Setting the power limit for IBM Active Energy Manager
1. From the Home menu, select Discovery Manager and collect inventory for the target system.
2. From the Home menu, select Active Energy Manager. This brings up the Active Energy Manager menu.
3. Under Manage, select Work with power policies. This brings up the Power Policies menu.
4. Under Target Resources select Browse, then Active Energy Managed Resources, and then select the target
system.
5. Click Add, and click OK.
6. Click Create policy, name the policy, and click Next.
7. Select System power capping, and click Next.
8. Select Activate Power Capping, Input Power Cap, Absolute value, input the value of the cap in watts, and click
Next twice to complete policy creation.
9. To apply the power cap, check the box next to the desired power policy, and click Apply.
10. Select Run Now, and click OK.
11. To remove this cap, click the cap name from the Power Policies page, select Targets, check the box next to the
target system, and click Remove.
15. A Principled Technologies test report 15Server power management comparison: Dell OpenManage Power
Center and IBM Systems Director Active Energy Manager
APPENDIX C – DATABASE WORKLOAD
To build the workload, we used DVD Store Version 2.1 (DS2), an open-source simulation of an online e-
commerce DVD store. DS2 has database components and Web server components, and includes driver programs that
place heavy loads on these components. A new feature of DVD Store Version 2.1 uses the ability to target multiple
databases from one source client. We used this functionality to record the orders per minute output from each specific
database target.
The Dell PowerEdge R720 and IBM System x3650 M4 ran four Microsoft SQL Server 2008 R2 instances, with two
6GB databases per instance for the 100 percent processor utilization testing.
The main DS2 metric is orders per minute, which the driver program calculates and records to a text file on the
client machines. The DVD Store client application outputs OPM at 10-second intervals. We ran this workload on the
server for 30 minutes and report the last OPM score the benchmark reported.
A DS2 order consists of a customer login; a search for movies by title, actor, or category; and a purchase. The
workload also performs other actions, such as adding new customers, to exercise a wide range of database functions.
As we note above, because our goal was to isolate and test database server performance, we did not use the
front-end Web client component of DS2. Instead, we ran a compiled driver on client machines via its command-line
interface. We used the default DS2 parameters and setup configuration, with the exceptions we note in the Setting up
DVD Store version 2.1 sections below.
We used eight client machines with one client connecting to each of the eight databases. Each client machine
ran a single instance of DS2, with 16 threads to simulate a heavily loaded environment; the load-generating client
machines used a 5 percent new customer setting and ran with no think time, processing requests as quickly as the
servers were able.
For more details about the DS2 tool, see http://www.delltechcenter.com/page/DVD+Store.
Setting up the servers for DVD Store
Our DVD Store test bed consisted of a Dell PowerEdge R720 or IBM System x3650 M4 as the server under test
and eight Intel-based clients. Each client had an Intel Pentium 4 3.00GHz processor, 1 GB of system memory, and a
Gigabit network card in default configurations. We connected the systems via one Gigabit network switch. We installed
a fresh copy of Windows Server 2008 R2 Enterprise Edition on the server.
Installing Windows Server 2008 R2 Enterprise Edition
1. Boot the server, and insert the Windows Server 2008 R2 installation DVD in the DVD-ROM drive.
2. At the Language Selection screen, click Next.
3. Click Install Now.
4. Select Windows Server 2008 R2 Enterprise (Full Installation), and click Next.
5. Click the I accept the license terms check box, and click Next.
6. Click Custom.
7. At the Where to Install Windows screen, click Drive options (advanced).
8. Ensure you select the proper drive, and click New.
9. Enter the partition size, and click Apply. (We used the entire disk.)
10. At the pop-up informing you Windows will create additional partitions, click OK.
11. At the Where to Install Windows screen, click Next.
12. At the User’s password must be changed before logging on warning screen, click OK.
16. A Principled Technologies test report 16Server power management comparison: Dell OpenManage Power
Center and IBM Systems Director Active Energy Manager
13. Enter a password as the new password in both fields, and click the arrow to continue.
14. At the Your password has been changed screen, click OK.
Setting up the network configuration on the server
1. Click StartControl PanelNetwork and InternetNetwork and Sharing Center, and click Change Adapter
Settings.
2. Right-click on the network adapter, and select Properties from the drop-down menu.
3. Select Internet Protocol Version 4 (TCP/IPv4), and click Properties.
4. At the Internet Protocol Version 4 (TCP/IPv4) Properties screen, select the Use the following IP address radio
button.
5. Enter a valid static IP address, subnet mask, and default gateway.
6. Click OK to close the window.
7. At the Local Area Connection Properties window, click Close.
8. Close the Network Connection window.
Installing system updates in Windows Server 2008 R2
We installed all critical updates on the server using the Windows Update feature.
Installing SQL Server 2008 R2 on the server
1. Insert the installation DVD for SQL Server 2008 R2 into the DVD drive.
2. If Autoplay does not begin the installation, navigate to the SQL Server 2008 DVD, and double-click.
3. If prompted with a .NET installation prompt, click OK to enable the .NET Framework Core role.
4. At the SQL Server Installation Center screen, click Installation.
5. Click New installation or add features to an existing installation.
6. At the Setup Support Rules screen, click OK.
7. At the Product Key screen, specify the free Enterprise Edition evaluation, and click Next.
8. At the License Terms screen, accept the license terms, and click Next.
9. At the Setup Support Files screen, click Install.
10. At the Setup Support Rules screen, click Next.
11. At the Setup Role screen, choose SQL Server Feature Installation, and click Next.
12. At the SQL Server 2008 R2 Feature Selection screen, select the following features: Database Engine Services,
Full-Text Search, Client Tools Connectivity, Client Tools Backwards Compatibility, Management Tools – Basic,
Management Tools – Complete; and click Next.
13. At the Installation Rules screen, click Next.
14. At the Instance Configuration screen, leave the defaults, and click Next.
15. At the Disk Space Requirements screen, click Next.
16. At the Server Configuration screen, change SQL Server Agent and SQL Server Database Engine to NT
AUTHORITYSYSTEM, and click Next.
17. At the Database Engine Configuration screen, select Mixed Mode, fill in a password for the system administrator
(sa) account, click Add Current User, and click Next.
18. At the Error Reporting screen, click Next.
19. At the Installation Configuration Rules screen, click Next.
20. At the Installation screen, click Install.
21. At the Complete screen, click Close.
22. Important: Repeat the installation process three more times to create four total instances of SQL Server 2008
R2.
23. Install SQL Server 2008 R2 Service Pack 1, and patch all instances.
17. A Principled Technologies test report 17Server power management comparison: Dell OpenManage Power
Center and IBM Systems Director Active Energy Manager
Configuring SQL Server 2008 R2
After installing SQL Server 2008 R2, we enabled the SQL Server Browser and TCP/IP. We followed this process
for these configurations:
1. Click StartAdministrative ToolsServices.
2. In the right pane, right-click SQL Server Browser, and select Properties from the drop-down menu.
3. At the Startup type drop-down menu, select Automatic, and click OK.
4. Close the Services window.
5. Click StartAll ProgramsMicrosoft SQL Server 2008 R2Configuration ToolsSQL Server Configuration
Manager.
6. In the left pane, select SQL Server Services.
7. In the right pane, right-click SQL Server Browser, and select Start from the drop-down menu.
8. In the left pane, expand SQL Server Network Configuration, and select Protocols for MSSQLSERVER (where
MSSQLSERVER is the name of the first SQL Server instance).
9. In the right pane, right-click TCP/IP, and select Enable from the drop-down menu.
10. Repeat Step 9 for the remaining three SQL Server instances.
11. In the left pane, select SQL Server Services.
12. In the right pane, right-click SQL Server (MSSQLSERVER), and select Restart from the drop-down menu.
13. Repeat step 12 for the remaining three SQL Server instances.
Installing and configuring the database clients
For the DS2 scripts, we used eight clients to simulate a number of users putting a load on the server. Each client
server had a single drive on which we installed a fresh copy of Windows Server 2003 R2 Enterprise Edition. We installed
the .NET 3.5 SP1 framework on each client, as the DS2 test executable requires at least .NET2.0. After the installation,
we created two folders on the server, one for each client instance, to store the DS2 executable. We followed this
process for each installation:
1. Install Microsoft Windows Server 2003 R2 Enterprise Edition with Service Pack 2 on the client.
2. Assign a computer name of Clientx for the database client, where x is the client number.
3. For the licensing mode, use the default setting of five concurrent connections.
4. Enter a password for the administrator logon.
5. Select Eastern Time Zone.
6. Use typical settings for the Network installation.
7. Type Workgroup for the workgroup.
8. Install Windows Updates, .NET 3.5 SP1 framework, and copy the DVD Store client executable into each of the
two folders.
Creating scripts on the database clients
To simplify testing, we created batch files named test.bat on all eight clients to start the DVD Store executable
with the correct parameters. We put the batch files on the clients: c:clientshare. The batch files in c:clientshare on four
of the clients contained the text below. The batch files on the other four clients contained the same text, but the driver
pointed to the different database with –database_name=ds2-1.
c:clientshareds2sqlserverdriver.exe --target=192.168.2.120 --ramp_rate=10 --
run_time=30 --n_threads=16 --db_size=6GB --think_time=0 --database_name=ds2 --
detailed_view=Y --warmup_time=1 --pct_newcustomers=5 --
output_path=c:clientshareopmoutds2.txt
18. A Principled Technologies test report 18Server power management comparison: Dell OpenManage Power
Center and IBM Systems Director Active Energy Manager
Setting up DVD Store version 2.1
Data generation overview
We generated the data using the Install.pl script included with DVD Store version 2.1, providing the parameters
for our 6GB database size and the database platform on which we ran - Microsoft SQL Server. We ran the Install.pl script
on a utility system running Linux. The Install.pl script also generated the database schema.
After processing the data generation, we transferred the data files and schema creation files to a Windows-
based system running SQL Server 2008 R2 SP1. We built the 6GB database in SQL Server 2008 R2 SP1, and then
performed a full backup, storing the backup file on the C: drive for quick access. We used that backup file to restore on
the server between test runs.
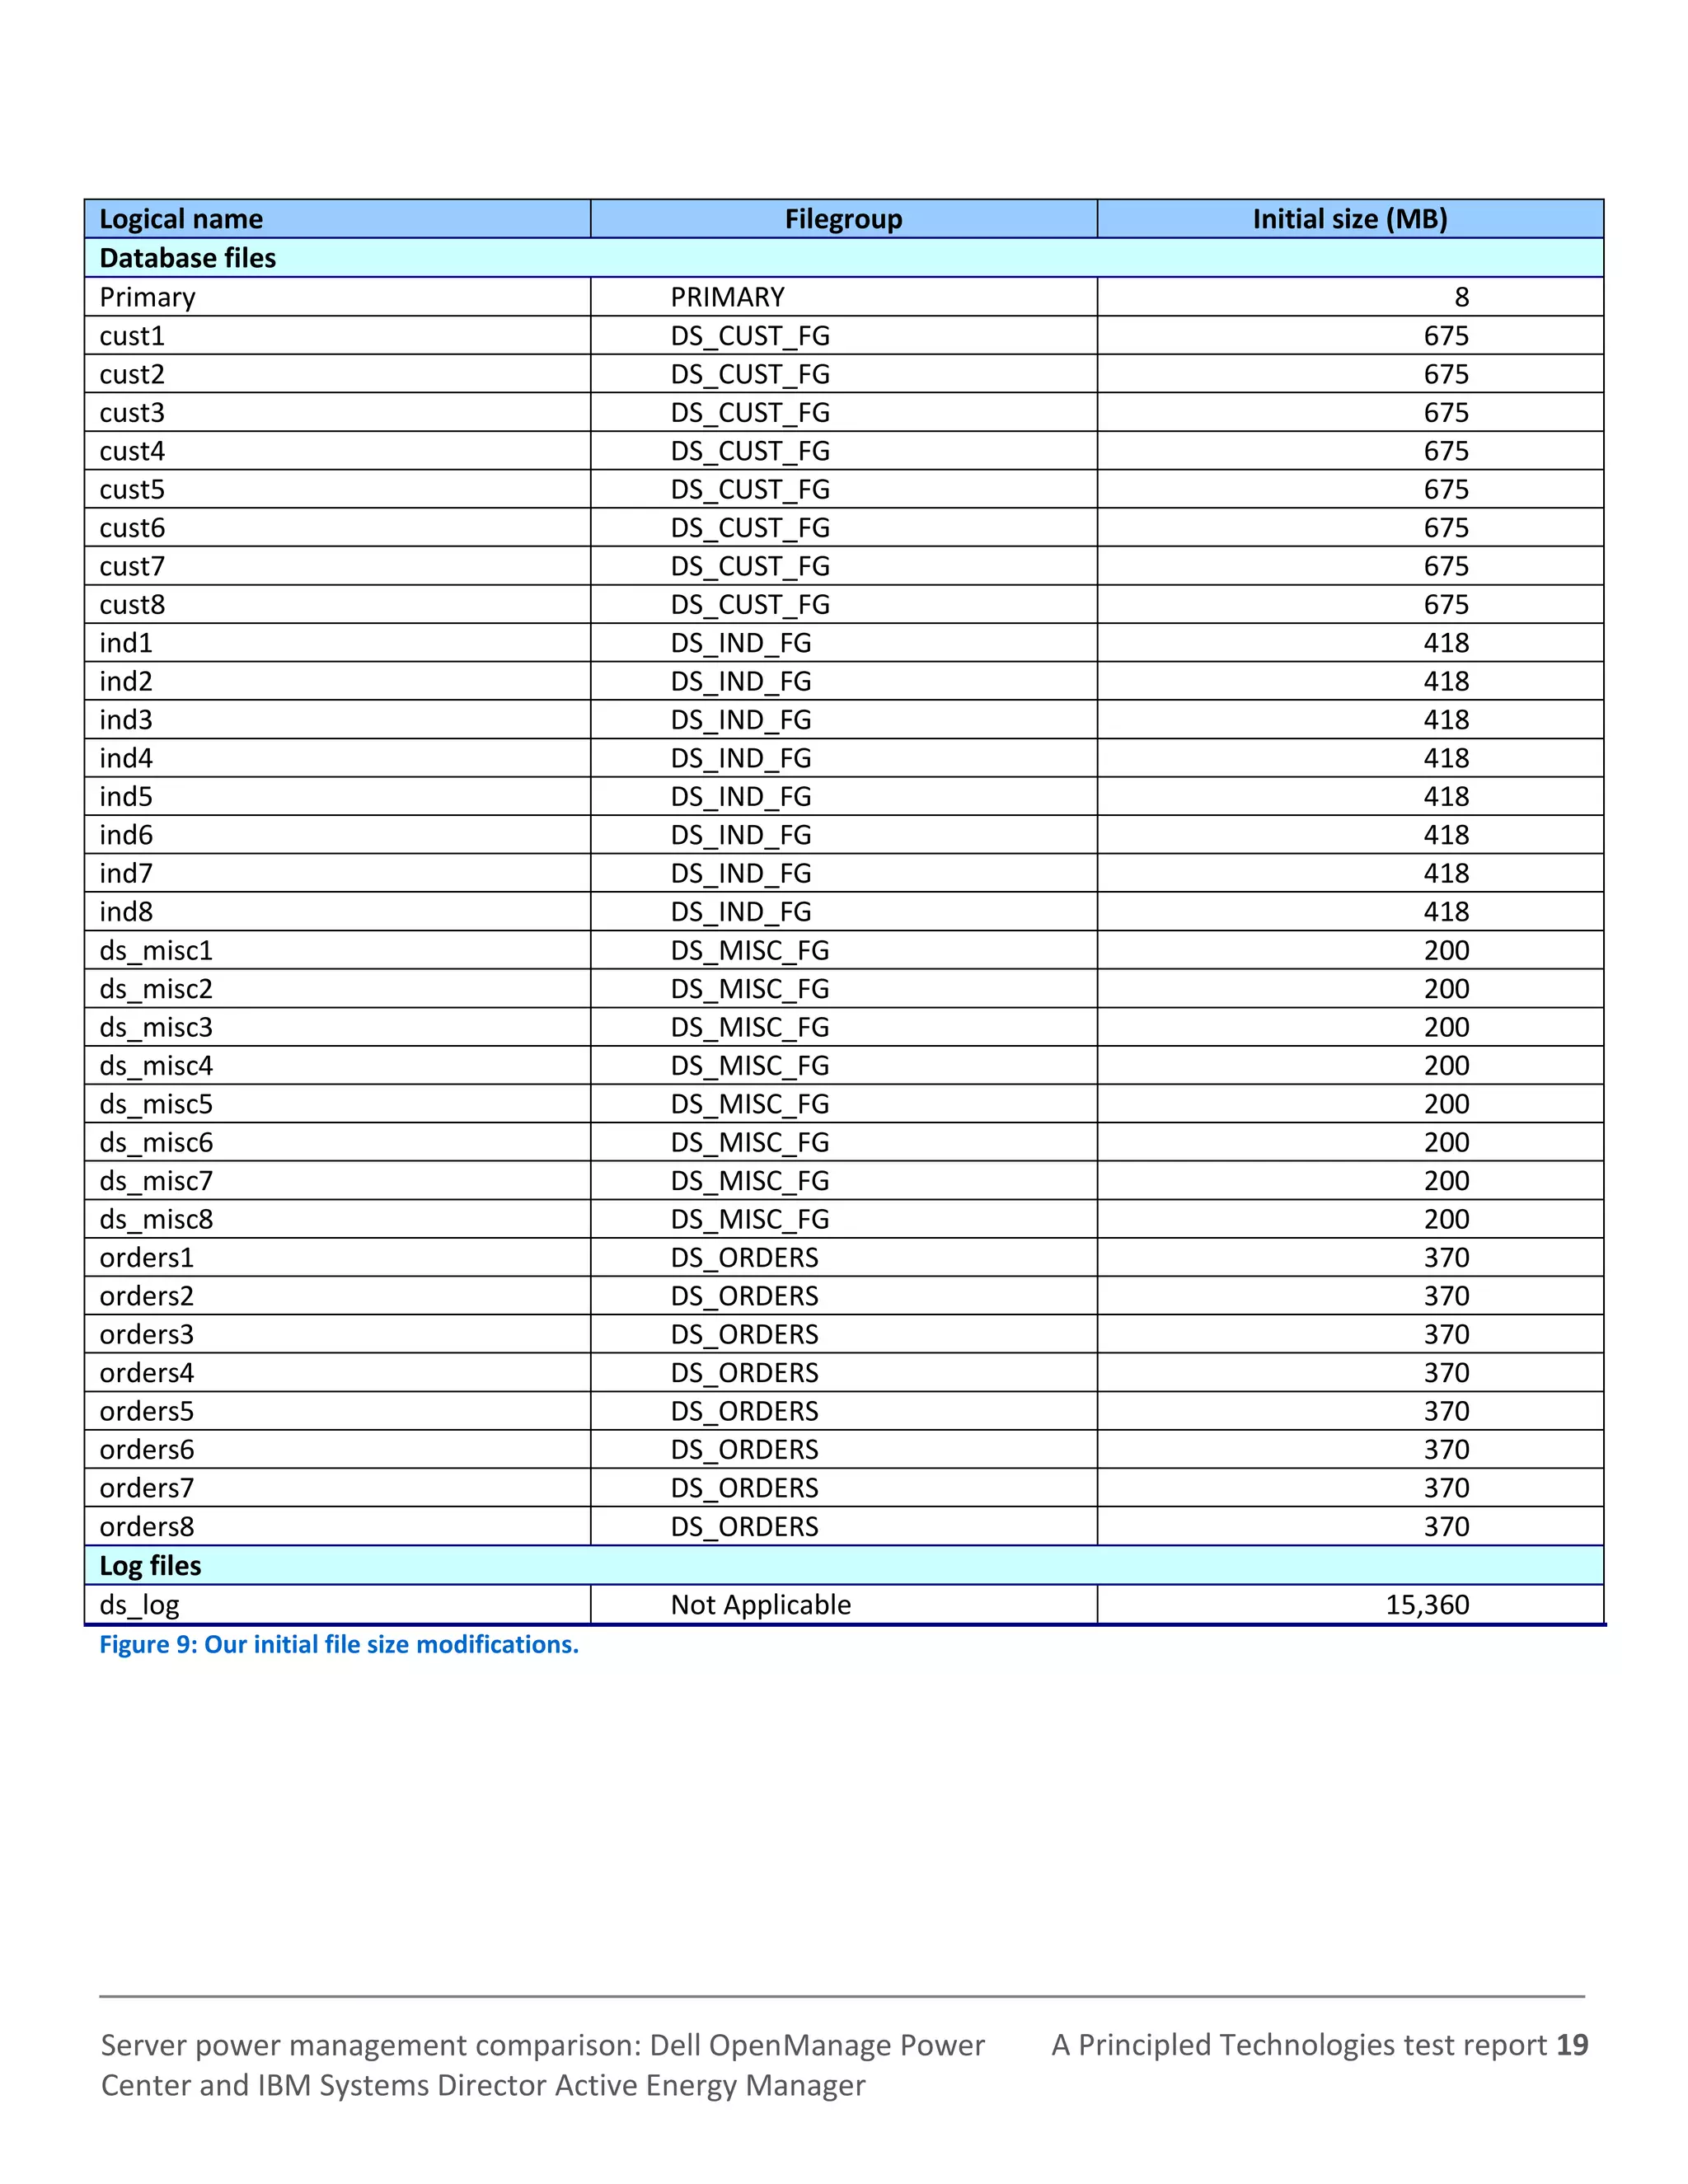
The only modification we made to the schema creation scripts were the specified file sizes for our database. We
deliberately set the file sizes higher than necessary to ensure that no file-growth activity would affect the outputs of the
test. Besides this file size modification, the database schema was created and loaded according to the DVD Store
documentation. Specifically, we followed the steps below:
1. We generated the data and created the database and file structure using database creation scripts in the DS2
download. We made size modifications specific to our 6GB database and the appropriate changes to drive
letters.
2. We transferred the files from our Linux data generation system to a Windows system running SQL Server.
3. We created database tables, stored procedures, and objects using the provided DVD Store scripts.
4. We set the database recovery model to bulk-logged to prevent excess logging.
5. We loaded the data we generated into the database. For data loading, we used the import wizard in SQL Server
Management Studio. Where necessary, we retained options from the original scripts, such as Enable Identity
Insert.
6. We created indices, full-text catalogs, primary keys, and foreign keys using the database-creation scripts.
7. We updated statistics on each table according to database-creation scripts, which sample 18 percent of the
table data.
8. On the SQL Server instance, we created a ds2user SQL Server login using the following Transact SQL (TSQL)
script:
USE [master]
GO
CREATE LOGIN [ds2user] WITH PASSWORD=N’’,
DEFAULT_DATABASE=[master],
DEFAULT_LANGUAGE=[us_english],
CHECK_EXPIRATION=OFF,
CHECK_POLICY=OFF
GO
9. We set the database recovery model back to full.
10. We created the necessary full text index using SQL Server Management Studio.
11. We created a database user and mapped this user to the SQL Server login.
12. We then performed a full backup of the database. This backup allowed us to restore the databases to a pristine
state relatively quickly between tests.
Figure 9 shows our initial file size modifications.
20. A Principled Technologies test report 20Server power management comparison: Dell OpenManage Power
Center and IBM Systems Director Active Energy Manager
Editing the workload script – ds2xdriver.cs module
A new feature of DVD Store version 2.1 is the ability to target multiple targets from one source client. We used
this functionality. In order to record the orders per minute output from each specific database target, we modified the
ds2xdriver to output this information to log files on each client system. To do this, we used the StreamWriter method to
create a new text file on the client system, and the WriteLine and Flush methods to write the relevant outputs to the
files during the tests. We also added the capabilities to target differently named databases.
After making these changes, we recompiled the ds2xdriver.cs and ds2sqlserverfns.cs module in Windows by
following the instructions in the DVD Store documentation. Because the DS2 instructions were for compiling from the
command line, we used the following steps on a system with Visual Studio installed:
1. Open a command prompt.
2. Use the cd command to change to the directory containing our sources.
3. Execute the following command:
csc /out:ds2sqlserverdriver.exe ds2xdriver.cs ds2sqlserverfns.cs
/d:USE_WIN32_TIMER /d:GEN_PERF_CTRS
Setting up disk drives for the database
We installed two Pliant LB 150S SSD drives in both servers for the database and log files. We configured the
drives as two individual disks and named them volume1 (E:) and volume2 (F:). We put the database and logs on different
volumes. For example, the database 1 files were on volume1 and the log files were on volume2. We reversed this for the
next database, so database 2 files were on volume2 and the log files were on volume1. We repeated these steps for the
remaining database instances. This setup ensured equal disk activity on both RAID volumes.
21. A Principled Technologies test report 21Server power management comparison: Dell OpenManage Power
Center and IBM Systems Director Active Energy Manager
APPENDIX D – JAVA WORKLOAD
SPECjbb2005 configuration
We used SPECjbb2005 version 1.07, dated March 15, 2006. We followed SPEC’s run rules. (For more information
about SPECjbb2005 and its run rules, see http://www.spec.org/jbb2005/docs/RunRules.html.) We installed SPECjbb2005
by copying the contents of the SPECjbb2005 CD to the directory C:SPECjbb2005v1.07 on the server’s hard disk.
SPECjbb2005 requires a Java Virtual Machine on the system under test. We used Java HotSpot 64-bit Server VM
(build 20.6-b01 for this testing and left the default installation settings.
For an official SPECjbb2005 run, as per the run rules, the end user should edit the SPECjbb_config.props file in
the root SPECjbb2005 directory to include disclosure information about the server and our license information. We did
not do this step, as our goal was to create a server load and not produce actual SPECjbb2005 results. We modified the
SPECjbb.props file to change the number of JVM instances to two. This change allows a server to run two JVM instances
during testing.
We created a batch file, which we placed in the root SPECjbb2005 directory, to issue the Java run command to
launch the benchmark. During testing, we used the command prompt window within Microsoft Windows Server 2008
R2 Enterprise Edition to run this batch file. The contents of this file are shown below.
@echo off
set path="C:Javabin";%path%
set JVM=2
:: Set JAVA_HOME to Java.exe path.
set JAVA_HOME="C:Javabin"
:stage1
set PROPFILE=SPECjbb.props
set JAVAOPTIONS= -Xms512m -Xmx512m
rem set JBBJARS=.jbb.jar;.check.jar
set JBBJARS=.jbb.jar;.jbb_no_precompile.jar;.check.jar;.reporter.jar
set CLASSPATH=%JBBJARS%;%CLASSPATH%
:stage2
echo Using CLASSPATH entries:
for %%c in ( %CLASSPATH% ) do echo %%c
@echo on
start /b C:Javabinjava.exe %JAVAOPTIONS% spec.jbb.Controller -propfile
%PROPFILE%
@echo off
set I=0
:LOOP
set /a I=%I + 1
echo.
echo Starting JVM Number %I% with Affinity to CPU %J%
echo.
@echo on
start /B C:Javabinjava.exe -Xmx18g -Xms18g -Xmn16g -XX:SurvivorRatio=60 -
XX:TargetSurvivorRatio=90 -XX:ParallelGCThreads=8 -
22. A Principled Technologies test report 22Server power management comparison: Dell OpenManage Power
Center and IBM Systems Director Active Energy Manager
XX:AllocatePrefetchDistance=192 -XX:AllocatePrefetchLines=4 -
XX:LoopUnrollLimit=45 -XX:InitialTenuringThreshold=12 -XX:MaxTenuringThreshold=15
-XX:InlineSmallCode=5500 -XX:MaxInlineSize=220 -XX:FreqInlineSize=2500 -
XX:+UseLargePages -XX:+UseParallelOldGC -XX:+UseCompressedStrings -verbose:class
-XX:+AggressiveOpts spec.jbb.JBBmain -propfile %PROPFILE% -id %I% > multi.%I%
@echo off
IF %I% == %JVM% GOTO END
GOTO LOOP
:END
23. A Principled Technologies test report 23Server power management comparison: Dell OpenManage Power
Center and IBM Systems Director Active Energy Manager
APPENDIX E – MEASURING POWER
Measuring workload power
To record each server’s power consumption during the workload test, we used an Extech Instruments®
(www.extech.com) 380803 Power Analyzer/Datalogger. We connected the power cord from the server under test to the
Power Analyzer’s output load power outlet. We then plugged the power cord from the Power Analyzer’s input voltage
connection into a 120-volt power outlet.
We used the Power Analyzer’s Data Acquisition Software (version 2.11) to capture all recordings. We installed
the software on a separate Intel processor-based PC, which we connected to the Power Analyzer via an RS-232 cable.
We captured power consumption at one-second intervals.
To gauge the power usage with no OS activity, we recorded the power usage for 2 minutes while each server
was running the operating system but no applications running.
We then recorded the power usage (in watts) for each server during the testing at one-second intervals. To
compute the average power usage, we averaged the power usage during the time the server was producing its peak
performance results. We call this time the power measurement interval.
Measuring response time power
To record the power limit response time, we used a Yokogawa® WT210 with WTViewer 8.11 software. We
connected a power strip to the Yokogawa WT210 and recorded the Dell PowerEdge R720 server using a 120-volt supply
voltage. We connected the WT210 to a desktop via an RS-232 cable. We set the recording time intervals to 100ms inside
WTViewer. Note: WTViewer records data at a minimum interval of 200ms due to the RS-232 interface.
24. A Principled Technologies test report 24Server power management comparison: Dell OpenManage Power
Center and IBM Systems Director Active Energy Manager
ABOUT PRINCIPLED TECHNOLOGIES
Principled Technologies, Inc.
1007 Slater Road, Suite 300
Durham, NC, 27703
www.principledtechnologies.com
We provide industry-leading technology assessment and fact-based marketing
services. We bring to every assignment extensive experience with and expertise
in all aspects of technology testing and analysis, from researching new
technologies, to developing new methodologies, to testing with existing and new
tools.
When the assessment is complete, we know how to present the results to a
broad range of target audiences. We provide our clients with the materials they
need, from market-focused data to use in their own collateral to custom sales
aids, such as test reports, performance assessments, and white papers. Every
document reflects the results of our trusted independent analysis.
We provide customized services that focus on our clients’ individual
requirements. Whether the technology involves hardware, software, Web sites,
or services, we offer the experience, expertise, and tools to help our clients
assess how it will fare against its competition, its performance, its market
readiness, and its quality and reliability.
Our founders, Mark L. Van Name and Bill Catchings, have worked together in
technology assessment for over 20 years. As journalists, they published over a
thousand articles on a wide array of technology subjects. They created and led
the Ziff-Davis Benchmark Operation, which developed such industry-standard
benchmarks as Ziff Davis Media’s Winstone and WebBench. They founded and
led eTesting Labs, and after the acquisition of that company by Lionbridge
Technologies were the head and CTO of VeriTest.
Principled Technologies is a registered trademark of Principled Technologies, Inc.
All other product names are the trademarks of their respective owners.
Disclaimer of Warranties; Limitation of Liability:
PRINCIPLED TECHNOLOGIES, INC. HAS MADE REASONABLE EFFORTS TO ENSURE THE ACCURACY AND VALIDITY OF ITS TESTING, HOWEVER,
PRINCIPLED TECHNOLOGIES, INC. SPECIFICALLY DISCLAIMS ANY WARRANTY, EXPRESSED OR IMPLIED, RELATING TO THE TEST RESULTS AND
ANALYSIS, THEIR ACCURACY, COMPLETENESS OR QUALITY, INCLUDING ANY IMPLIED WARRANTY OF FITNESS FOR ANY PARTICULAR PURPOSE.
ALL PERSONS OR ENTITIES RELYING ON THE RESULTS OF ANY TESTING DO SO AT THEIR OWN RISK, AND AGREE THAT PRINCIPLED
TECHNOLOGIES, INC., ITS EMPLOYEES AND ITS SUBCONTRACTORS SHALL HAVE NO LIABILITY WHATSOEVER FROM ANY CLAIM OF LOSS OR
DAMAGE ON ACCOUNT OF ANY ALLEGED ERROR OR DEFECT IN ANY TESTING PROCEDURE OR RESULT.
IN NO EVENT SHALL PRINCIPLED TECHNOLOGIES, INC. BE LIABLE FOR INDIRECT, SPECIAL, INCIDENTAL, OR CONSEQUENTIAL DAMAGES IN
CONNECTION WITH ITS TESTING, EVEN IF ADVISED OF THE POSSIBILITY OF SUCH DAMAGES. IN NO EVENT SHALL PRINCIPLED TECHNOLOGIES,
INC.’S LIABILITY, INCLUDING FOR DIRECT DAMAGES, EXCEED THE AMOUNTS PAID IN CONNECTION WITH PRINCIPLED TECHNOLOGIES, INC.’S
TESTING. CUSTOMER’S SOLE AND EXCLUSIVE REMEDIES ARE AS SET FORTH HEREIN.