This document compares the surface energy balances at three Atmospheric Radiation Measurement sites with different climates: the Black Forest region in Germany, Niamey in Niger, and the Southern Great Plains in Oklahoma. It finds that the Black Forest site had the greatest latent heat flux due to dense vegetation and cloud formation. The Niamey site had the greatest sensible heat flux due to less vegetation and exposed soil, contributing to a warmer, drier climate. The Southern Great Plains site had the greatest net radiation due to longer summer days and sun position. The results help quantify how surface energy balance components vary between climatic regions.

![3
1. Introduction.
Global climate change is and will continue to be a major political and economic
issue. The uncertainty and complexity associated with it makes it a difficult issue to
establish a consensus on a resolution. The greatest uncertainty is how the climate will
change in different regions. While different places have different climates, the building
blocks of climate are the same everywhere.
The sun is the energy source that drives weather and climate. The amount of
solar radiation that passes through the earth’s atmosphere and reaches the surface is
reduced by absorption, scattering, and reflection. These processes are primarily
controlled by cloud amount, aerosol content (atmospheric particulates) and chemical
composition of the atmosphere. How the solar radiation that actually reaches the surface
is used is determined by the Surface Energy Balance (SEB), which is the primary focus
of this research.
Most measurements that have been made of the SEB are only representative of
local scales due to the highly variable nature of the earth’s surface. Therefore these
measurements cannot readily be extended to regional and global levels due to land
surface heterogeneity and the variability of heat transfer processes [1]. The ability to
extend the range to regional and global scales is an imperative for being able to predict
how the climate will change using Global Climate Models (GCMs).
The Atmospheric Radiation Measurement Program (ARM) was established by
the Department of Energy (DOE) to improve GCMs and other climate models [2]. ARM
studies the interaction between clouds and radiative feedback processes in the](https://image.slidesharecdn.com/7111d412-8cc6-4d1e-9781-2edcd516f962-150717190933-lva1-app6891/85/Comparing-Surface-Energy-Balances-for-the-Black-Forest-4-320.jpg)
![4
atmosphere. The purpose of doing so is to better understand how clouds are involved in
climate change [3]. This study analyzed data concerning the surface energy balance
collected by the ARM Climate Research Facility (ACRF), each from a different climatic
region. The results may be useful to help quantify regional differences in the SEB.
1.1 Sites:
All ACRF fixed sites have instrumentation that measures most of the individual
components of the SEB. ACRF also operates a mobile facility (AMF), which typically
moves to a different, climatically significant region each year based on science proposals.
For this study three sites were chosen that represent three very different climate regions;
the Black Forest region in Germany, a desert area in Niger, Africa and the central plains
of Oklahoma.
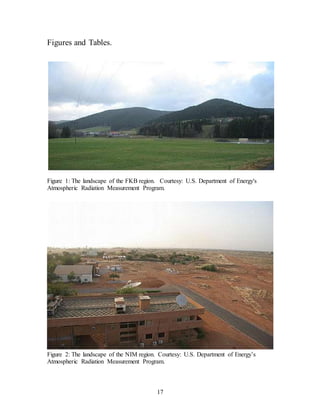
1.1.a Black Forest, Germany (FKB):
The Black Forest region in Germany was chosen as the deployment site for the
AMF in 2006. This deployment was part of the Convective and Orographically Induced
Precipitation Study (COPS), which had the primary goal of improving our ability to
predict orographic precipitation, which is the result of rising convection over
mountainous regions. Data from this study will be useful for determining how clouds
affect climate in regions with complex terrain [4]. The Black Forest region has a mean
terrain height of 1000 m and is dominated by coniferous woodlands and agricultural
areas. The temperature varies during the summer, depending on the region in question
and the humidity is typically high, with convective precipitation [5]. The data being used](https://image.slidesharecdn.com/7111d412-8cc6-4d1e-9781-2edcd516f962-150717190933-lva1-app6891/85/Comparing-Surface-Energy-Balances-for-the-Black-Forest-5-320.jpg)
![5
in this study was collected in a fairly lush valley (see Figure 1) within the Black Forest
region during June 2006.
1.1.b Niamey, Niger (NIM):
Niamey in Niger, Africa was the site for the Radiative Divergence study and the
location of the AMF in 2006. The GERB (Geostationary Earth Radiation Budget), and
AMMA (African Monsoon Multidisciplinary Analysis) Stations (RADAGAST) were
also located in this area. Niger, being located in the Sahara Desert, is one of the hottest
countries in the world, which is a contributing factor to dust storms. The dust particles
from these storms influence the amount of radiation received at the surface and thus
influence climate [6]. Because its normal climate is so hot and dry, there are few trees
and shrubs, which shows the deficiency of nutrients in the soil. AMF data from June
2006 was examined to see how the SEB changes in a hot, dry desert region (see Figure
2).
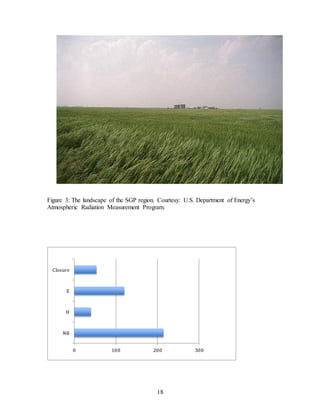
1.1.c Southern Great Plains, Oklahoma (SGP):
The Southern Great Plains (SGP) site was the first ARM field measurement site
and is located in the central Great Plains, encompassing large parts of Kansas and
Oklahoma. It has a generally homogeneous geography and is easily accessible. The
Central Facility (CF) is located on 160 acres of cattle pasture and wheat fields (see Figure
3). The climate is variable with large seasonal variation in temperature and humidity,
different types of cloud formations, and variable surface flux properties [7]. This site](https://image.slidesharecdn.com/7111d412-8cc6-4d1e-9781-2edcd516f962-150717190933-lva1-app6891/85/Comparing-Surface-Energy-Balances-for-the-Black-Forest-6-320.jpg)
![7
sensible, and ground heat flux in a given region is probably the most important
determinant of its microclimate. Latent heat is generally considered the most important
of the three. The dominant role is a result of the availability of moisture for evaporation.
When moisture isn’t as prevalent, the role of sensible heat flux becomes more important.
It is involved with changes in temperature. Ground heat flux is the flow of heat
associated with the changing temperature of the soil. It is a significant hourly energy
source, but over the course of a day, it doesn’t have a significant impact on the
microclimate of a region [8].
2.2 Sensible and LatentHeat Flux:
Half hour measurements of sensible and latent heat flux were taken using the
Eddy Correlation Flux Measurement System (ECOR). The system is located on the north
side of a wheat field at the SGP site [9]. At the FKB sites they were located south of a
mowed grass drainage ditch, south of which are alfalfa crops. At the NIM site they were
located in a rather barren area, mostly bare soil characteristic of the local area. **DO
WE NEED THE FOLLOWING SENTENCES?** Do you have a source for this? I
couldn’t find out where they were. A sonic anemometer, which is a fast-response, three-
dimensional wind sensor, was used at a height of 3 meters to get the wind components
and the speed of sound (to derive air temperature). To obtain the water vapor density and
the CO2 concentration, an open-path infrared gas analyzer was used [9].
2.2 Net Radiation:](https://image.slidesharecdn.com/7111d412-8cc6-4d1e-9781-2edcd516f962-150717190933-lva1-app6891/85/Comparing-Surface-Energy-Balances-for-the-Black-Forest-8-320.jpg)
![8
Solar radiation measurements were taken by pyranometers and longwave or
thermal radiation measurements were taken by pyrgeometers. The SGP site measured the
individual components of the net radiation using a Solar Infrared Radiation Station
(SIRS) system. Data collected from the SIRS were available as 1-minute average values.
At the AMF site in NIM the 4 components of net radiation were measured with a
Ground Radiation Measurement (GRNRAD) system and a Sky Radiation (SKYRAD)
system. SKYRAD collected one-minute data for thermal radiation. GRNRAD was used
for upwelling solar radiation, upwelling thermal radiation, and downwelling thermal
radiation. SKYRAD was used for downwelling solar radiation. All AMF radiation
measurements were also available as 1-minute averages.
GNDRAD and SKYRAD were also used from the FKB site to measure the 4
components of net radiation. GNDRAD was used for upwelling solar and thermal
radiation and SKYRAD was used for downwelling solar and thermal radiation.
2.3 RadarData:
The SGP site uses the Millimeter Wavelength Cloud Radar (MMCR), which
operates at a frequency of 35 GHz, to measure the size and composition of clouds at
millimeter wavelengths. It can also determine cloud boundaries, radar reflectivity up to
20 km high, and cloud constituent vertical velocities [10].
3. Analysis:
The Interactive Data Language (IDL) computer program was used to read data
from the ARM archive. Latent heat flux, sensible heat flux, and radar data were used](https://image.slidesharecdn.com/7111d412-8cc6-4d1e-9781-2edcd516f962-150717190933-lva1-app6891/85/Comparing-Surface-Energy-Balances-for-the-Black-Forest-9-320.jpg)
![9
from the SGP, NIM, and FKB sites. Net radiation was also used, but it needed to be
calculated using multiple instruments that measured downwelling solar, up-welling solar,
down-welling thermal, and upwelling thermal radiation. Daily averages of these variables
were used to analyze how precipitation and cloud cover affected the SEB. To analyze
climate, which is the meteorological conditions over the course of an extended period of
time, monthly average data for June 2006 and 2007 were used. Due to persistent
measurement errors in the night time latent heat flux, the early morning and late night
data were disregarded from this study. This did not affect the results because major SEB
changes happen during after the sun rises and before it sets.
3.1 Sensible and LatentHeat Flux:
The ECOR data were processed and averaged by a computer every half hour. The
eddy covariance technique was used to obtain the fluxes. This involved correlating the
vertical wind component with the horizontal component, the air temperature, the water
vapor density, and the CO2 concentration [9]. Expected measurement uncertainties for
sensible and latent heat fluxes were 6% and 5% respectively. Sensible heat flux is
typically underestimated due to the slope of the temperature sensor differing from 1:1.
Flux shortfalls of 10-25% have been seen, with 35% being less common. This typically
happens because the eddy covariance technique does not take into account energy storage
in vegetation canopies, the sonic anemometer cannot measure the lowest frequency
components of flux, and unstable conditions in the atmosphere (like shifts in wind
direction and precipitation) make it difficult to calculate covariances [9].](https://image.slidesharecdn.com/7111d412-8cc6-4d1e-9781-2edcd516f962-150717190933-lva1-app6891/85/Comparing-Surface-Energy-Balances-for-the-Black-Forest-10-320.jpg)
![10
3.2 Net Radiation:
Net radiation was measured as 1 minute averages. In order to coincide with the
other components of the SEB, 30 minute averages were calculated. The components
were then used to calculate the 30 minute SEB averages. Daily and monthly SEB
averages were calculated afterwards, the latter being more representative of climate than
the former.
3.2.a SIRS:
Estimated measurement uncertainty associated with: downwelling solar radiation
was expected to be 6.0%, upwelling solar radiation was expected to be 6.0%, and
upwelling thermal radiation was expected to be 2.5% [11]. Like the ECOR system, the
SIRS system does not take into account the energy stored in vegetation canopies [9].
3.2.b SKYRAD:
Estimated measurement uncertainty associated with: downwelling solar radiation
was expected to be 6.0% and downwelling thermal radiation was expected to be 2.5%
[12].
GNDRAD:
Estimated measurement uncertainty associated with: upwelling solar radiation
was expected to be 6.0% and upwelling thermal was expected to be 2.5%. The angular
response of a pyranometer is a major contributor to the estimated measurement
uncertainty for solar radiation [13].](https://image.slidesharecdn.com/7111d412-8cc6-4d1e-9781-2edcd516f962-150717190933-lva1-app6891/85/Comparing-Surface-Energy-Balances-for-the-Black-Forest-11-320.jpg)
![11
3.3 RadarData:
MMCR:
Expected uncertainty for reflectivity was .5 dB and .1 m/s for mean Doppler
velocity [10].
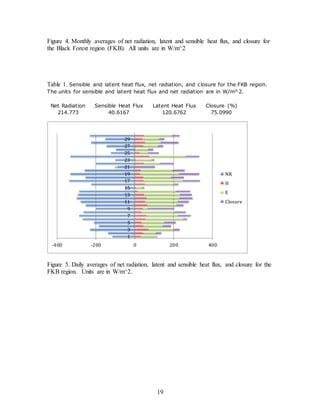
4. Results and Discussion:
A summary of the results or the SEB analysis from FKB are shown in Figure 4
and Table 1. They show that the majority of the SEB for FKB was the latent heat flux
(120.6762 Wm-2) as opposed to sensible heat flux (40.6167 Wm-2). This was the result of
extensive cloud cover and precipitation at the site which was measured by the radar (not
shown). The decreased amount of net radiation shown in Figure 5 on the 15th, 21st, 23rd,
and 25th-27th supports the argument that there was more cloud cover absorbing solar
radiation.
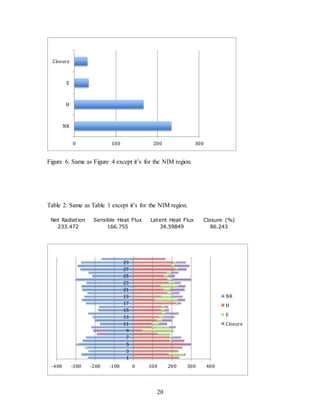
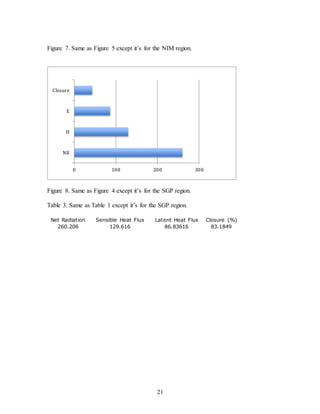
The SEB results for NIM are shown in Figure 6 and Table 2. They indicate that
the major portion of the SEB for NIM was sensible heat flux (H) except for the 9th and
the 18th (as shown in Figure 7). Niamey’s climate is usually hot and dry [6], and the
abundance of H and the small amount of latent heat that were found (Figure 7) supports
it. Latent heat was significantly less at the NIM site than the FKB site which is to be
expected in a hot and dry climate region. The low latent heat flux was because of the dry
soil and the lack of abundant vegetation, which contributed to the much larger latent heat
in the FKB region.
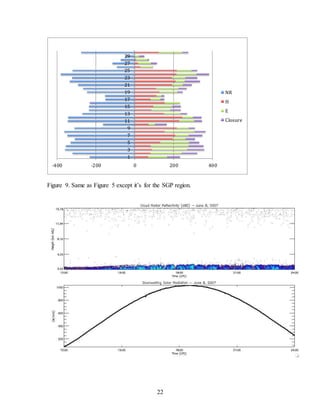
The shortages of net radiation of the SGP region on the 10th, 17th, 18th, and from
the 26th to the 29th were the results of increased cloud cover and precipitation as indicated](https://image.slidesharecdn.com/7111d412-8cc6-4d1e-9781-2edcd516f962-150717190933-lva1-app6891/85/Comparing-Surface-Energy-Balances-for-the-Black-Forest-12-320.jpg)
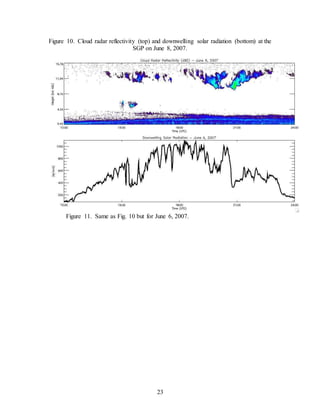
![12
in the radar data (not shown). Figures 10 and 11 demonstrate how cloud cover influences
net radiation. The top panels of both figures are radar reflectivity from the MMCR. The
lower panels are downwelling solar radiation measured at the surface by the SIRS located
near the MMCR. The radar signals near the surface are not clouds, but signals from
insects [14]. June 8th was a nearly cloudless day, indicated by the absence of radar signal.
The corresponding SIRS data shows a clean signal, with the net radiation increasing
steadily as the day progresses. June 6th on the other hand had a significant number of
clouds as demonstrated by the radar reflectivity (Figure 11). The influence of clouds on
the radiation reaching the surface is significant and can be clearly seen in the SIRS data
(Figure 11). The mean solar radiation on June 8th was 350 Wm-2 and only 290 Wm-2 on
June 6. Even though figure 9 shows that SGP had a few rainy days, figure 8 shows that it
had the most net radiation on average for the month of June. During the summer, the tilt
of the Earth increases day length, which means the SGP and FKB regions get more net
radiation than NIM. Since the FKB region has lush vegetation that contributes to the
increased latent heat flux of the region, cloud cover diminishes the amount of net
radiation that reaches the surface [15].
Closure of the SEB is a tool used to measure the how accurately the components
of the SEB were measured and is defined as:
RN – H – E – G = 0
Instrument error, surface heterogeneity, and fetch can affect SEB measurements and
therefore the magnitude of closure [16]. Closure for this study was affected by these
errors and by the lack of data concerning the ground heat flux. Our values were close to
those found in other studies [16], so the results of this study are reliable and](https://image.slidesharecdn.com/7111d412-8cc6-4d1e-9781-2edcd516f962-150717190933-lva1-app6891/85/Comparing-Surface-Energy-Balances-for-the-Black-Forest-13-320.jpg)
![13
representative of the local climates. Comparison of closure of the SEB at each site
indicates the lowest values of closure (best measure of the SEB) are where latent heat
flux is lowest. Latent heat is generally the measurement with the most uncertainty [16].
Therefore in general the measurements of the SEB have the highest accuracy at NIM
(86.243% closure) with more uncertainty at the SGP (83.1849%) and FKB (75.0990%)
sites.
5. Conclusion.
The uncertainties associated with climate change prevent considerable action
from being taken to diminish the possible effects it will have on the future. Predicting
changes in climate is difficult because climates vary from region to region. By analyzing
the SEB at the FKB, NIM, and SGP sites, this study found that the SEBs varied
significantly for each region and that the climates of the regions reflected the SEBs.
Continued monitoring and analyzing of SEBs in various regions over extended periods of
time would improve global climate models, which would help predictions of the effects
of climate change.
Acknowledgements:
This research was done at Argonne National Laboratory from May 27th until
August 1st 2008. I would like to thank Brad Orr for his supervision of the research and
his revisions to this paper. I would also like to thank Rachel Dearing for her help with
the research. I would like to thank the Atmospheric Radiation Measurement Program for
the use of their data. Finally, I would like to thank the Department of Energy, Office of](https://image.slidesharecdn.com/7111d412-8cc6-4d1e-9781-2edcd516f962-150717190933-lva1-app6891/85/Comparing-Surface-Energy-Balances-for-the-Black-Forest-14-320.jpg)

![15
Literature Cited:
[1] Z. Su. (2002). The Surface Energy Balance System (SEBS) for estimation of
turbulent heat fluxes. Hydrology and Earth System Sciences. [Online]. 6(1), pp. 85-
99. Available at:
www.hydrol-earth-syst-sci.net/6/85/2002/hess-6-85-2002.pdf
[2] G. M. Stokes and S. E. Schwartz. (1994, Jul.). The Atmospheric Radiation
Measurement (ARM) program: programmatic background and design of the Cloud
and Radiation Test Bed. Bulletin of the American Meteorological Society. [Online].
75(7), pp.1201-1221. Available at:
http://ams.allenpress.com/perlserv/?request=get-abstract&doi=10.1175%2F1520-
0477(1994)075%3C1201%3ATARMPP%3E2.0.CO%3B2
[3] “About ARM.” [29 Nov. 2006]. Available at: http://www.arm.gov/about/
[4] “AMF Deployments - Black Forest, Germany.” [26 Feb. 2007]. Available at:
http://www.arm.gov/sites/amf/blackforest/
[5] “AMF COPS – Initiation of Convection and the Microphysical Properties of Clouds
in Orographic Terrain 2007-04-02 – 2007-12-31.” Available at:
http://www.db.arm.gov/cgi-
bin/IOP2/selectExecSummary.pl?iopName=amf2007cops&person_id=
[6] “AMF Deployments – Niamey, Niger, West Africa.” [26 Feb. 2007]. Available at:
http://www.arm.gov/sites/amf/niamey/
[7] “Southern Great Plains.” [19 July 2007]. Available at:
http://www.arm.gov/sites/sgp.stm
[8] T. R. Oke, Boundary Layer Climates. London, Great Britain and New York, New
York: Routledge, 1995, pp. 25.
[9] D. R. Cook and M. S. Pekour. (2008, Jan.). Eddy Correlation Flux Measurement
System (ECOR) Handbook. DOE/SC-ARM/TR-05. Available at:
www.arm.gov/publications/tech_reports/handbooks/ecor_handbook.pdf
[10] K. B. Widener and K. Johnson. (2005, Jan.). Millimeter Wave Cloud Radar
(MMCR) Handbook. ARM TR-018. Available at:
www.arm.gov/publications/tech_reports/handbooks/mmcr_handbook.pdf
[11] T. Stoffel. (2004, Nov.). Solar Infrared Radiation Station (SIRS) Handbook. ARM
TR-025. Available at:
www.arm.gov/publications/tech_reports/handbooks/sirs_handbook.pdf](https://image.slidesharecdn.com/7111d412-8cc6-4d1e-9781-2edcd516f962-150717190933-lva1-app6891/85/Comparing-Surface-Energy-Balances-for-the-Black-Forest-16-320.jpg)
![16
[12] T. Stoffel. (2004, Nov.). SKYRAD Handbook. ARM TR-026. Available at:
www.arm.gov/publications/tech_reports/handbooks/skyrad_handbook.pdf
[13] T. Stoffel. (2004, Nov.). Ground Radiation (GNDRAD) Handbook. ARM TR-027.
Available at:
www.arm.gov/publications/tech_reports/handbooks/gndrad_handbook.pdf
[14] A. Khandwalla, N. Majurec, S. M. Sekelsky, C. R. Williams, and K. S. Gage.
(2002). “Characterization of radar boundary layer data collected during the 2001
multi-frequency radar IOP,” in Proceedings of the Twelfth ARM Science Team
Meeting, 2002, pp. 1-5.
[15] T. Konzelmann, P. Calanca, G. Muller, L. Menzel, and H. Lang. (1997). Energy
balance and evapotranspiration in a high mountain area during summer. Journal of
Applied Meteorology. [Online]. 36(7), pp. 966-973. Available at:
http://ams.allenpress.com/perlserv/?request=get-abstract&doi=10.1175%2F1520-
0450(1997)036%3C0966:EBAEIA%3E2.0.CO%3B2
[16] J. A. Brotzge and K. C. Crawford. (2003). Examination of the surface energy
budget: a comparison of eddy correlation and Bowen ratio measurement systems.
Journal of Hydrometeorology. [Online]. 4(2), pp. 160-178. Available at:
rc.ihas.nagoya-u.ac.jp](https://image.slidesharecdn.com/7111d412-8cc6-4d1e-9781-2edcd516f962-150717190933-lva1-app6891/85/Comparing-Surface-Energy-Balances-for-the-Black-Forest-17-320.jpg)