In Search of the Mechanisms Behind Soil Respiration of a Douglas-Fir Forest in Complex Terrain Using Natural Abundance  13 C OBJECTIVE To use a naturally-occurring gradient in microclimate across a small, steep catchment to identify and quantify biotic and abiotic factors that influence soil respiration and its isotopic signature (  13 C R-s ).   Soil respiration rates exhibited high temporal and spatial variability. Ridge plots respired on average 0.8   mol m -2 s -1  more than midslope and valley plots. METHODS Site: Watershed 1 in HJ Andrews Forest, OR. Six highly instrumented plots across a small, steep catchment were categorized by topography (slope position and slope aspect). On these plots we measured : S oil moisture and temperature, VPD, and transpiration across plots. Soil respiration using a LiCor 6200 with soil chamber. Isotopic signature of soil respiration with soil gas wells (Kayler et al. 2008) Distinct period of enrichment in   13 C R-s  during the early growing season could be indicative of an increase in heterotrophic breakdown of soil carbon or autotrophic breakdown of plant reserves. Signal gradually becomes more depleted during the seasonal drought followed by another period of enrichment. Uncorrected estimates of   13 C R-s  13 C R-s  is not always at steady-state.  A fractionation of 4.4‰ due to diffusive gas transport is associated with estimates of   13 C R-s  that use belowground samples. Thus, all field estimates should line up on the 4.4 ‰ regression line which is clearly not the case. 2005 samples taken during the day are enriched.  This could be due to a change in the background signal or atmospheric incursion into the soil profile (e.g. Millard et al. 2008). 2006   samples  taken during the evening are depleted with reference to the steady-state model.  This is likely caused by advective gas transport. Only estimates made during steady-state were used in the subsequent analysis Figure details:  Comparison of uncorrected mixing model estimate with steady-state model (Amundson et al. 1998).  Two regression lines are shown: one is a 1:1 line with the steady-state model estimate, the second uses the same model estimates but they are enriched by 4.4‰.  Uncorrected mixing-model estimates (y-axis) are plotted against the steady-state estimate (x-axis). Zachary Kayler 1,4 , Elizabeth Sulzman 2 , Holly Barnard 1 , Barbara Bond 1 , Alan Mix 3   4 zachary.kayler@oregonstate.edu  Affiliations:  1  Department of Forest Science,  2 Crop and Soil Science Department,  3 College of Oceanography and Atmospheric Science.  13 C R-s  seasonal patterns remain approximately the same even when non steady-state estimates are removed. The SF slope   13 C R-s  values are enriched by 0.42 ‰  relative to the NF slope (p<0.01). Enriched signal could be due to SF slope soil organic matter at 15 and 30 cm (table inset). Soil   13 C ABSTRACT:  Soil respiration and its isotopic signature (  13 C R-s ) varied spatially and temporally over the growing season  (1)    13 C R-s  was not always at steady-state  (2)   Transpiration was the principle driver of soil respiration and   13 C R-s   (3) 1. Soil Respiration and   13 C R-s  Seasonal Patterns 2. Observations of Non Steady-State   13 C R-s  Dynamics 3. Transpiration as a Driver of   13 C R-S Transpiration was positively correlated with soil flux and negatively correlated with   13 C R-s  indicating the importance of recent photosynthates to this system. First peak in correlation (0-6 lag days) could correspond to root respiration and microbial breakdown of root exudates.  2006 soil respiration rates Dashed Line:  North Facing (NF) slope  Solid Line:  South Facing (SF) slope Dashed Line:  North Facing (NF) slope  Solid Line:  South Facing (SF) slope  13 C R-s  at steady-state corrected by -4.4 ‰ Lag Days Pearson’s Correlation Coefficient r References:  Amundson, R., L. Stern, T. Baisden and Y. Wang.1998. The isotopic composition of soil and soil-respired CO 2 .  Geoderma   82 (1-3): 83-114. Kayler, Z. E., E. W. Sulzman, J. D. Marshall, A. Mix, W. D. Rugh and B. J. Bond.2008. A laboratory comparison of two methods used to estimate the isotopic composition of soil    CO 2  efflux at steady state.  Rapid Communications in Mass Spectrometry   22 (16): 2533-2538. Millard, P., A. J. Midwood, J. E. Hunt, D. Whitehead and T. W. Boutton.2008. Partitioning soil surface CO2 efflux into autotrophic and heterotrophic components, using natural gradients in soil delta C-13 in an undisturbed savannah soil.  Soil Biology & Biochemistry   40 (7): 1575-1582. Flux response  13 C R-s  response * p<0.01 p<0.05 p<0.10 ** *** steady-state model estimate offset by 4.4 ‰ 1:1 line of steady-state model estimate Measured during the day Measured during the night

Aguposter2008

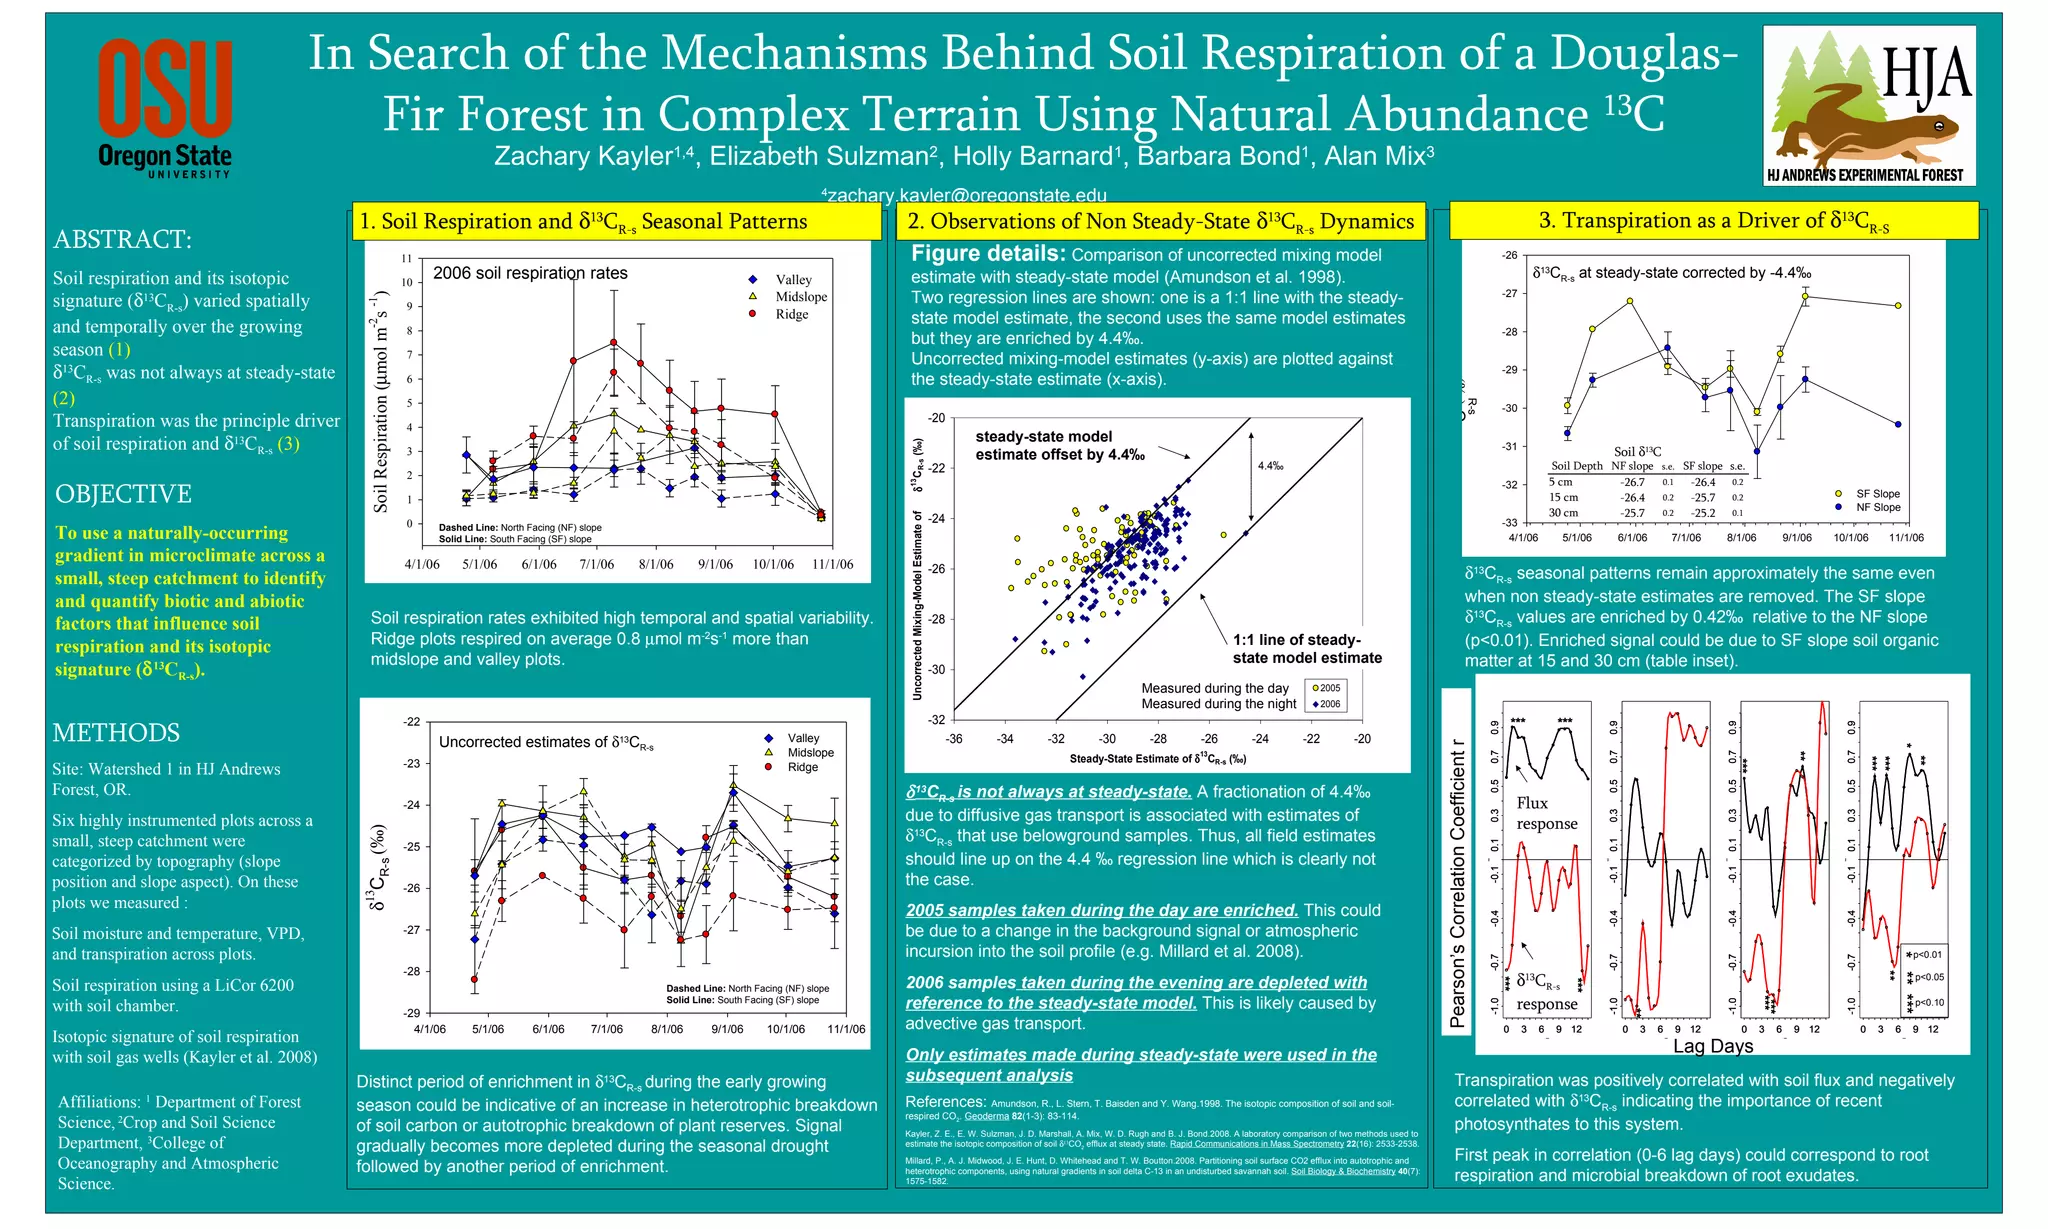
  • 1.
    In Search ofthe Mechanisms Behind Soil Respiration of a Douglas-Fir Forest in Complex Terrain Using Natural Abundance 13 C OBJECTIVE To use a naturally-occurring gradient in microclimate across a small, steep catchment to identify and quantify biotic and abiotic factors that influence soil respiration and its isotopic signature (  13 C R-s ). Soil respiration rates exhibited high temporal and spatial variability. Ridge plots respired on average 0.8  mol m -2 s -1 more than midslope and valley plots. METHODS Site: Watershed 1 in HJ Andrews Forest, OR. Six highly instrumented plots across a small, steep catchment were categorized by topography (slope position and slope aspect). On these plots we measured : S oil moisture and temperature, VPD, and transpiration across plots. Soil respiration using a LiCor 6200 with soil chamber. Isotopic signature of soil respiration with soil gas wells (Kayler et al. 2008) Distinct period of enrichment in  13 C R-s during the early growing season could be indicative of an increase in heterotrophic breakdown of soil carbon or autotrophic breakdown of plant reserves. Signal gradually becomes more depleted during the seasonal drought followed by another period of enrichment. Uncorrected estimates of  13 C R-s  13 C R-s is not always at steady-state. A fractionation of 4.4‰ due to diffusive gas transport is associated with estimates of  13 C R-s that use belowground samples. Thus, all field estimates should line up on the 4.4 ‰ regression line which is clearly not the case. 2005 samples taken during the day are enriched. This could be due to a change in the background signal or atmospheric incursion into the soil profile (e.g. Millard et al. 2008). 2006 samples taken during the evening are depleted with reference to the steady-state model. This is likely caused by advective gas transport. Only estimates made during steady-state were used in the subsequent analysis Figure details: Comparison of uncorrected mixing model estimate with steady-state model (Amundson et al. 1998). Two regression lines are shown: one is a 1:1 line with the steady-state model estimate, the second uses the same model estimates but they are enriched by 4.4‰. Uncorrected mixing-model estimates (y-axis) are plotted against the steady-state estimate (x-axis). Zachary Kayler 1,4 , Elizabeth Sulzman 2 , Holly Barnard 1 , Barbara Bond 1 , Alan Mix 3 4 zachary.kayler@oregonstate.edu Affiliations: 1 Department of Forest Science, 2 Crop and Soil Science Department, 3 College of Oceanography and Atmospheric Science.  13 C R-s seasonal patterns remain approximately the same even when non steady-state estimates are removed. The SF slope  13 C R-s values are enriched by 0.42 ‰ relative to the NF slope (p<0.01). Enriched signal could be due to SF slope soil organic matter at 15 and 30 cm (table inset). Soil  13 C ABSTRACT: Soil respiration and its isotopic signature (  13 C R-s ) varied spatially and temporally over the growing season (1)  13 C R-s was not always at steady-state (2) Transpiration was the principle driver of soil respiration and  13 C R-s (3) 1. Soil Respiration and  13 C R-s Seasonal Patterns 2. Observations of Non Steady-State  13 C R-s Dynamics 3. Transpiration as a Driver of  13 C R-S Transpiration was positively correlated with soil flux and negatively correlated with  13 C R-s indicating the importance of recent photosynthates to this system. First peak in correlation (0-6 lag days) could correspond to root respiration and microbial breakdown of root exudates. 2006 soil respiration rates Dashed Line: North Facing (NF) slope Solid Line: South Facing (SF) slope Dashed Line: North Facing (NF) slope Solid Line: South Facing (SF) slope  13 C R-s at steady-state corrected by -4.4 ‰ Lag Days Pearson’s Correlation Coefficient r References: Amundson, R., L. Stern, T. Baisden and Y. Wang.1998. The isotopic composition of soil and soil-respired CO 2 . Geoderma 82 (1-3): 83-114. Kayler, Z. E., E. W. Sulzman, J. D. Marshall, A. Mix, W. D. Rugh and B. J. Bond.2008. A laboratory comparison of two methods used to estimate the isotopic composition of soil   CO 2 efflux at steady state. Rapid Communications in Mass Spectrometry 22 (16): 2533-2538. Millard, P., A. J. Midwood, J. E. Hunt, D. Whitehead and T. W. Boutton.2008. Partitioning soil surface CO2 efflux into autotrophic and heterotrophic components, using natural gradients in soil delta C-13 in an undisturbed savannah soil. Soil Biology & Biochemistry 40 (7): 1575-1582. Flux response  13 C R-s response * p<0.01 p<0.05 p<0.10 ** *** steady-state model estimate offset by 4.4 ‰ 1:1 line of steady-state model estimate Measured during the day Measured during the night