Download to read offline


![Community Attitudes to Renewable Energy in NSW 7
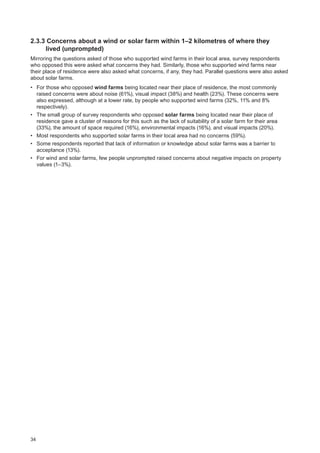
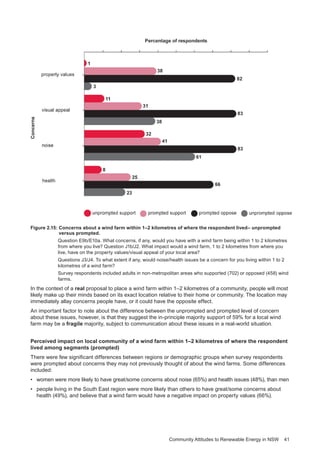
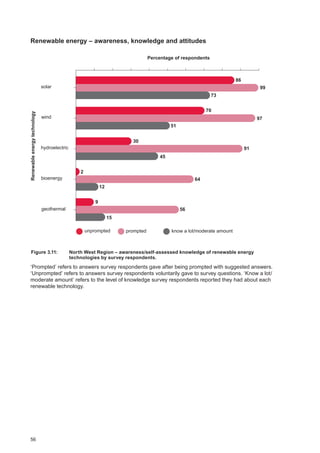
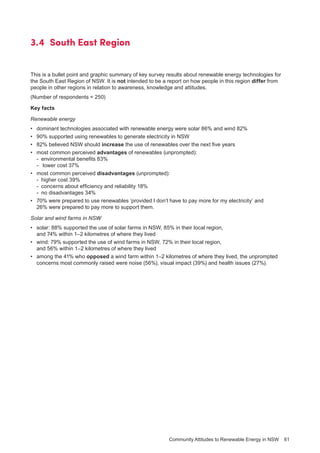
2.1.3 Specific awareness and self-assessed knowledge of
wind farms and solar farms
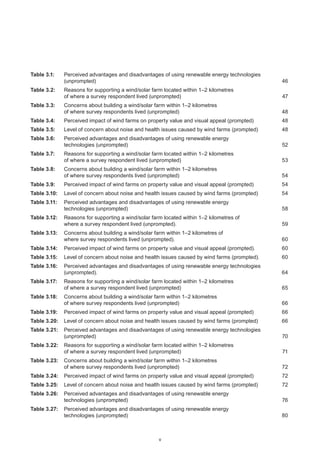
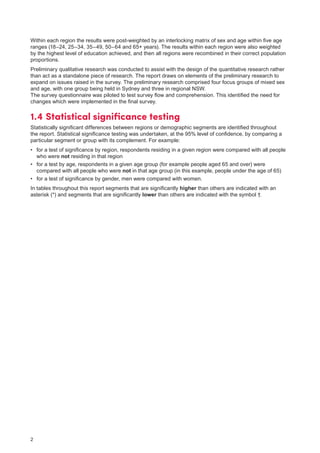
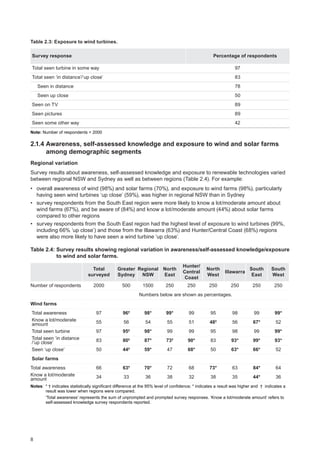
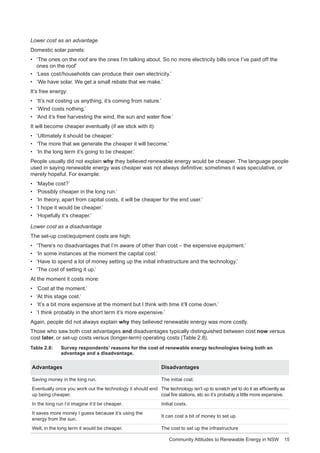
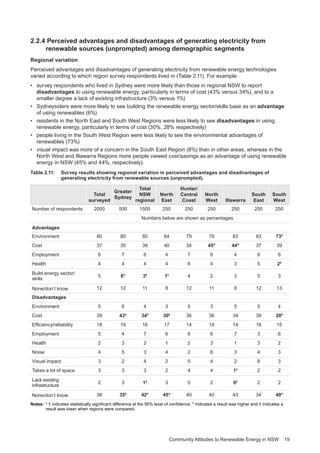
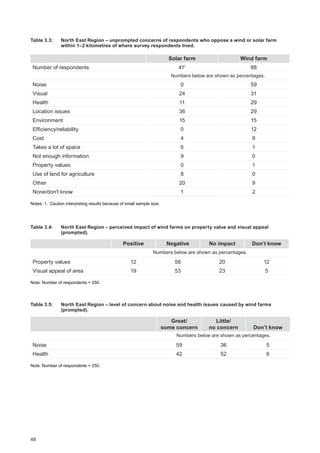
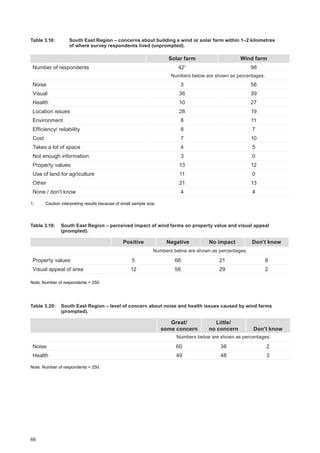
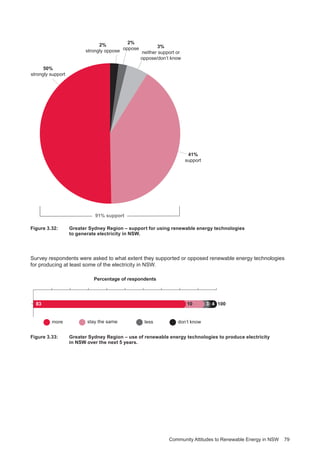
Having looked at community understanding of the broader category of renewable energy, this section
looks at specific awareness and self-assessed knowledge survey respondents had about wind farms and
solar farms (Figure 2.3). The following provides an overview of the findings:
• nearly all survey respondents (97%) had heard about the use of wind farms, wind turbines or windmills
to generate electricity
• nearly all survey respondents (97%) knew what a wind turbine looked like – about 80% had seen a
wind turbine in ‘the distance’ or ‘up close’, and 89% had seen them in pictures or on television
(Table 2.3)
• fewer people (66%) said they had heard of commercial solar farms being used to generate electricity
• about half the survey respondents who had heard of wind farms and solar farms said they knew
‘a lot’ or ‘a moderate amount’ about these technologies, and others said they knew ‘a little’ or had
heard of them.
wind farms
Percentage of respondents
solar farms
97
66
9741 36
6626 27
wind farms
Self-assesed
knowledge
Percentage of respondents
solar farms
Awareness
know a lot know a moderate amount know a little just heard the name
14 5
8 5
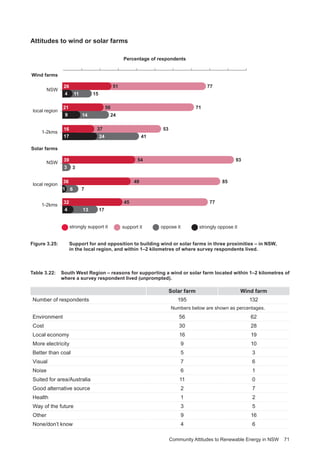
Figure 2.3: Awareness and self-assessed knowledge of wind farms and solar farms.
Question E1/F2. [Wind farms are groups of wind turbines or windmills used to generate electricity. / A
commercial solar farm is about the size of a football field, with a large number of solar panels that generate
electricity. The electricity is then fed into the national power grid.] Before today, had you heard about the
use of wind farms or wind turbines or windmills/ the idea of solar farms being used to generate electricity?
Question E2/F3. Before this survey, how much did you know about wind/solar farms?
Number of survey respondents = 2000.](https://image.slidesharecdn.com/community-attitudes-renewable-energy-150419-161205001549/85/Community-Attitudes-Towards-Renewable-Energy-17-320.jpg)


![Community Attitudes to Renewable Energy in NSW 31
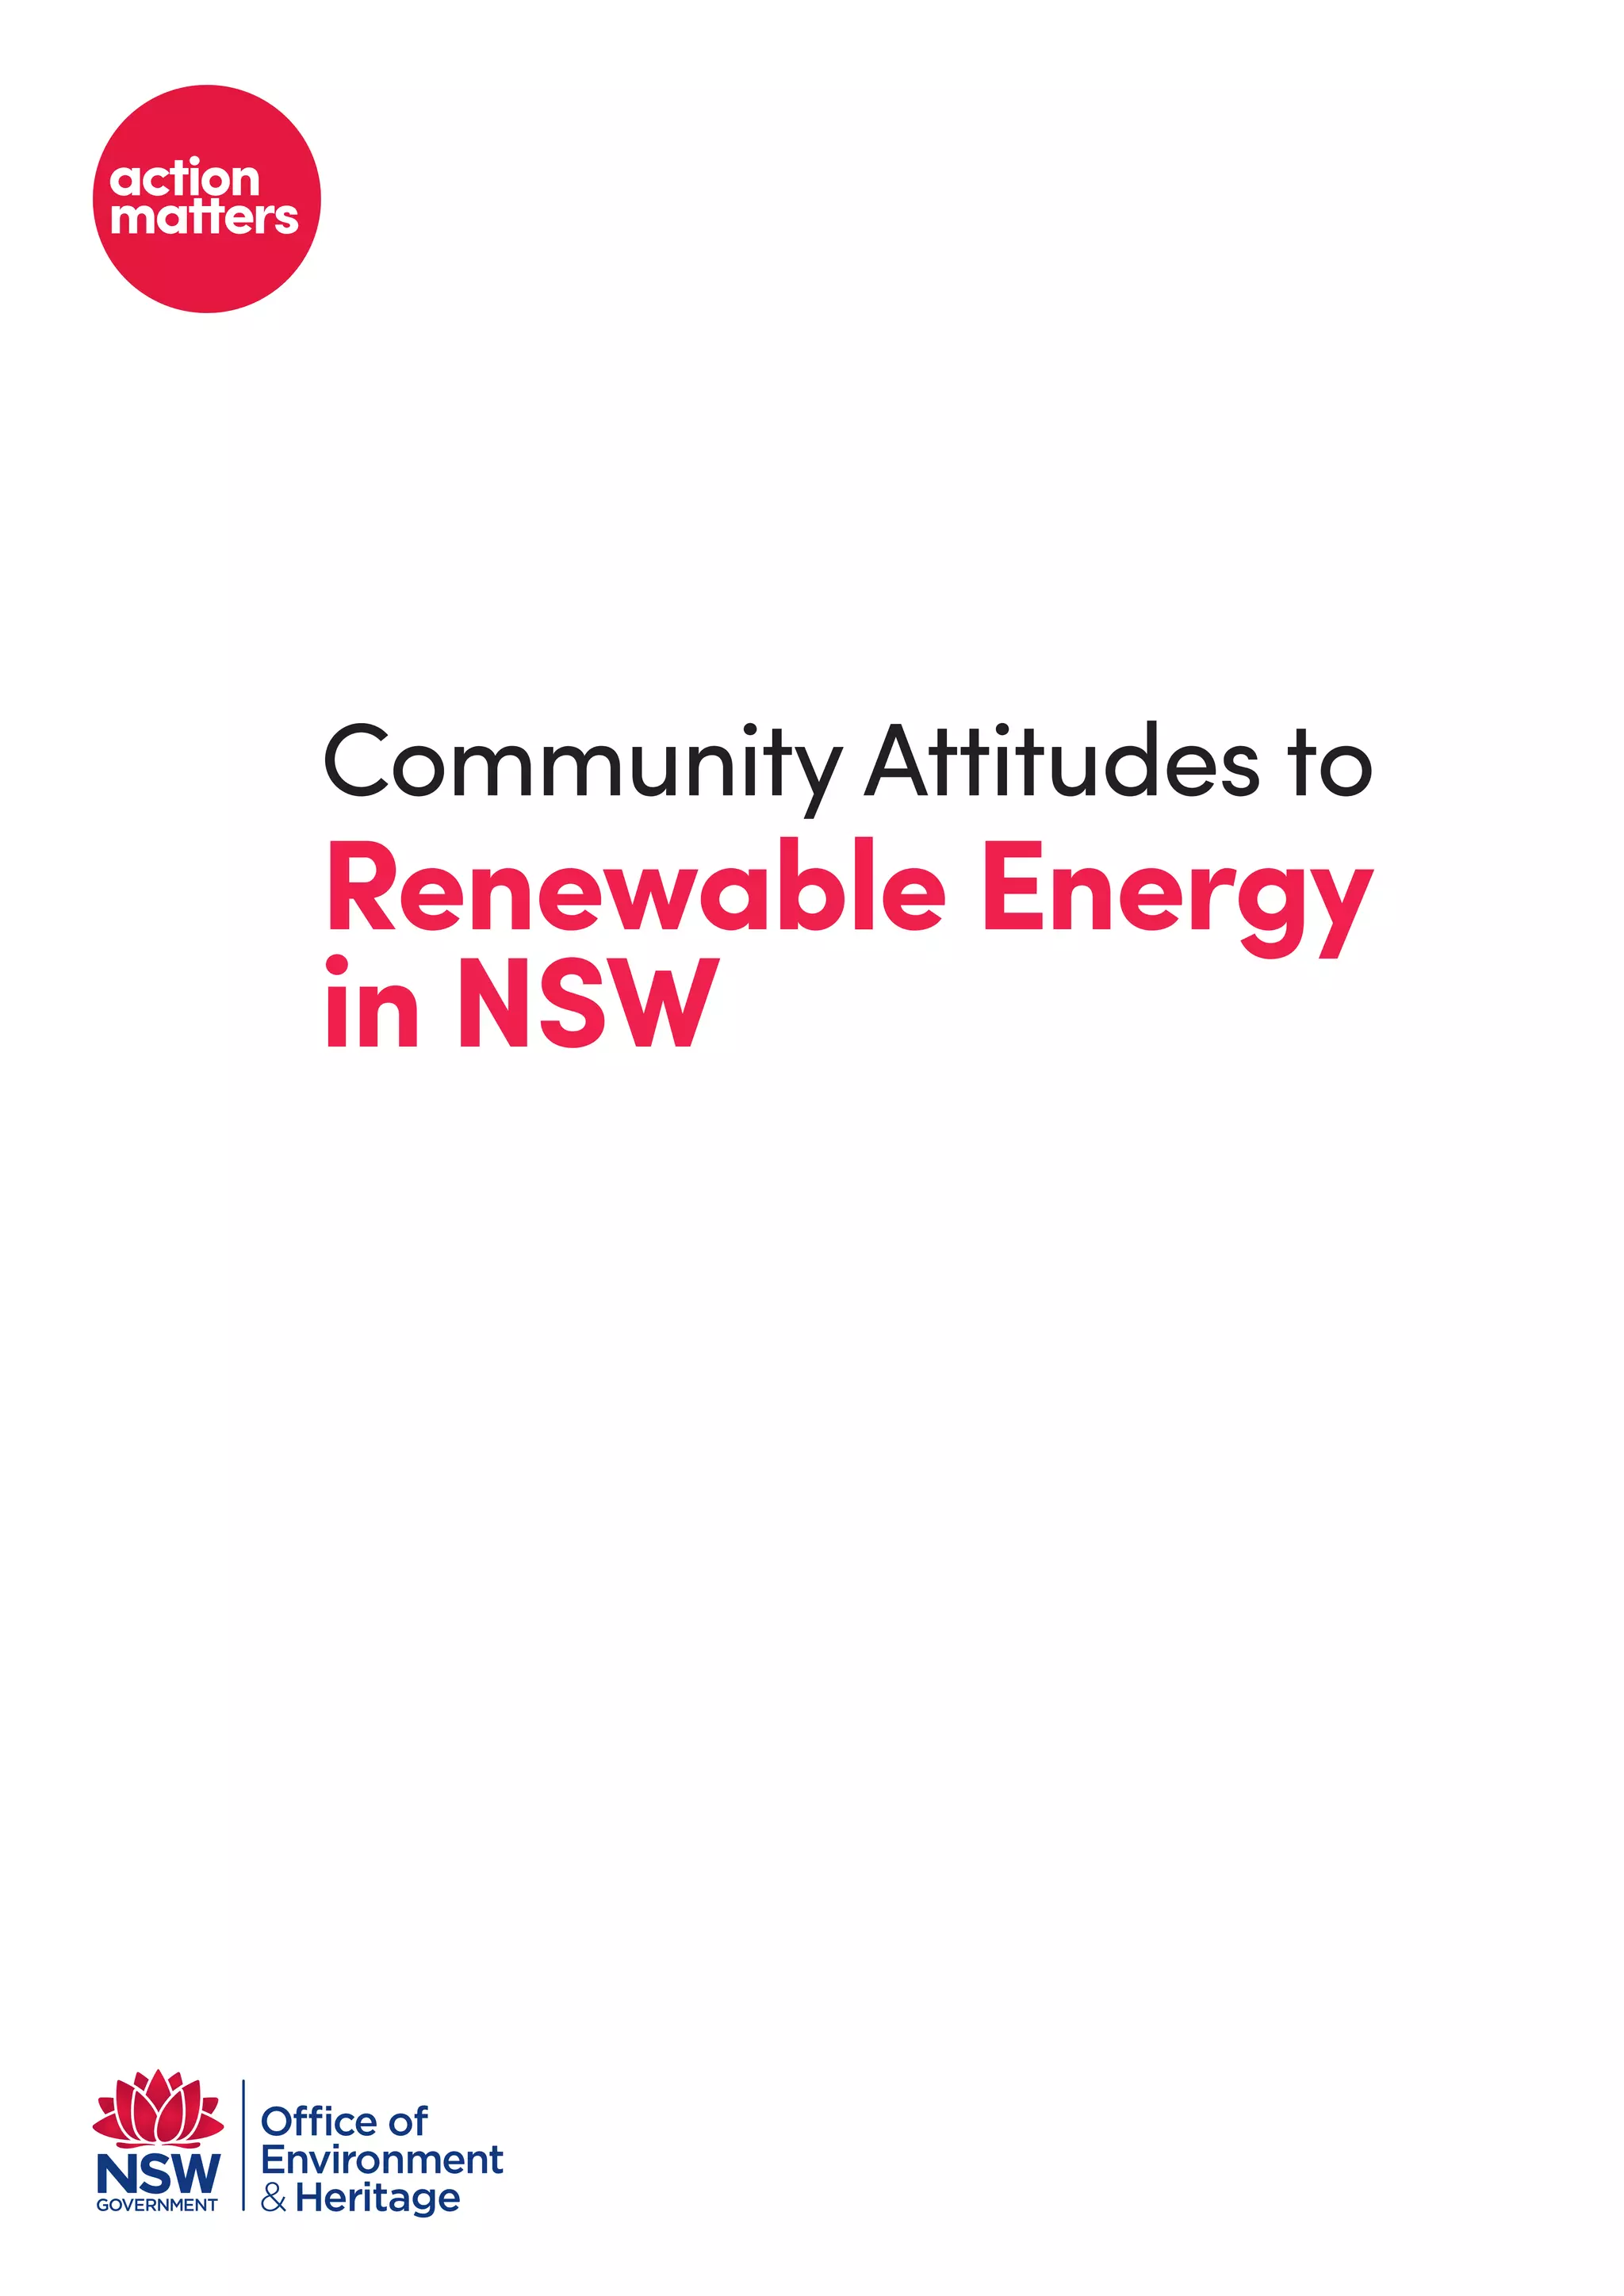
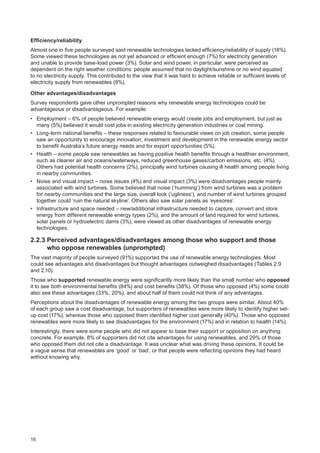
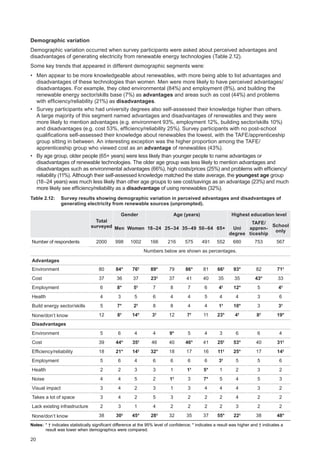
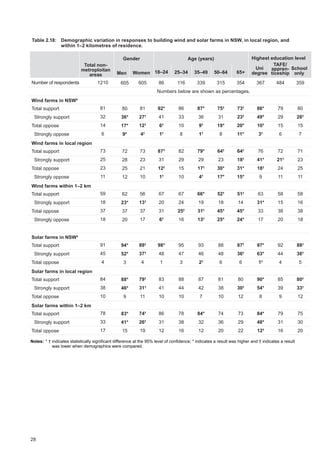
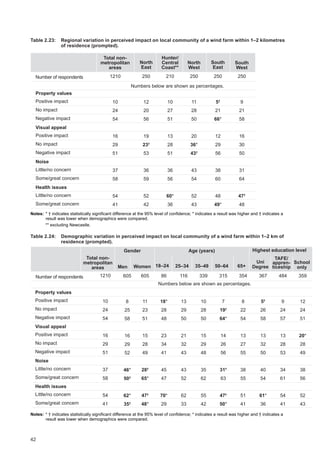
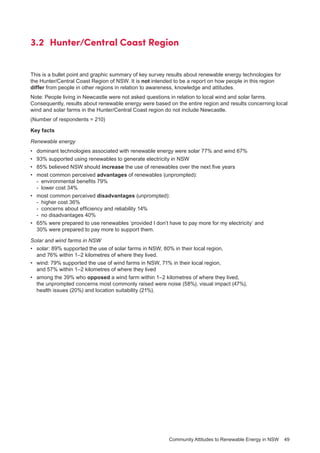
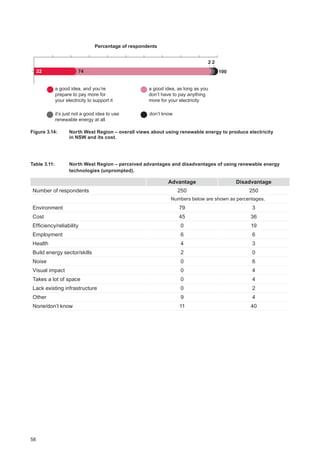
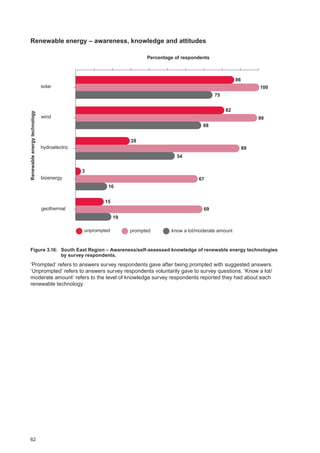
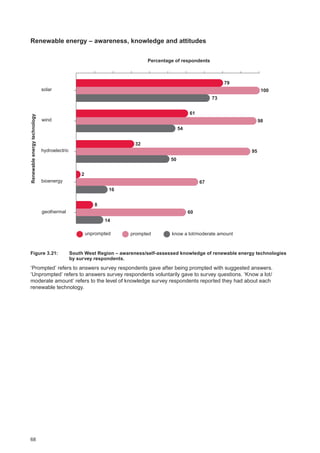
Respondents raised a wide variety of reasons why a wind or solar farm within 1–2 kilometres of their
residence would benefit them or the wider community. For example:
• Environment – Reflecting the perceived advantages of using renewables in general, the two key
reasons for supporting local wind and solar farms on environmental grounds were (i) they were
cleaner/created less ‘pollution’ or fewer greenhouse gases, and (ii) sustainability.
• Cost – Supporters also believed (or hoped) that local wind and solar farms would (eventually) reduce
the cost of electricity, or at least in some way be cheaper.
• Local economy – The perceived benefit to the local economy included creating jobs. For wind farms,
a small proportion of supporters (2%) also mentioned the potential financial benefit to property owners
who hosted a wind farm, and 1% said wind farm could be a potential tourist attraction.
• More electricity – Some respondents believed the infrastructure would add to the supply of electricity.
(This included some who may have misconstrued that the idea of a local wind or solar farm would be
to supply electricity for the local area, but they appeared to be few in number. The potential for this
confusion was noted in the pilot study and to alleviate this, the words ‘The electricity would be fed into
the national power grid’ were included in relevant questions.)
• Better than coal – This included reducing reliance on coal, not burning coal or fossil fuels, or simply
that wind or solar was better than using coal or coal-fired power stations.
• Visual and noise – There was an interesting contrast in opinion on these issues. Some people
supported solar farms because they perceived them as less visually unappealing or noisy than a wind
farm – they were more acceptable because they were perceived as relatively unobtrusive. In contrast,
some people who supported wind farms found them visually appealing, and a few said ‘they’re not that
noisy anyway’.
• Suited for the area/Australia – Some people who supported solar farms saw the inherent logic of
using solar in an area with an abundance of sunshine, whether it be Australia (‘Australia is one of the
sunniest places in the world’) or the local area (‘We’re in a relatively open farming area and we do
cop a lot of sun throughout the year’). In some cases solar’s suitability for the local area related to the
available space (‘I live in a small country town and there’s paddocks available for it to be set up’).
• Good alternative source of energy – This refers to people saying that wind and solar were a better
alternative to ‘traditional’ energy sources – which they also linked with the environmental and cost
benefits.
• Health – These responses fell into two broad categories: (i) the perception that local wind and solar
farms had no negative health impacts, or none the respondent was aware of, or (ii) local wind and
solar farms were healthier because they were cleaner and safer (e.g. no air pollution, nuclear waste).
• The way of the future – Some people saw local wind and solar farms as part of ‘the way forward’ on
energy, in terms of addressing the limited supply of non-renewables and also moving toward greater
use of cleaner, low impact (environmentally), renewable sources.
• Need to be built somewhere – Among other reasons for supporting local wind and solar farms was
the view that they ‘need to be built somewhere’ and local communities should support this (‘Someone
should have it in their backyard and, if I’m in the area which has the right conditions for it, I should be
prepared to support it’).
• Simply a good idea – Some supporters of local wind and solar farms held the general view that they were
a good idea (‘It’s [wind farms] absolutely doing good and anything we can do to help the natural is much
better’), or have no reason to oppose them (‘Well, I don’t think it’s going to harm anyone’). Others had a
desire to support renewable energy technologies generally (‘Because I endorse renewable energy’).](https://image.slidesharecdn.com/community-attitudes-renewable-energy-150419-161205001549/85/Community-Attitudes-Towards-Renewable-Energy-41-320.jpg)
![36
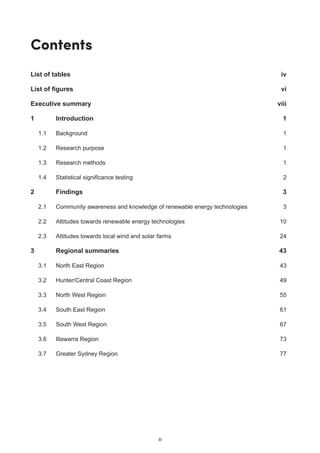
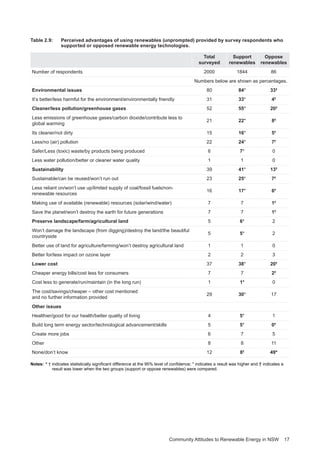
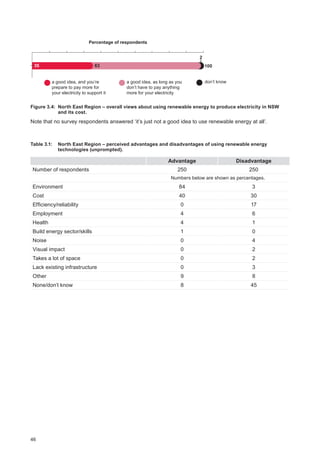
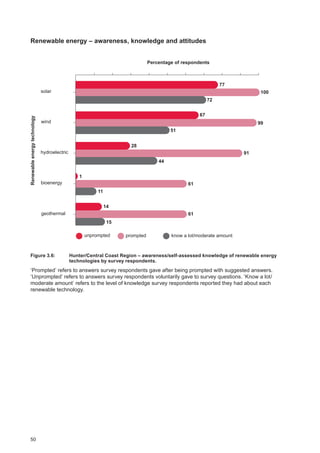
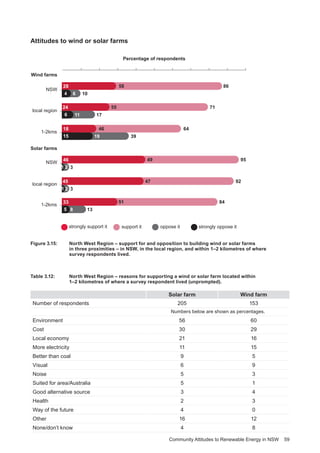
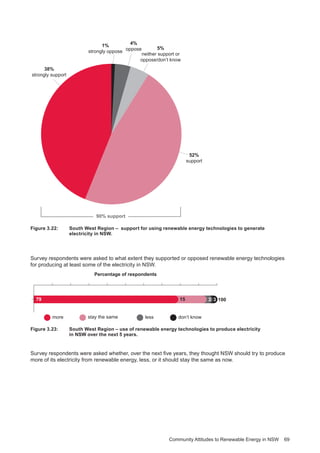
Noise
Some survey respondents raised concerns about nearby communities hearing noise from turning wind
turbines, especially at night, and particularly when there was a ‘farm’ of them (‘They put them in Victoria on
farming land and on hillsides and the people who live there are nearly driven crazy by the sound of them’;
‘They are in big groups and when they are in action you get some low frequency humming or buzzing’).
There was also some overlap with health concerns, with specific mention of the impact of low frequency
noise or ‘humming’ on human health (e.g. causing migraines, sleep problems) and animal health (‘it affects
wildlife and birds and it’s because of the pitch of the turbines and the blades’).
For the small proportion of respondents who mentioned noise in relation to solar farms, issues raised
included noise at the construction phase; noise because it was ‘industrial’, and in some cases people
queried whether solar farms were noisy or not (‘Are they noisy?’; ‘Could be workmen and humming noises or
whatever it is that creates the power’).
Visual impact
Some people did not like the general look of wind and solar farms (‘wind farms are ugly’), or commented on
their impact on the look of a specific local area (‘They ruin the look of the landscape, there’s no hiding them’;
‘We are in a residential setting, it wouldn’t suit the aesthetics of the area’; ‘I do think that would have a big
impact on tourism because it is a very pretty area’).
Health
For solar farms, rather than mentioning specific adverse health effects, people said there may be associated
health issues. However, survey respondents reported a range of specific problems believed to affect those
living near wind farms, such as:
• ‘because of the vibrations [the wind farm] gives off, people in Goulburn have a lot of trouble with their
inner ear… it affects your balance, affects your mood, the noise has been linked to increased anxiety and
stress in patients with pre-existing psychiatric imbalances… also nausea.’
• ‘I’ve read a lot about people living near wind farms getting illness… certain types of cancers.’
• ‘I heard a lot of people get headaches and that sort of stuff.’
• ‘There’s been asthma, a lot of respiratory problems, what I’ve only heard from talking to people’.
Location issues
A number of issues were raised about the general suitability of local communities as locations for solar or
wind farms. These included:
• population density (‘We are in a residential area and it could not be built 1–2 kilometres from where we
live’, ‘It’s just not in the right area… close to people, in built up areas.’)
• local industry (‘I live in a small country town which is all agricultural… [a solar farm] wouldn’t fit in with
the industry… it’s more for in the country where it’s not heavily populated’, ‘would not be suitable for wind
farms… it’s a heavily orcharded area.’)
• local features (‘I am surrounded by national parks and forests. You are not going to cut down a national
park to build a solar farm, are you?’, ‘[Our town is] heritage listed so there’s older buildings and older
houses so it wouldn’t suit this area.’)
• weather conditions (‘[local community] would be a terrible place to put the solar farm – it’s cold and
miserable’, ‘I don’t think we get a reliable amount of wind here… we’re in a small local valley’).
Environment
People were concerned about general environmental damage such as destruction of habitat/loss of
landscape due to land clearing for the infrastructure associated with wind and solar farms. The impact
on animal life was also a key concern – the impact of wind farm noise on the general health of local farm
animals, wildlife and birdlife (‘there is a lot of talk about wildlife and cows etc. being disturbed by them’), as
well as the danger to birds flying over solar and wind farms (‘Birds think [the solar farm] is a lake therefore
dive into it and kill themselves’, ‘[wind farms] have a good habit of killing birds which fly into them’).
Efficiency/reliability
Some concerns were raised about the efficiency of wind farms and the reliability of energy supply (‘How
can you say that they’re viable if you don’t get wind. You’d have to revert to some other means’, ‘They’re not
viable – you need a thousand of them to run a torch, they don’t generate enough power’). To a lesser degree
there were reliability concerns about solar, on the premise that no sunlight equalled no electricity.](https://image.slidesharecdn.com/community-attitudes-renewable-energy-150419-161205001549/85/Community-Attitudes-Towards-Renewable-Energy-46-320.jpg)
![Community Attitudes to Renewable Energy in NSW 37
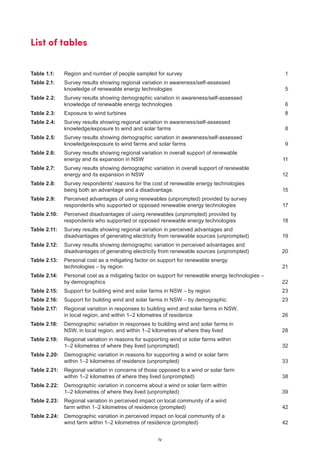
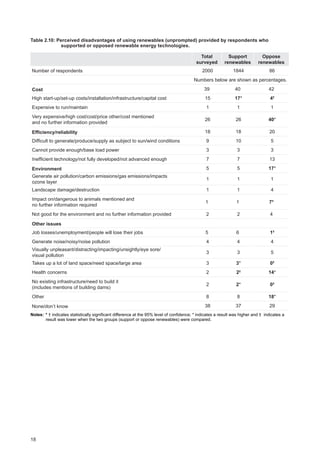
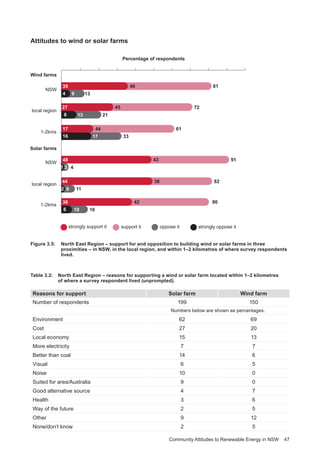
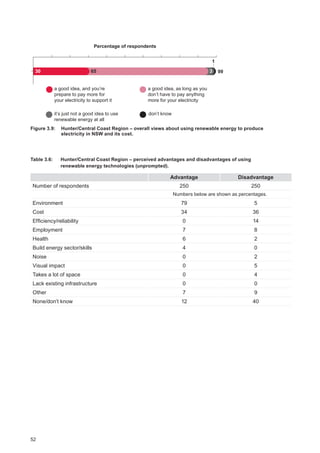
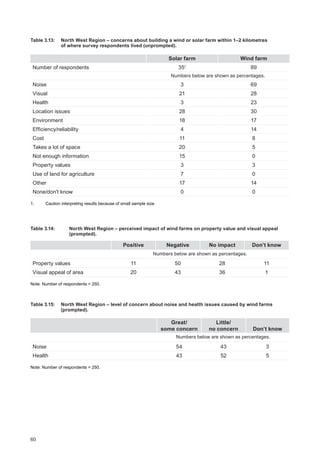
Cost
There were concerns about high set-up and ongoing costs (including the level of government subsidy), as
well as the overall cost-effectiveness of using these technologies versus current non-renewable options.
For example:
• ‘Their [wind farms] operating and capital cost is too high, requiring too much subsidy.’
• ‘When there is not wind, they don’t work, and there’s no value for money – and if it’s too windy, they have
to be turned off, there’s no value for money.’
• ‘They’re not cost-effective, sun doesn’t always shine so sometimes they will not be generating any power
at all.’
• ‘We’ve got heaps of coal and it’s very cheap to produce and we should be using it instead of the over-
costed renewable stuff.’
Need a lot of space
There were comments made on the amount of space needed for the infrastructure for local wind and solar
farms (‘you need so much more space in collecting [wind, solar energy] than you do for an existing power
station’).
Not enough info
Some people said they didn’t have enough information about solar farms or did not know enough about
them to support one being located in their area. In some cases this linked with concerns about dangers that
may be connected with the technologies, including health issues (‘I’d have to research it. I’d oppose if it gave
off any bad sort of energies to human beings’; ‘I guess I don’t know enough about it and therefore there are
concerns in my mind on whether it is dangerous’; ‘there is not enough known about the effects solar farms
can have on health’).
Property values
A small number of survey respondents raised concerns about decreased land/house values and often
mentioned this in conjunction with the visual impact they perceived local wind and solar farms would have
(‘Could be ugly and decrease land value’; ‘Visual impact - impact on property prices arising from that visual
impact’).
Use land for agriculture
Some people had the view that solar farms should not be built on ‘good agricultural land’ that is, or could be,
used for farming crops or cattle grazing.
Other issues
Other concerns raised included wind turbines falling over, parts falling off or catching fire, as well as
problems with glare/reflection and bushfire risk from solar panels.
2.3.4 Concerns of those opposed to wind and solar farms within 1–2 kilometres of
where they lived among regional and demographic segments (unprompted)
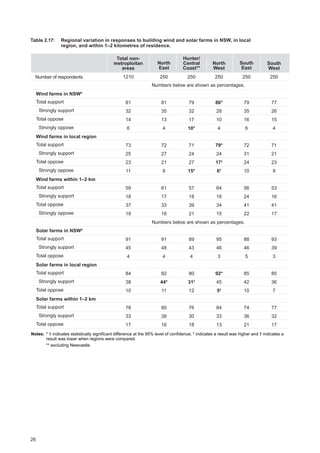
Regional variations
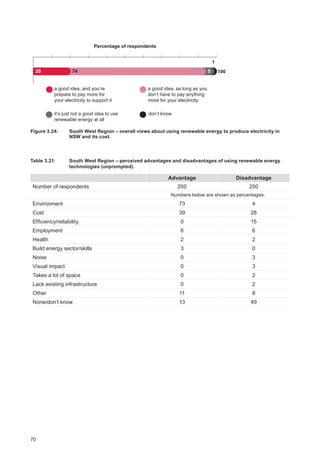
The reasons survey respondents gave for opposing wind and solar farms in their local area were largely
consistent across different regions (Table 2.21). However, there were some differences; for example:
• people living in the Hunter/Central Coast (excluding Newcastle) region were more likely to be concerned
about visual appeal (47%) and the amount of space wind farms would require (10%)
• property values were more likely to be a concern for people living in the South East region in relation to
both wind and solar farms (12%/13%), and visual impact for solar farms (36%).
• along with visual impact (36%).](https://image.slidesharecdn.com/community-attitudes-renewable-energy-150419-161205001549/85/Community-Attitudes-Towards-Renewable-Energy-47-320.jpg)


This document summarizes the results of a survey conducted by the Office of Environment and Heritage on community attitudes towards renewable energy in New South Wales. Some key findings include: - Levels of awareness and self-assessed knowledge of renewable energy technologies varied significantly between different regions and demographics in NSW. - Overall support for generating electricity from renewable sources in NSW was high, however personal costs was seen as a mitigating factor by many respondents. - Support declined when asked about building wind or solar farms closer to home, with concerns around property values, noise, and visual impacts cited as reasons for opposition.


![[3] silabus pai sma xi](https://cdn.slidesharecdn.com/ss_thumbnails/3silabuspaismaxi-161205013425-thumbnail.jpg?width=640&height=640&fit=bounds)


![[6] program tahunan pai sma xi](https://cdn.slidesharecdn.com/ss_thumbnails/6programtahunanpaismaxi-161205005604-thumbnail.jpg?width=640&height=640&fit=bounds)