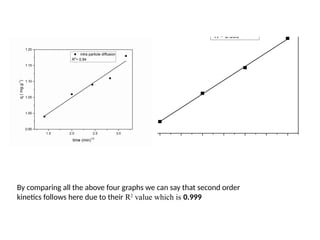
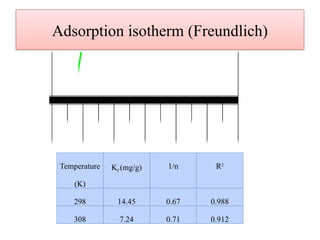
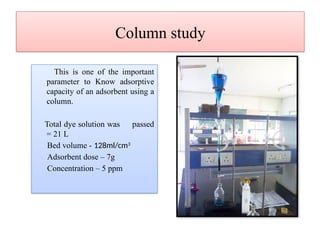
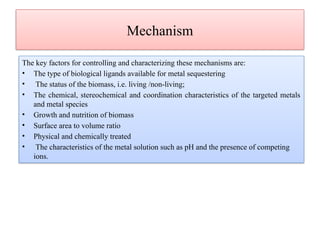
Rapid removal of Malachite green
dye from aqueous solution using saal
flower- A low cost biosorbent
Biosorption
Biosorption can be described as any system where a sorbate (e.g. an atom,
molecule, a molecular ion) interacts with a biosorbent (i.e. a solid surface of a
biological matrix) resulting in an accumulation at the sorbate – sorbent interface,
and therefore a reduction in the solution sorbate concentration.
Absorption Adsorption
Surface
complexation
Chelation
Mechanism
The key factors for controlling and characterizing these mechanisms are:
• The type of biological ligands available for metal sequestering
• The status of the biomass, i.e. living /non-living;
• The chemical, stereochemical and coordination characteristics of the targeted metals
and metal species
• Growth and nutrition of biomass
• Surface area to volume ratio
• Physical and chemically treated
• The characteristics of the metal solution such as pH and the presence of competing
ions.
Absorption
• Absorption is a physical or chemical phenomenon or a process in which atoms,
molecules or ions enter some bulk phase –gas, liquid or solid material. This is a
different process from adsorption, since molecules undergoing absorption are taken
up by the volume, not by the surface (as in the case for adsorption). A more general
term is sorption, which covers absorption and adsorption Absorption is a condition
in which something takes in another substance.
Adsorption
It is a adhesion of atoms, ions, bio molecules or molecules of gas, liquid
and dissolved solid to a surface and creates a film of adsorbate on the
surface of adsorbent.
Types:
1. Physisorption
2.Chemisorption
Lemon peel
Qmax - 43.45
mg/g,
Equilibrium
time- 24 hours,
% removal- 100
%, Monolayer
adsorption
Banana pseudo stem fibres
Equilibrium time- 60 minutes, % removal-
80%, pH is directly proportional to the dye
removal
Orange peel
Qmax -65.88mg/g , Equilibrium
time- 120 minutes, % removal-
70% , Maximum adsorption
occurs at pH- 7
Literature review
Wheat bran
Qmax -24 mg/g, Equilibrium time -
40 minutes,
% removal- 90%, pH –( 4-7)
Saw dust
Treated with formaldehyde and sulphuric
acid, Equilibrium time- 3 hours, %
removal- 92%, pH has no such effect
Hydrilla verticillata
Qmax -91.97mg/g, Equilibrium time- 200
minutes, % removal- 66%, Highly efficient at
318K
About Malachite green
• λmax= 617 nm
• Cationic dye
• pH sensitive (green colour arises between
pH (3-11)
• Green crystal
• Soluble in ethanol, methanol, amyl alcohol
and water
• Highly toxic to mammalian cells and liver
tumor enhancing agent
• Produces hazardous product when heated
to decomposition
• [4-[[4-(dimethylamino)phenyl]-
phenylmethylidene]cyclohexa-2,5-dien-1-
ylidene]-dimethylazanium;2-hydroxy-2-
oxoacetate;oxalic acid
• Chemical formula : C52H54N4O12 (dimer)
About saal flower (SF)
• Scientific name – Shorea robusta
• Kingdom- Plantae
• Order- Malvales
• Family- Dipterotarpaceae
• Genes- Shorea
• Species- S- robusta
• Colour- Yellow
• Native- Indian subcontinent ranging
south of the Himalaya from Mynamar
in the east to Nepal , India and
Bagladesh.
• Seasonal flower ( March- April)
• No productive use
Work
Treatment of adsorbent
Collection of raw materials
Washing and drying
Reflux and grinding
Carbonisation
This study is carried in batch for optimum result. Here we can determine the adsorption
capacity of an adsorbate. The removal rate of adsorbate mainly depend upon the force of
driving the rate of the adsorption and solution concentration as physical parameters and
surface area, porosity of adsorbent as morphological parameters, acidity or basicity nature of
adsorbent also important parameters
qe = (C0-Ce)* V/W
qe = amount adsorbed in equilibrium (mg/g)
C0 = initial adsorbate concentration (mg/L)
Ce= adsorbate concentration at equilibrium (mg/L)
V= volume of aqueous phase (ml)
W= amount of adsorbent use (mg)
Calibration curve (lower range)
Calibration curve (Higher range)
Conduction of experiments
Experiments Dose(g) Concentration(ppm) Time (min) Shaking
speed (RPM)
Contact time 0.2 10 varied 150±2
Dose Varied 10 10 150±2
Agitation speed 0.2 10 10 varied
Kinetics 0.2 10 varied ( interval
of two minutes)
150±2
Dye
concentration
0.2 varied 10 150±2
pH 0.2 10 (with different
pH)
10 150±2
Interfering ions 0.2 10( with different
radicals)
10 150±2
Experimental section
Conditions:
Concentration- 10ppm
Dose- 0.2 g
Time-10 minutes
Agitation speed- 150 ±2
RPM
Temperature- 25±2 °C Adsorbate
(Malachite green)
Adsorbent
(saal flower)
Batch experiment
Effect of contact time
Equilibrium is achieved
in 20 minutes
Effect of adsorbent dose
Maximum adsorption was
found at 0.6g. After that no
more further adsorption
takes place
Effect of pH
At higher pH it shows
more efficiency
Effect of initial concentration
Dye concentration is
indirectly proportional
to the % removal of
the dye.
Effect of interfering ions
Anions shows more
interfering property
than cations.
Effect of particle size
No significant effect
on particle size
Effect of agitation speed
Agitation speed is
directly proportional to
the removal % of the
dye
Effect of pre drying temperature
Maximum adsorption occurs at 343
K hence pre drying temperature is
inversely proportional to adsorption
Adsorption kinetics
By comparing all the above four graphs we can say that second order
kinetics follows here due to their R2
value which is 0.999
Adsorption isotherm (Langmuir)
Temperature Qmax (mg/g) b (L/mg) R2
298K 8.196 0.69 0.990
308K 10.20 0.389 0.98
(ppm)
Adsorption isotherm (Freundlich)
Temperature
(K)
Kf (mg/g) 1/n R2
298 14.45 0.67 0.988
308 7.24 0.71 0.912
Column study
This is one of the important
parameter to Know adsorptive
capacity of an adsorbent using a
column.
Total dye solution was passed
= 21 L
Bed volume - 128ml/cm3
Adsorbent dose – 7g
Concentration – 5 ppm
FTIR
FTIR of SF before adsorption FTIR of SF after adsorption
SEM
SEM of SF before adsorption SEM of SF after adsorption
Proximate analysis
This analysis comprises of moisture content, ash
content , volatile matter and % carbon present in our
sample.
Proximate analysis Result in %
Moisture content 5.56
Ash content 70.10
Volatile matter 1.16
Carbon content 22.73
Conclusion
• SEM exhibited that SF had a considerable number of pores for adsorption
and also there is no significantly change in the surrface toporaphy of SF
before and after adsorption of dye due to lack of dye and adsorbent ratio.
• Adsorption tends to increase with contact time, dose, pH, agitation speed.
• The adsorption process follows second order kinetics and Langmuir
isotherm.
• There is decrease in adsorption with the increase in initial dye
concentrations due to the high driving force for mass transfer at a high
initial dye concentration.
• Adsorption capacity is found to increase with increase in temperature.
Acknowledgement
• I am extremely grateful to my research supervisor Dr. Soumen Dey, for his
valuable guidance, scholarly inputs and consistent encouragement
throughout the research work.
• I owe a depth of gratitude to Prof. R. K. Dey, H.O.D, all faculty members
and non-teaching staffs of Centre for Applied Chemistry for their valuable
suggestion,ideas and support during the tenure of this project work.
• I want to thank CRF, IIT KGP for SEM analysis.
• I want to thank Dr. Sumit Mishra, faculty BIT Mesra, for her warm
behaviour towards us during our experiments.
• I want thank CSM- CRI, Bhavnager for our experiments.
References
• Ali M & Sreekrishnan TR (2001) “Aquatic toxicity from pulp and paper mill
effluents – a review”. Adv. Environ. Res. 5: 175–1962
• Rajgopalan S, (1995) “Water pollution problem in the textile industry and
control” In: RK (Eds.) Pollution Management in Industries (21–44).
Environmental Publications, Karad., India.
• Koplin DW, et al., (1999–2000) “Pharmaceuticals, hormones and other organic
wastewater contaminants in US streams”, a national reconnaissance Environ.
Sci. Technol. 36(6): 1202–1211
• Raghavacharya C (1997) “Colour Removal from Industrial effluents – A
comparative review of available technologies” Chem. Eng. World 32(7): 53–54.
• Zhang Q & Chuang TK (2001) “Adsorption of organic pollutants of Kraft Pulp
mill on activated carbon and polymer resin”. Adv. Environ. Res. 3: 251–258.
Thanks

Presentation (1).pptx Msc Research Paper

  • 1.
    Rapid removal ofMalachite green dye from aqueous solution using saal flower- A low cost biosorbent
  • 2.
    Biosorption Biosorption can bedescribed as any system where a sorbate (e.g. an atom, molecule, a molecular ion) interacts with a biosorbent (i.e. a solid surface of a biological matrix) resulting in an accumulation at the sorbate – sorbent interface, and therefore a reduction in the solution sorbate concentration. Absorption Adsorption Surface complexation Chelation
  • 3.
    Mechanism The key factorsfor controlling and characterizing these mechanisms are: • The type of biological ligands available for metal sequestering • The status of the biomass, i.e. living /non-living; • The chemical, stereochemical and coordination characteristics of the targeted metals and metal species • Growth and nutrition of biomass • Surface area to volume ratio • Physical and chemically treated • The characteristics of the metal solution such as pH and the presence of competing ions.
  • 4.
    Absorption • Absorption isa physical or chemical phenomenon or a process in which atoms, molecules or ions enter some bulk phase –gas, liquid or solid material. This is a different process from adsorption, since molecules undergoing absorption are taken up by the volume, not by the surface (as in the case for adsorption). A more general term is sorption, which covers absorption and adsorption Absorption is a condition in which something takes in another substance.
  • 5.
    Adsorption It is aadhesion of atoms, ions, bio molecules or molecules of gas, liquid and dissolved solid to a surface and creates a film of adsorbate on the surface of adsorbent. Types: 1. Physisorption 2.Chemisorption
  • 6.
    Lemon peel Qmax -43.45 mg/g, Equilibrium time- 24 hours, % removal- 100 %, Monolayer adsorption Banana pseudo stem fibres Equilibrium time- 60 minutes, % removal- 80%, pH is directly proportional to the dye removal Orange peel Qmax -65.88mg/g , Equilibrium time- 120 minutes, % removal- 70% , Maximum adsorption occurs at pH- 7 Literature review
  • 7.
    Wheat bran Qmax -24mg/g, Equilibrium time - 40 minutes, % removal- 90%, pH –( 4-7) Saw dust Treated with formaldehyde and sulphuric acid, Equilibrium time- 3 hours, % removal- 92%, pH has no such effect Hydrilla verticillata Qmax -91.97mg/g, Equilibrium time- 200 minutes, % removal- 66%, Highly efficient at 318K
  • 8.
    About Malachite green •λmax= 617 nm • Cationic dye • pH sensitive (green colour arises between pH (3-11) • Green crystal • Soluble in ethanol, methanol, amyl alcohol and water • Highly toxic to mammalian cells and liver tumor enhancing agent • Produces hazardous product when heated to decomposition • [4-[[4-(dimethylamino)phenyl]- phenylmethylidene]cyclohexa-2,5-dien-1- ylidene]-dimethylazanium;2-hydroxy-2- oxoacetate;oxalic acid • Chemical formula : C52H54N4O12 (dimer)
  • 9.
    About saal flower(SF) • Scientific name – Shorea robusta • Kingdom- Plantae • Order- Malvales • Family- Dipterotarpaceae • Genes- Shorea • Species- S- robusta • Colour- Yellow • Native- Indian subcontinent ranging south of the Himalaya from Mynamar in the east to Nepal , India and Bagladesh. • Seasonal flower ( March- April) • No productive use
  • 10.
  • 11.
    Treatment of adsorbent Collectionof raw materials Washing and drying Reflux and grinding Carbonisation
  • 12.
    This study iscarried in batch for optimum result. Here we can determine the adsorption capacity of an adsorbate. The removal rate of adsorbate mainly depend upon the force of driving the rate of the adsorption and solution concentration as physical parameters and surface area, porosity of adsorbent as morphological parameters, acidity or basicity nature of adsorbent also important parameters qe = (C0-Ce)* V/W qe = amount adsorbed in equilibrium (mg/g) C0 = initial adsorbate concentration (mg/L) Ce= adsorbate concentration at equilibrium (mg/L) V= volume of aqueous phase (ml) W= amount of adsorbent use (mg)
  • 13.
  • 14.
  • 15.
    Conduction of experiments ExperimentsDose(g) Concentration(ppm) Time (min) Shaking speed (RPM) Contact time 0.2 10 varied 150±2 Dose Varied 10 10 150±2 Agitation speed 0.2 10 10 varied Kinetics 0.2 10 varied ( interval of two minutes) 150±2 Dye concentration 0.2 varied 10 150±2 pH 0.2 10 (with different pH) 10 150±2 Interfering ions 0.2 10( with different radicals) 10 150±2
  • 16.
    Experimental section Conditions: Concentration- 10ppm Dose-0.2 g Time-10 minutes Agitation speed- 150 ±2 RPM Temperature- 25±2 °C Adsorbate (Malachite green) Adsorbent (saal flower) Batch experiment
  • 17.
    Effect of contacttime Equilibrium is achieved in 20 minutes
  • 18.
    Effect of adsorbentdose Maximum adsorption was found at 0.6g. After that no more further adsorption takes place
  • 19.
    Effect of pH Athigher pH it shows more efficiency
  • 20.
    Effect of initialconcentration Dye concentration is indirectly proportional to the % removal of the dye.
  • 21.
    Effect of interferingions Anions shows more interfering property than cations.
  • 22.
    Effect of particlesize No significant effect on particle size
  • 23.
    Effect of agitationspeed Agitation speed is directly proportional to the removal % of the dye
  • 24.
    Effect of predrying temperature Maximum adsorption occurs at 343 K hence pre drying temperature is inversely proportional to adsorption
  • 25.
  • 26.
    By comparing allthe above four graphs we can say that second order kinetics follows here due to their R2 value which is 0.999
  • 27.
    Adsorption isotherm (Langmuir) TemperatureQmax (mg/g) b (L/mg) R2 298K 8.196 0.69 0.990 308K 10.20 0.389 0.98 (ppm)
  • 28.
    Adsorption isotherm (Freundlich) Temperature (K) Kf(mg/g) 1/n R2 298 14.45 0.67 0.988 308 7.24 0.71 0.912
  • 29.
    Column study This isone of the important parameter to Know adsorptive capacity of an adsorbent using a column. Total dye solution was passed = 21 L Bed volume - 128ml/cm3 Adsorbent dose – 7g Concentration – 5 ppm
  • 30.
    FTIR FTIR of SFbefore adsorption FTIR of SF after adsorption
  • 31.
    SEM SEM of SFbefore adsorption SEM of SF after adsorption
  • 32.
    Proximate analysis This analysiscomprises of moisture content, ash content , volatile matter and % carbon present in our sample. Proximate analysis Result in % Moisture content 5.56 Ash content 70.10 Volatile matter 1.16 Carbon content 22.73
  • 33.
    Conclusion • SEM exhibitedthat SF had a considerable number of pores for adsorption and also there is no significantly change in the surrface toporaphy of SF before and after adsorption of dye due to lack of dye and adsorbent ratio. • Adsorption tends to increase with contact time, dose, pH, agitation speed. • The adsorption process follows second order kinetics and Langmuir isotherm. • There is decrease in adsorption with the increase in initial dye concentrations due to the high driving force for mass transfer at a high initial dye concentration. • Adsorption capacity is found to increase with increase in temperature.
  • 34.
    Acknowledgement • I amextremely grateful to my research supervisor Dr. Soumen Dey, for his valuable guidance, scholarly inputs and consistent encouragement throughout the research work. • I owe a depth of gratitude to Prof. R. K. Dey, H.O.D, all faculty members and non-teaching staffs of Centre for Applied Chemistry for their valuable suggestion,ideas and support during the tenure of this project work. • I want to thank CRF, IIT KGP for SEM analysis. • I want to thank Dr. Sumit Mishra, faculty BIT Mesra, for her warm behaviour towards us during our experiments. • I want thank CSM- CRI, Bhavnager for our experiments.
  • 35.
    References • Ali M& Sreekrishnan TR (2001) “Aquatic toxicity from pulp and paper mill effluents – a review”. Adv. Environ. Res. 5: 175–1962 • Rajgopalan S, (1995) “Water pollution problem in the textile industry and control” In: RK (Eds.) Pollution Management in Industries (21–44). Environmental Publications, Karad., India. • Koplin DW, et al., (1999–2000) “Pharmaceuticals, hormones and other organic wastewater contaminants in US streams”, a national reconnaissance Environ. Sci. Technol. 36(6): 1202–1211 • Raghavacharya C (1997) “Colour Removal from Industrial effluents – A comparative review of available technologies” Chem. Eng. World 32(7): 53–54. • Zhang Q & Chuang TK (2001) “Adsorption of organic pollutants of Kraft Pulp mill on activated carbon and polymer resin”. Adv. Environ. Res. 3: 251–258.
  • 36.