Downloaded 50 times
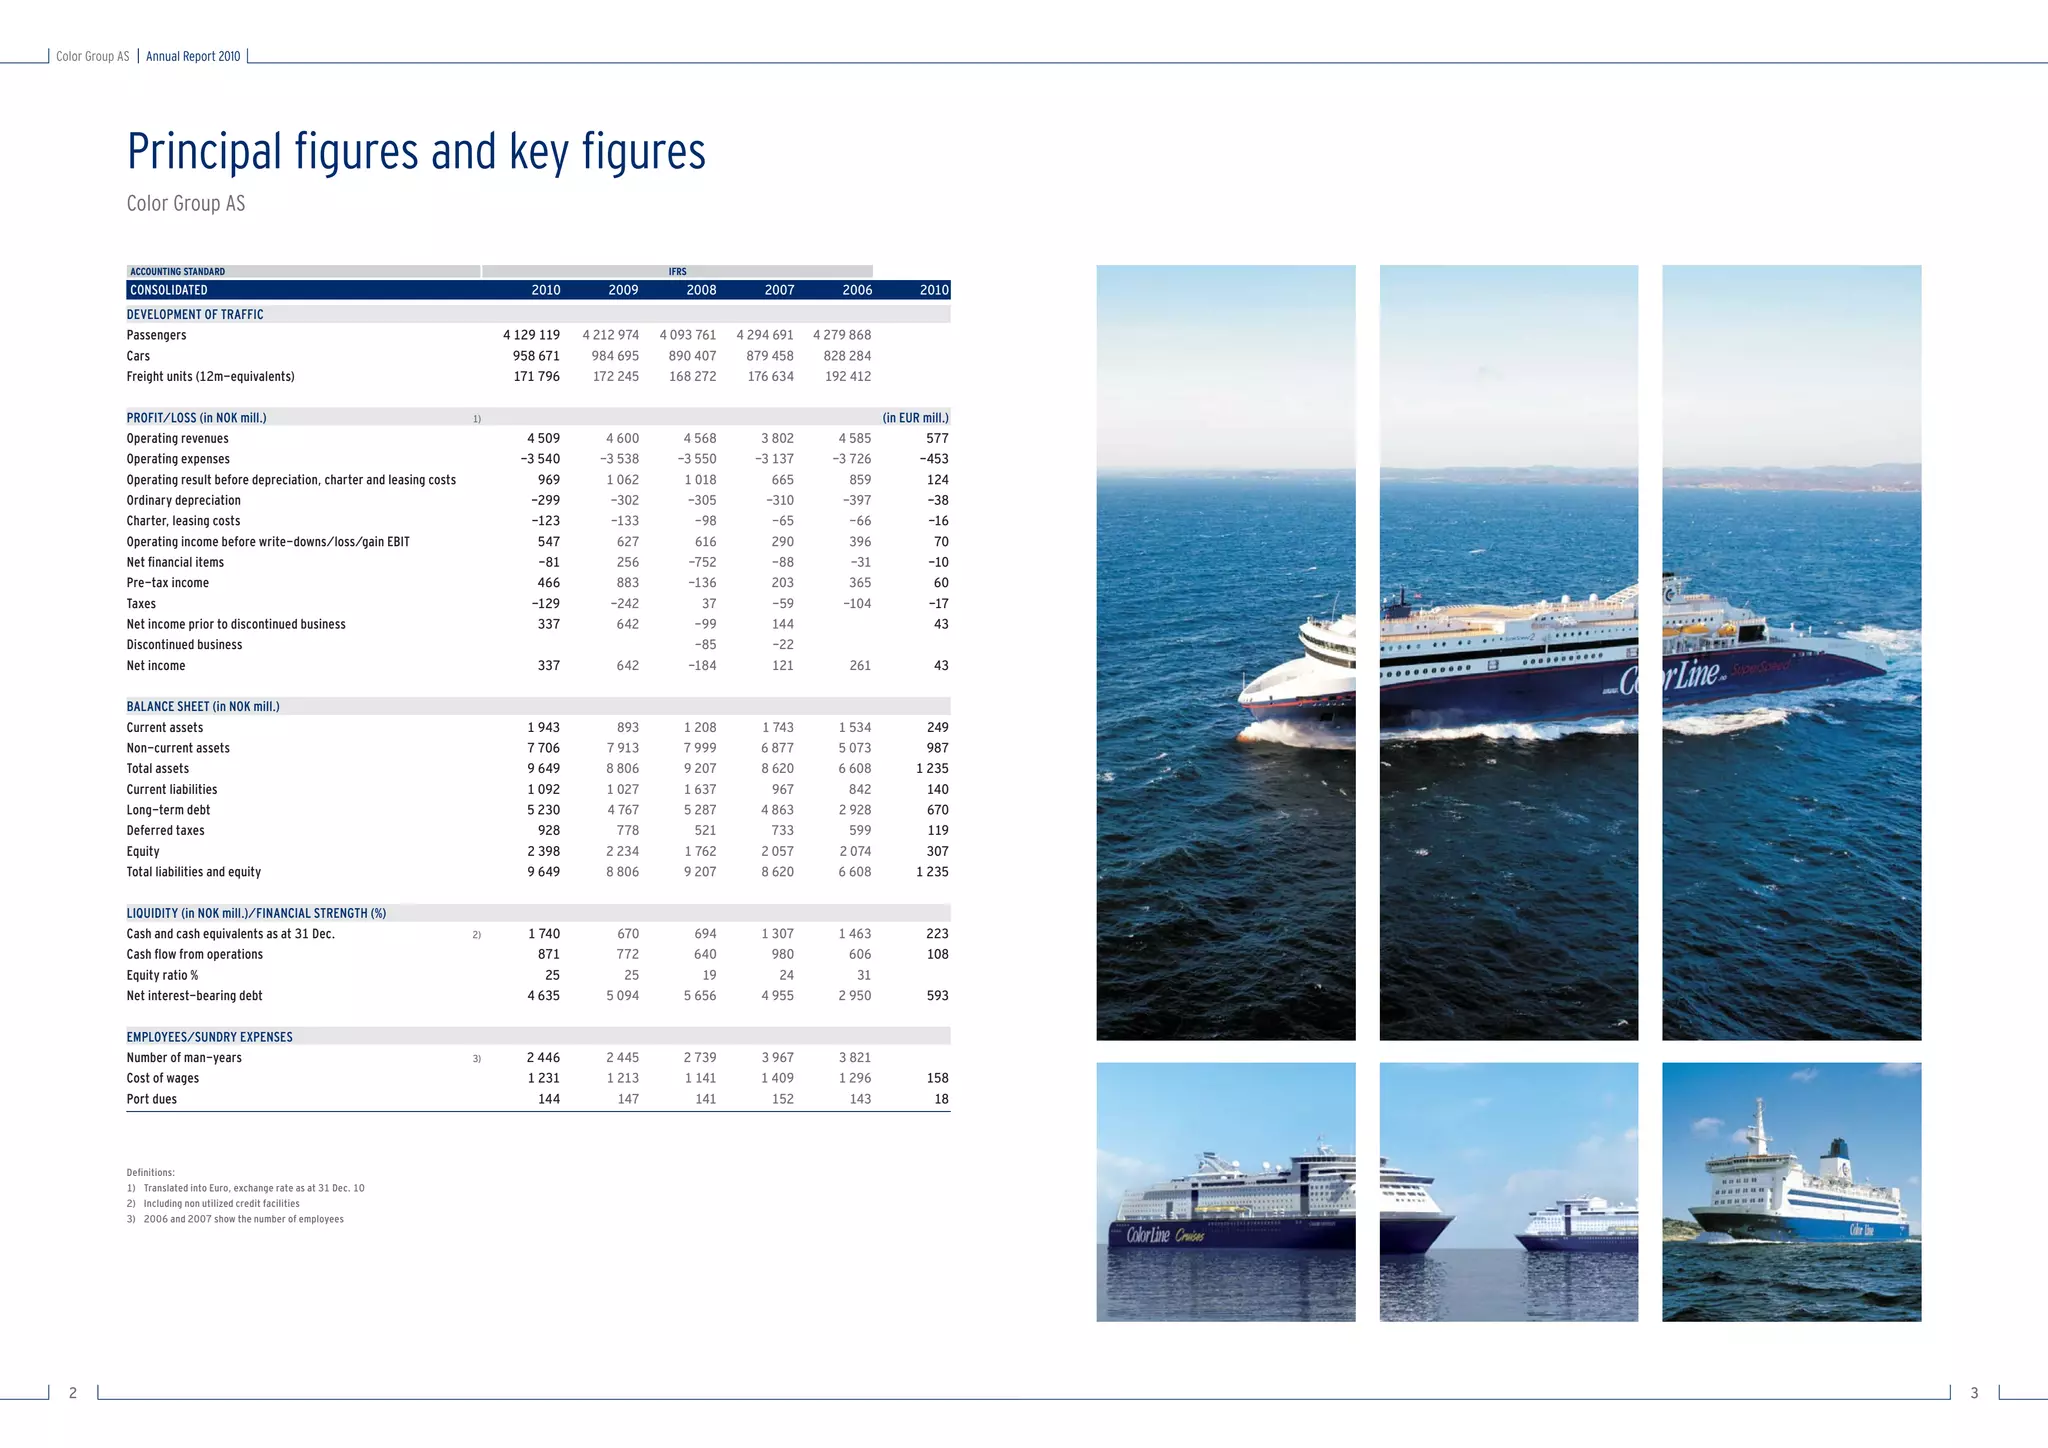
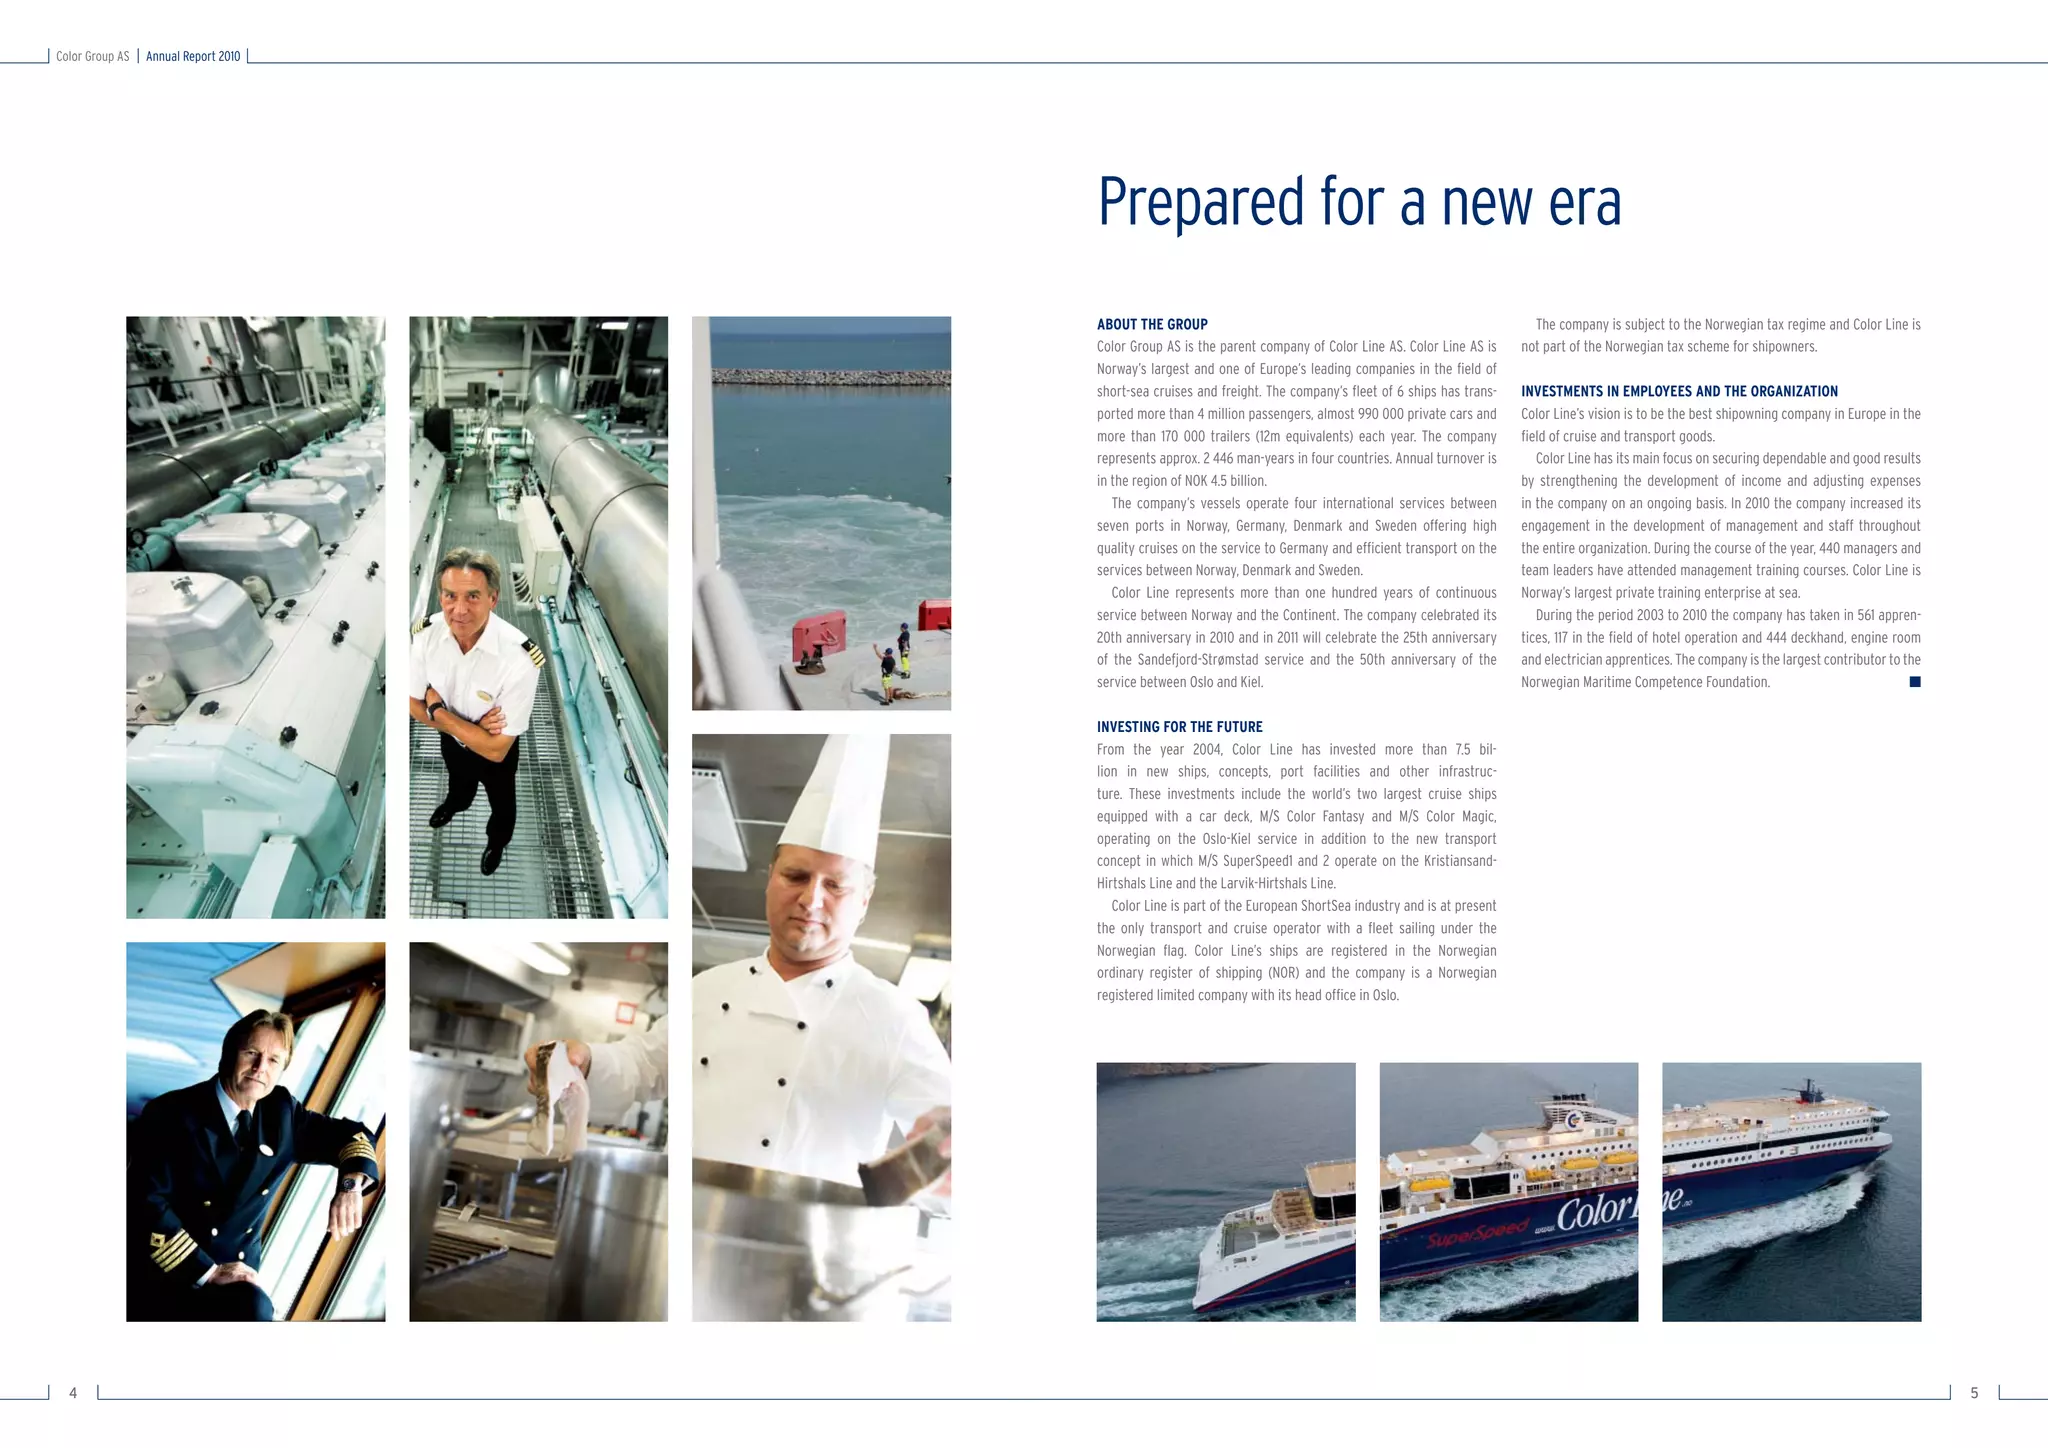
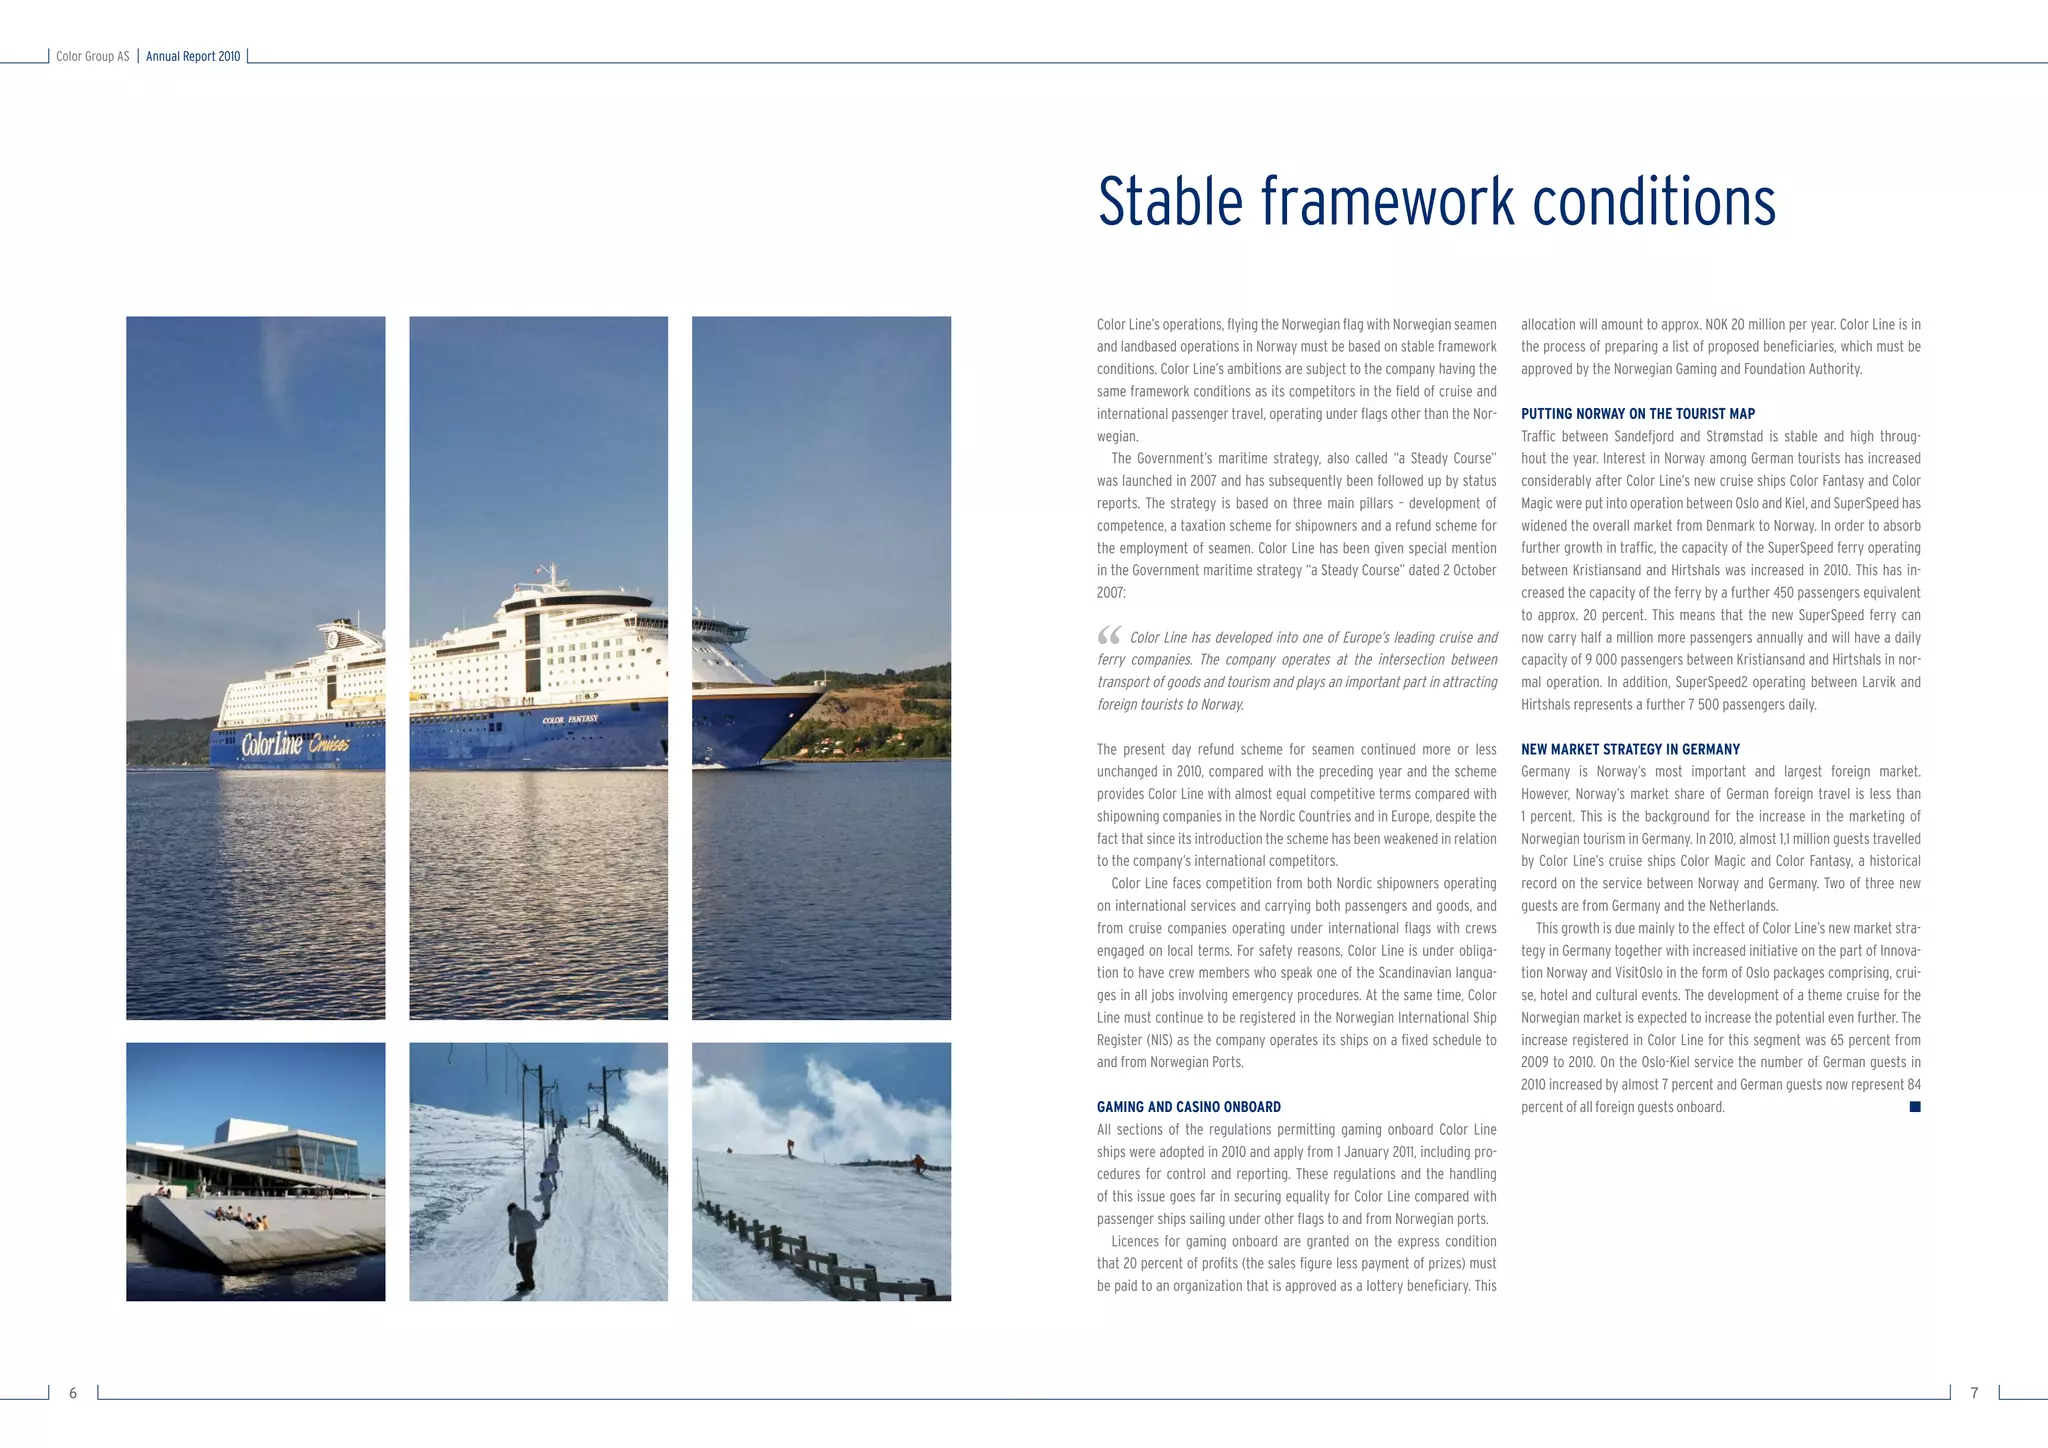

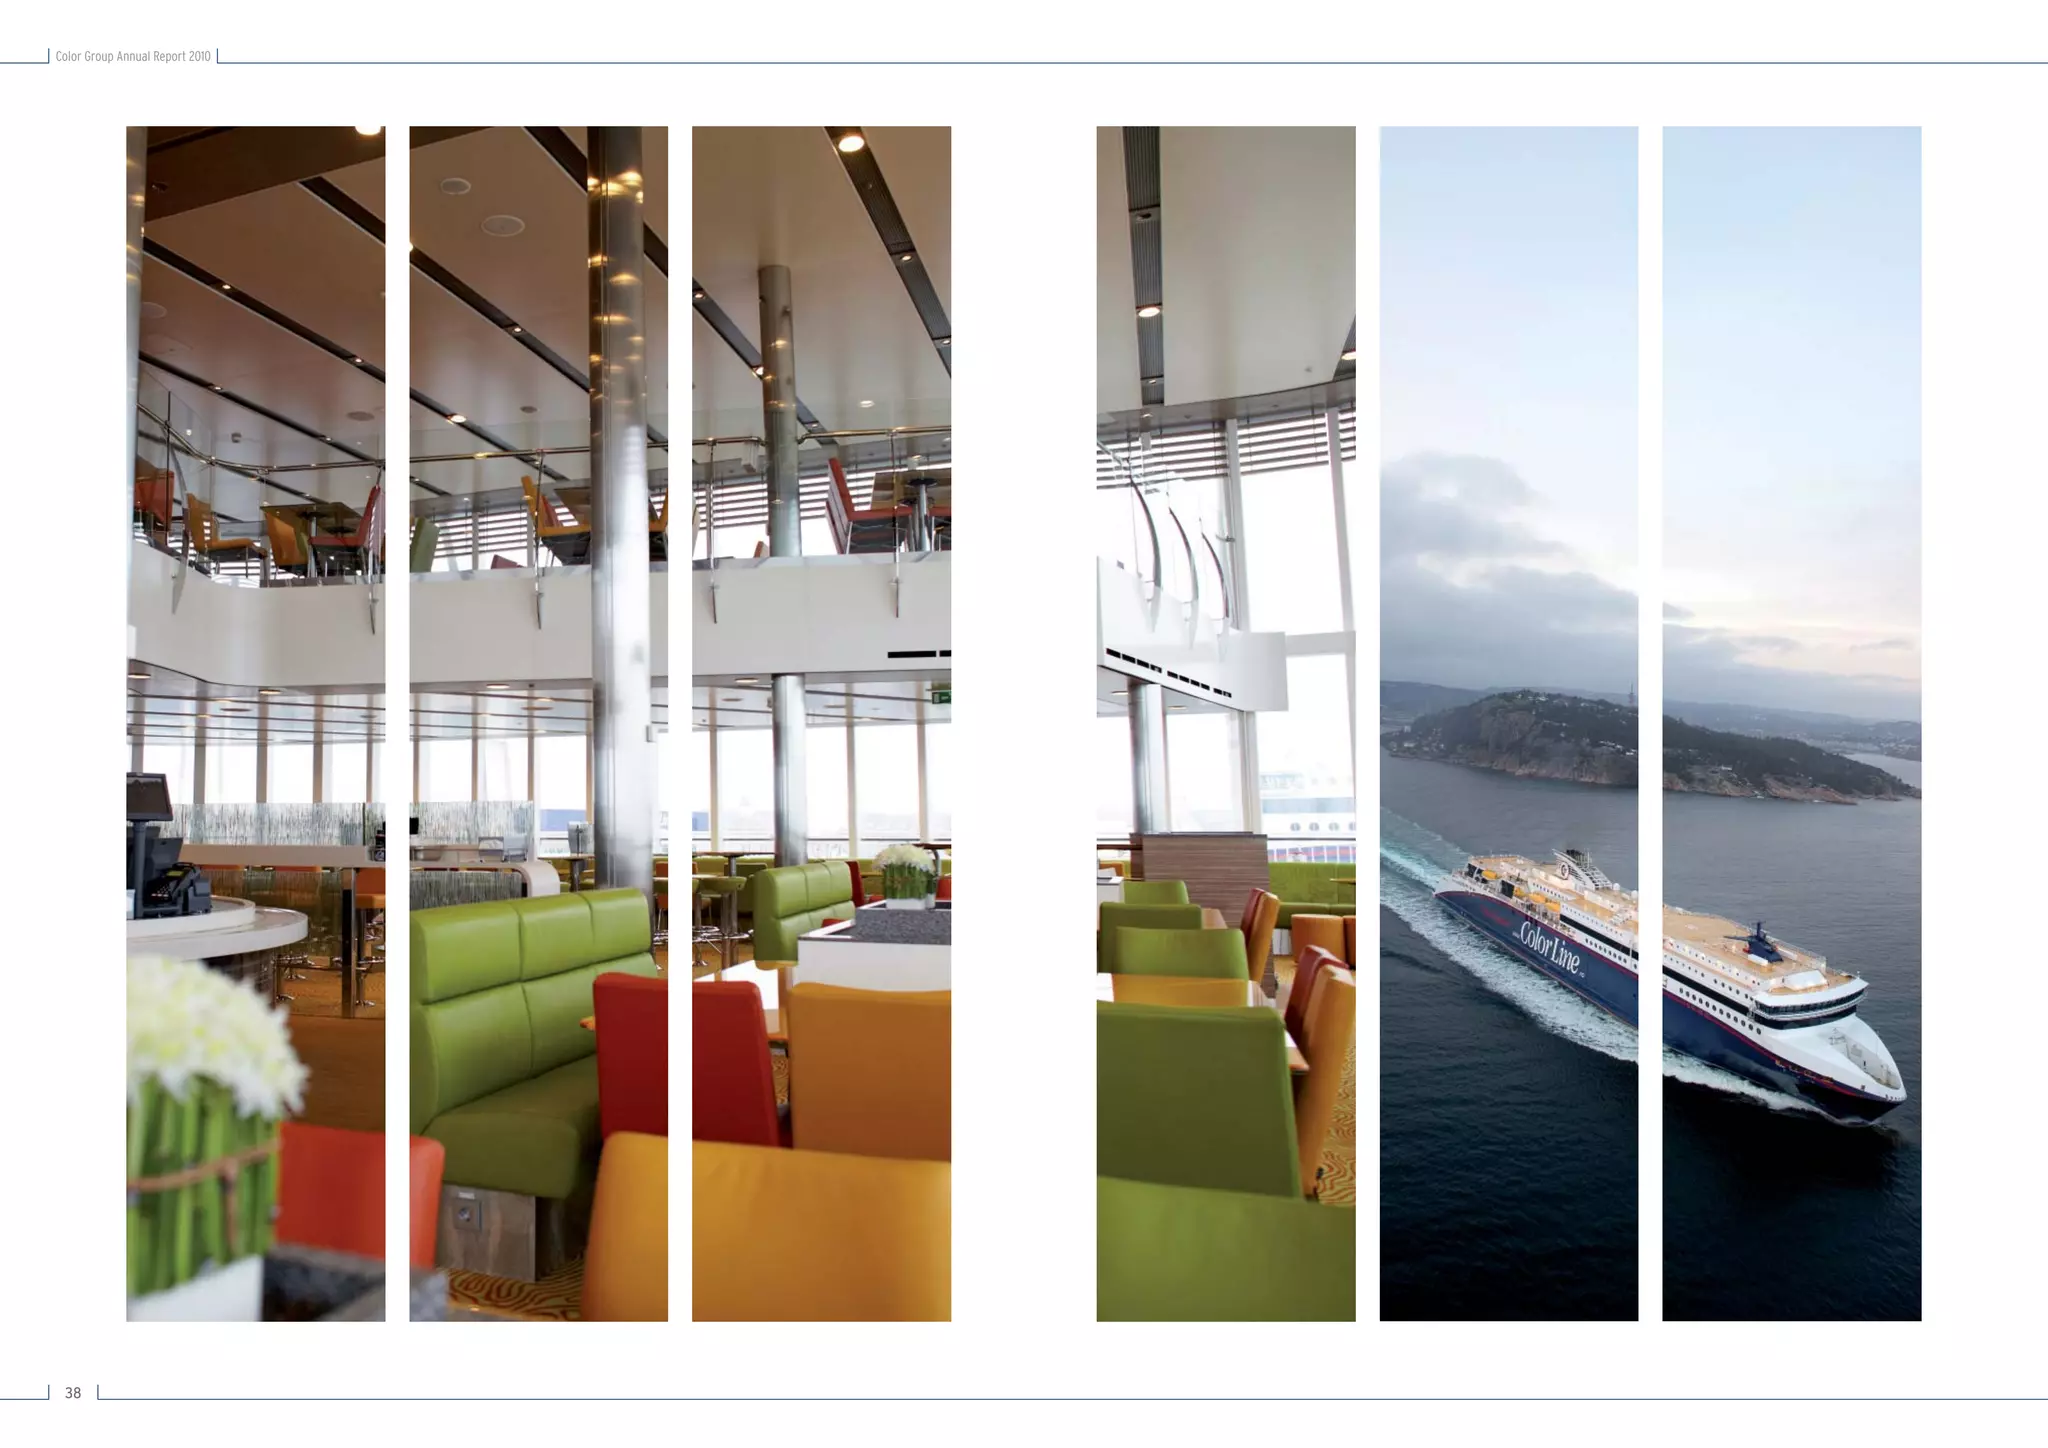
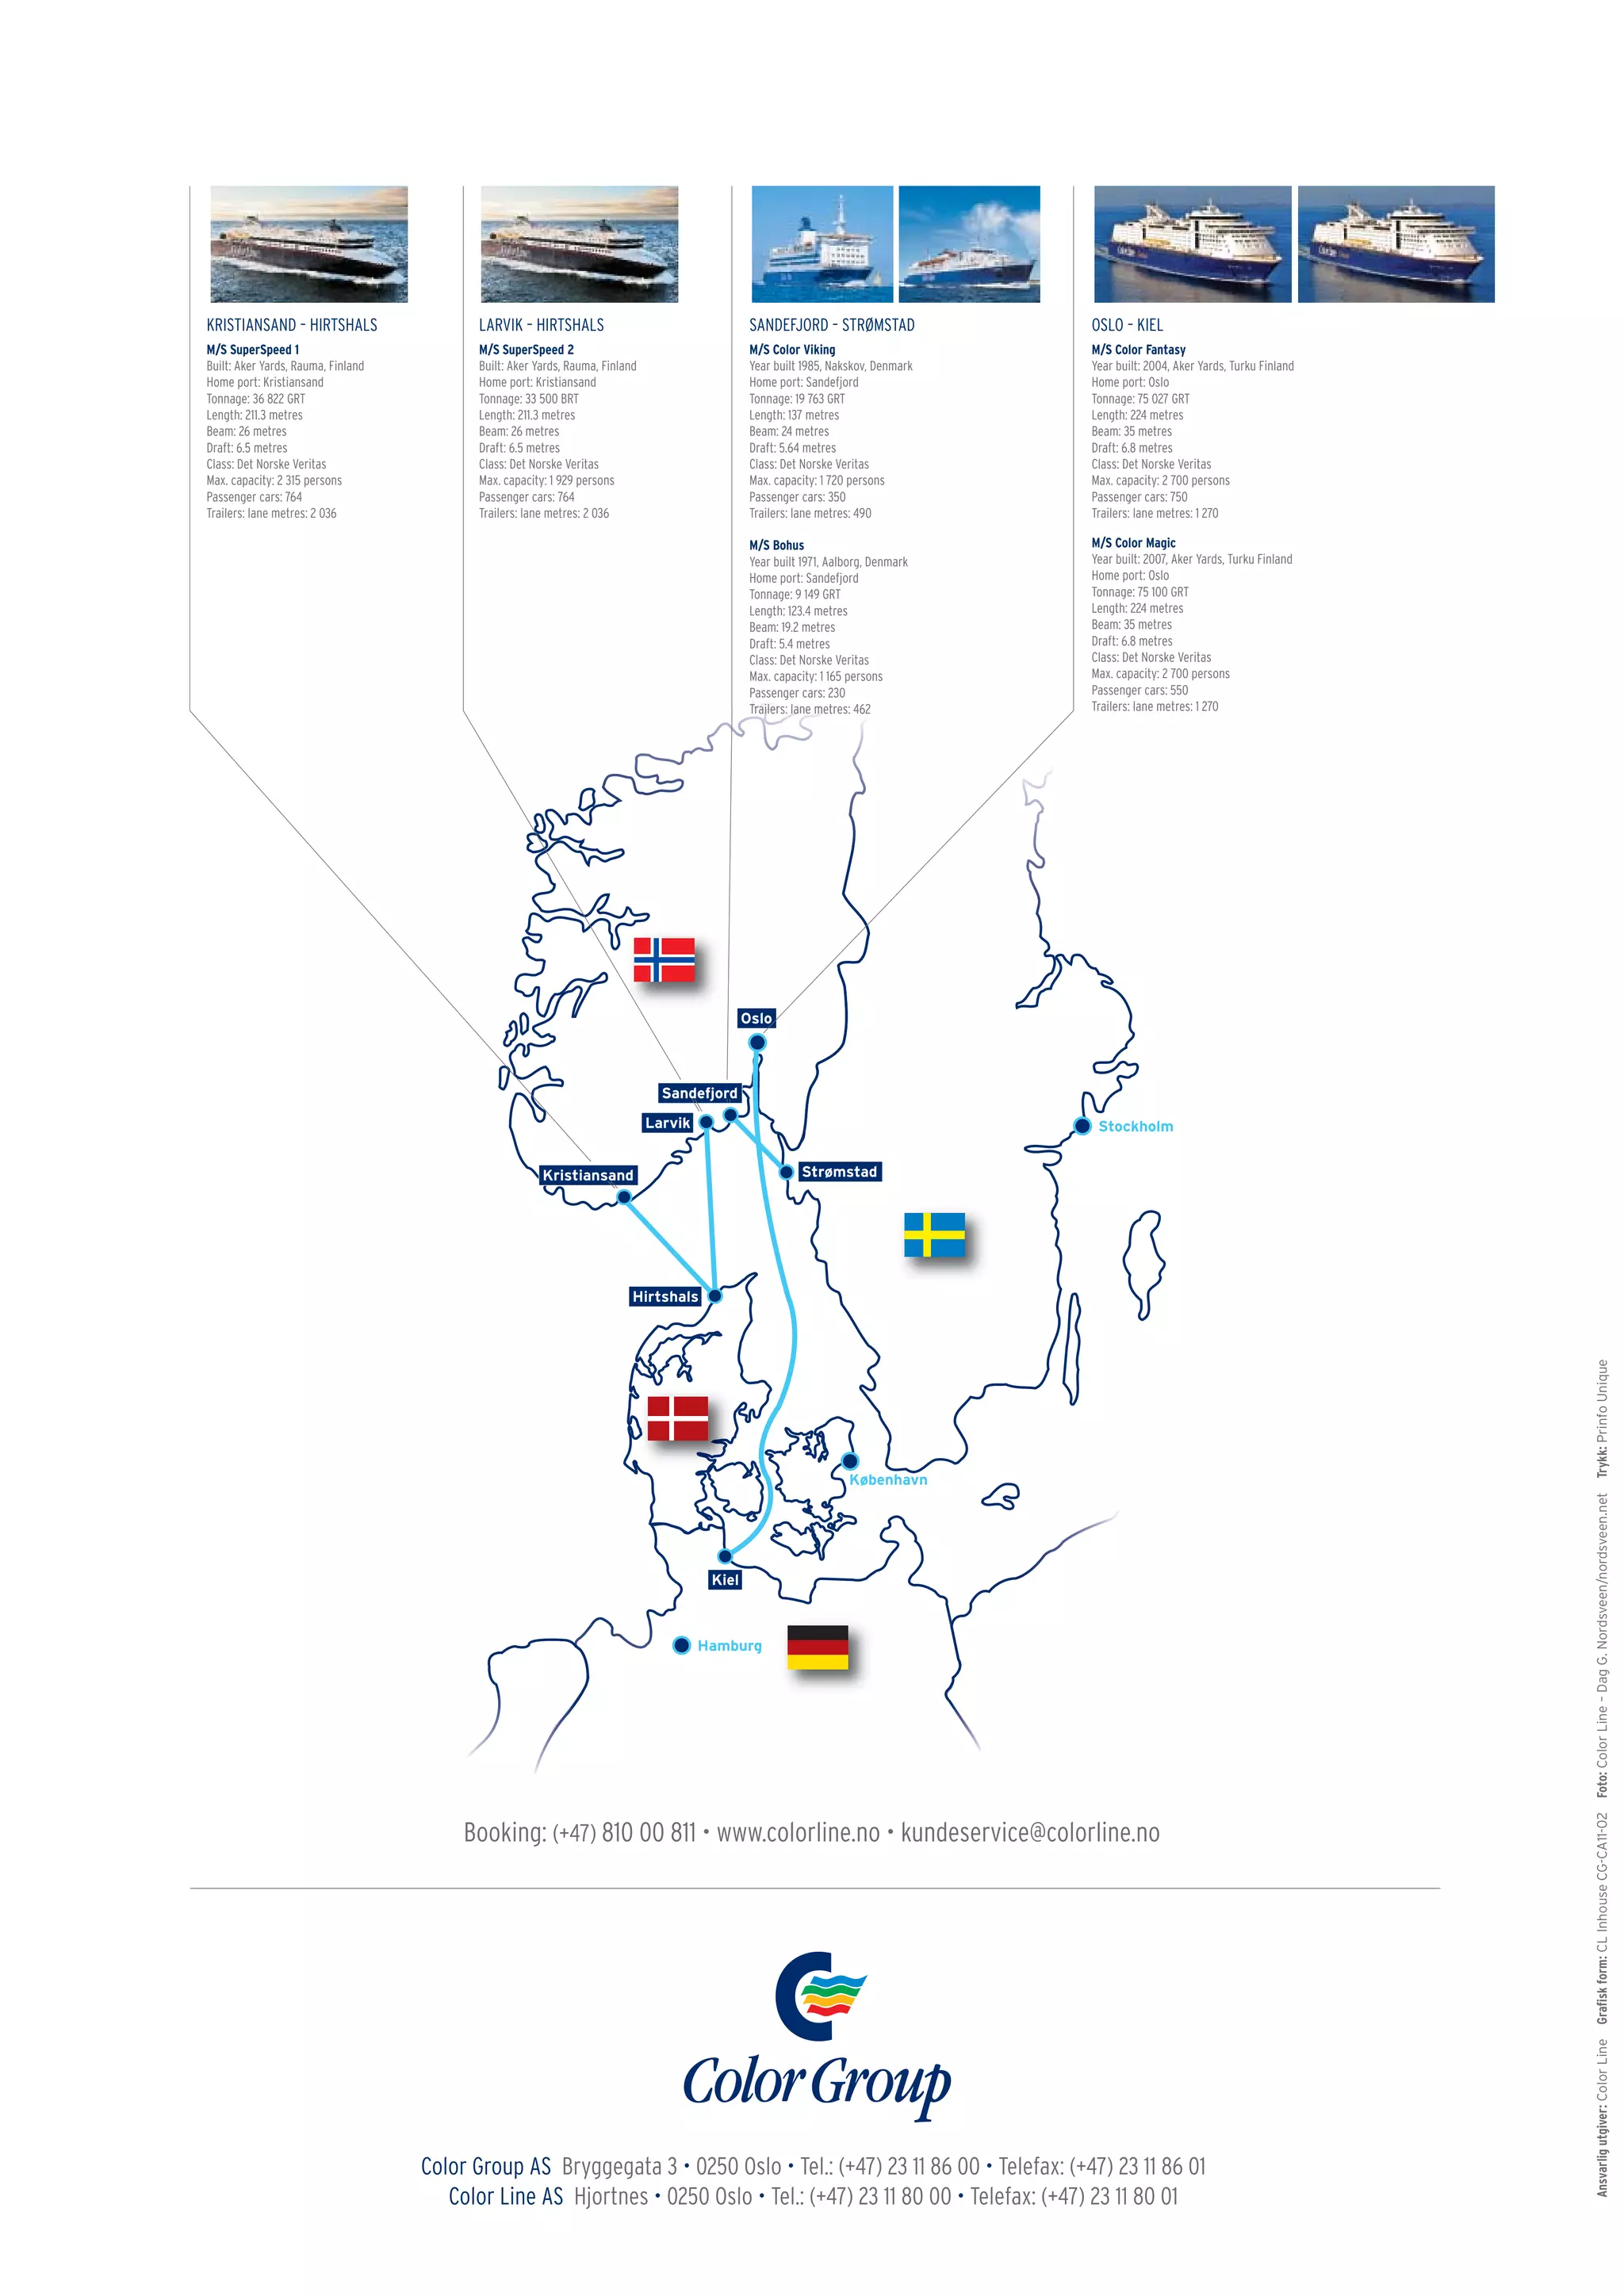

Color Group AS is the parent company of Color Line AS, Norway's largest short-sea cruise and freight company operating four international ferry services between Norway, Germany, Denmark and Sweden. In 2010, Color Line transported over 4 million passengers, nearly 1 million cars, and over 170,000 trailers. The company has invested over 7.5 billion since 2004 in new ships, ports, and infrastructure to modernize its fleet. Color Line had annual revenues of approximately 4.5 billion NOK in 2010 and employs around 2,446 people across four countries.