6. Highlights
Revenue 18% R45 262m
Operating profit 12% R2 939m
HEPS 14% 829 cps
Core EPS * 15% 872 cps
Interim dividend per share 27% 380 cps
Good result overall - varied across the group
*Core EPS mainly excludes :
• amortisation of intangibles on acquisitions in the current period
• business acquisition costs (mainly in the prior period)
Dividend pay out ratio of approximately 44% of Core EPS; rolling dividend yield of 3,8% based on
22/2/2013 price of R200 per share
6
7. Business conditions in key markets
» Trading conditions challenging in SA and Europe
» Industrial action in SA and Korea impacted the group
» Slower growth in the SA motor vehicle market
» Increasing demand for affordable vehicles
» Volumes and pricing under pressure in SA Logistics
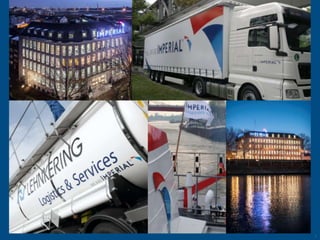
• Especially in manufacturing industry
» German economy slowing
» Competition in car rental industry remains fierce
» Insurance underwriting conditions in short term industry were more challenging;
equity markets were favourable
» Current cycle in the motor industry favours our Financial Services division
7
8. Imperial’s performance during the period
» Good first half result
» Good portfolio effect
» Retail cluster of businesses performed well
» Strong growth was achieved in annuity revenue streams generated from after-sales
parts, service and financial services
» Aftermarket parts, components and industrial equipment businesses continue to grow
» SA Logistics and International Logistics were under pressure
• Strike and volume pressure in SA; Slowing German economy
» Excellent growth in rest of Africa logistics; operating profit up 22%
» Acquisition of RTT Health Sciences will contribute significantly to our distribution
footprint in Africa
» Strong cashflow, cash generated by operations up 111%
» Balance sheet strong – net debt/equity ratio of 52% (excl. prefs)
» Excellent returns : ROE = 22% (annualised)
8
9. Performance of the three business pillars
Distribution, Retail &
Logistics Car Rental & Tourism
Financial Services
Revenue = R15,9 bn Revenue = R1,9 bn Revenue = R28,9 bn
-1%
27% 14%
Operating profit = R707m Operating profit = R183m Operating profit = R2,1 bn
-1% -13%
19%
The Three Pillars of Imperial
9
10. Group profit trend
Revenue (LHS) Operating Profit (RHS)
3.0 2.9
60
2.6 3
2.4
2.1
40 1.8 45.3
42.4 2
Rbn
1.3 1.4 38.4
31.4 33.3
20 25.7 27.8
1
23.6
0 0
June 09 Dec 09 June 10 Dec 10 June 11 Dec 11 Jun 12 Dec 12
Core EPS HEPS
867 839 872
900 829
725 756 727
653 645
581
600 503 533
cps
472
431
269 283
300
0
June 09 Dec 09 June 10 Dec 10 June 11 Dec 11 Jun12 Dec 12
10
13. Southern Africa logistics
Revenue (Rm) Operating profit (Rm) Operating Margins
+4% -22%
6.2%
4.9%
8,677 4.6%
8,311
513
400
H1 2013 H1 2012 H1 2013 H1 2012 H1 2013 H2 2012 H1 2012
Challenging trading conditions in SA, Rest of Africa strong
» Strike had a material impact across all South African businesses
» Volumes and rates, especially in manufacturing were depressed
» Rest of Africa business performed well and continues to grow – operating profit up 22%
» RTT health sciences will contribute significantly to distribution footprint in Africa
13
14. Southern Africa logistics
Revenue by activity Revenue by sector
49%
36% 38%
17%
8% 10%
Steel and Metals 2% 15%
26%
Consumer Goods & Retail
Freight & Transport
Industrial Products
Warehousing & Distribution
Construction
Supply Chain Management Chemicals, Fuel & Gas
Mining & Agriculture
14
15. Revenue split between SA and ROA
» Rest of Africa expansion gaining momentum
» Revenue up 24%; Operating profit up 22%
» RTT Health Sciences acquisition will contribute further – approximately R240m p.a of
revenue generated in rest of Africa
4% 5% 5%
18% 23% 26%
96% 95% 95%
82% 77% 74%
Rest of Africa
South Africa
F2008 F2009 F2010 F2011 F2012 H1 2013
15
19. International logistics
Revenue by sector
18%
29%
11%
2%
2%
4%
16%
5%
12%
Chemicals Steel
Automotive Energy
Paper/Packaging Agricultural Imperial Shipping Group
Imperial Shipping Group
Food Other Lehnkering
Lehnkering
Services Panopa
Panopa
Neska
Neska
Brouwer Shipping
Brouwer Shipping
19
20. German chemical production
LEHNKERING
Production Index (2005 = 100)
Specialised chemical and liquid food
warehousing, distribution and contract
manufacturing business. Shipping and
Steel have been incorporated into Imperial
Shipping and Panopa 125
126
» Strong footprint in chemical industry
118
» Combination of logistics, value added
services & outsource manufacturing 115
112 113
» Approximately 76% of revenue in
contract manufacturing from 104 109
Agrochemicals industry 106 104
105
» Agrochemicals industry historically 102 102
resilient to economic downturns
97
95
87
85
2005 2006 2007 2008 2009 2010 2011
Total Chemicals mkt Agrochemicals
Source: VCI Chemical Industries Association
24. Distributorships
Revenue (Rm) Operating profit (Rm) Operating Margins
+17% +13%
8.8% 8.6%
1 316 8.3%
15,843
1,162
13,590
H1 2013 H1 2012 H1 2013 H1 2012 H1 2013 H2 2012 H1 2012
Performed well
» Excellent revenue growth mainly due to improved after sales
» Impacted by supply disruptions due to strike experienced by our principals in Korea
• Lower inventories
• Sub-optimal supply mix, which impacted margins
» Strong growth in used car sales
» Margins also impacted by weaker currency
» NAC disposal concluded on 15 February 2013 – R433m capital released
24
26. South African new vehicle sales
» Fundamentals continue to be good
• Good levels of credit availability
• Low interest rates
• Still below peak of 2006
• Underpenetrated market relative to developed world – in line with emerging market peers
Passenger car sales Vehicle penetration in SA
(units) (units per 1 000 people)
(000’s)
500 700
600
400
500
300 400
300 In-line with World (ex.China)
200 20% premium to world
200
100 100
0
0
World
Turkey
Ukraine
Australia
Germany
Hungary
Japan
Chile
Italy
Spain
Poland
Thailand
UK
US
Taiwan
Russia
South Africa
China
South Korea
Brazil
India
Czech Republic
New Zealand
France
Argentina
World (ex China)
Indonesia
Mexico
Malaysia
1976
1978
1980
1982
1984
1986
1988
1990
1992
1994
1996
1998
2000
2002
2004
2006
2008
2010
2012
Source: NCR, SBG Securities Source: NCR, SBG Securities
26
27. Vehicle affordability good
» Debt servicing costs have declined
» Consumers are changing their cars much earlier
» Will support demand
Debt service cost as a percent of Replacement cycles getting shorter
disposable income (loan duration)
14% 50
12% 45
10%
40
8%
35
6%
4% 30
Used
2% 25
New
0% 20
Apr-06
Jul-06
Oct-06
Apr-07
Jul-07
Oct-07
Apr-08
Jul-08
Oct-08
Apr-09
Jul-09
Oct-09
Apr-10
Jul-10
Oct-10
Apr-11
Jul-11
Oct-11
Apr-12
Jul-12
Oct-12
Jan-06
Jan-07
Jan-08
Jan-09
Jan-10
Jan-11
Jan-12
Jan-13
Debt service cost as % of disposable income
Source: NCR,UBSe Source: Wesbank,UBSe
27
28. Vehicle affordability good
» New car prices have lagged inflation
» Weaker currency poses a risk but low interest rates will assist
New Car Pricing vs Used Car Pricing vs CPI (Jan 2002 = 100)
190
― New Car Pr Index Jan 2002 = 100
180 ― Used Car Pr Index Jan 2002 = 100
― CPI Jan 2002 = 100
170
160
150
Index
140
130
120
110
100
90
Jan-…
Jan-…
Jan-…
Jan-…
Jan-…
Jan-…
Jan-…
Jan-…
Jan-…
Jan-…
Jan-…
Jan-11
Jul-11
Jul-04
Jul-02
Jul-03
Jul-05
Jul-06
Jul-07
Jul-08
Jul-09
Jul-10
Jul-12
Jul-13
Source: NAAMSA, Stats SA, I-Net Bridge, SBG Securities
28
29. Automotive parts and industrial products
Revenue (Rm) Operating profit (Rm) Operating Margins
+11% +16% 7.3%
7.0% 7.5%
3,862 282
3,477 243
H1 2013 H1 2012 H1 2013 H1 2012 H1 2013 H1 2012 H2 2012
» Overall margin improvement evident
» Contributed R3,9bn of turnover and R282m of operating profit
» Autoparts performed satisfactorily in a sluggish market
» Goscor and newly acquired Datadot performed well
» Continue to pursue strategy of adding new areas of distribution
» Afintapart (commercial vehicle parts distributor),added to the portfolio
Includes: Jurgens, Beekmans, Midas, Alert, Goscor, EZ-GO, Bobcat, Sedgeway, Datadot, NAC
29
31. Automotive Retail
Revenue (Rm) Operating profit (Rm) Operating Margins
+11% +15% 3.2%
2.7% 2.6%
10 926
9,877
299
261
H1 2013 H1 2012 H1 2013 H1 2012 H1 2013 H2 2012 H1 2012
Good growth in operating profit
» New vehicle unit sales 9% up; in line with the industry
» Used vehicle sales improved; good growth in part sales
» In the UK, truck dealerships performed well in market that remained depressed
» Beekman Canopies’ showed good growth; volumes at Jurgens flat
31
34. Financial services
» Excellent performance
» Regent Life solid, with gross written premiums up 20%
» Adcover, Paintech and Warranties performed well and showed good growth
» Overall underwriting margin declined to 7,2% but up on H2 2012
» Affected by severe weather
» Investment returns higher; larger exposure to equity markets which were favourable
» Botswana and Lesotho continue to grow; operating profit doubled
» Other Financial Services performed well; growth in new maintenance plans
» Release from maintenance funds significantly higher due to change in estimate
» Strong growth in finance JV’s and new maintenance plans provides valuable annuity
earnings underpin for future profits
34
36. Income statement
Rm H1 2013 H1 2012 % Change
Revenue 45 262 38 385 18%
» Logistics: +27%; growth mainly from Germany; Lehnkering acquisition
» Distributorships: +17%; good growth in annuity revenue streams and used cars
» Automotive Retail: +11%; increased new vehicle unit sales
» Financial Services: +18%; current auto cycle favours Financial Services division
Revenue contribution per division
H1 2013 H1 2012
5% 5%
19% SA logistics
21%
23% International Logistics 25%
Car Rental and Tourism
15% 10%
Distributorships
5%
4% Automotive Retail
34% 34%
Financial Services
36
37. Income statement
Rm H1 2013 H1 2012 % Change
Revenue 45 262 38 385 18%
Operating profit 2 939 2 621 12%
Operating profit margin 6,5% 6,8%
» Strike had an adverse impact in SA Logistics; Car Rental and tourism margins under pressure
» Volume pressure in International Logistics; slower German economy
» Insufficient supply of inventories due to strike in Korea impacted product mix in Distributorships
adversely
» Margin improvement in Auto Retail and Financial Services
Operating profit contribution per division
H1 2013 H1 2012
17% SA logistics 13%
14% 18%
International Logistics 10%
10%
10% Car Rental and Tourism 8%
6%
Distributorships 8%
Automotive Retail
43% 43%
Financial Services
37
38. Divisional statistics
Revenue Operating profit
5% SA logistics
19% 17% 14%
23% International Logistics
10%
Car Rental and Tourism 10%
15% 6%
Distributorships
4% Automotive Retail
34% 43%
Financial Services
Operating margin % 22.7
18.8
10.8
9.5
8.3 8.6
6.2
4.6 4.3 4.9
2.7 2.6
SA Logistics International Car Rental and Distributorships Automotive Retail Financial Services
Logistics Tourism
H1 2013 H1 2012
38
39. Income statement
Rm H1 2013 H1 2012 % Change
Revenue 45 262 38 385 18%
Operating profit 2 939 2 621 12%
Amortisation of intangible assets (110) (13)
Foreign exchange (losses) / gains 5 -
Business acquisition costs (5) (53)
Recoupments/(impairments) from sale of properties 19 (38)
Gain on sale of financial instruments 10 -
Net financing costs (362) (305) 19%
Income from associates 3 (17)
Tax (703) (664)
Effective tax rate 28% 30%
Net profit for the period 1 787 1 534 16%
Attributable to Imperial shareholders 1 579 1 350
Attributable to minorities 208 184 13%
39
40. Balance sheet
Dec Jun % Dec
Rm 2012 2012 change 2011
Property, plant and equipment 8 545 8 080 6 970
Transport fleet 4 399 4 336 3 999
Vehicles for hire 2 688 2 321 2 587
Intangible assets 4 420 4 234 4% 1 921
Other non-current assets 3 115 2 256 38% 1 976
Investments and loans 3 236 2 433 33% 2 604
Net working capital 5 586 4 607 21% 5 960
Cash resources 2 590 3 545 2 203
Assets 34 579 31 812 28 220
» Net working capital well managed
» Seasonally higher in December compared to June
» Decreased when compared to December 2011 despite 18% revenue growth
40
41. Balance sheet
Dec Jun % Dec
Rm 2012 2012 change 2011
Total shareholders’ interest 16 494 15 889 4% 14 954
Interest bearing borrowings 11 088 9 747 8 099
Other liabilities 6 997 6 176 5 167
Equity and liabilities 34 579 31 812 28 220
» Equity Impacted by:
• Attributable profits – R1 787m
• Exchange gains arising on translation of foreign operations - R251m
• Share buy-back – (R474m)
• Movement in hedge reserve – (R178m)
• Dividend paid – (R877m)
41
42. Gearing
Net debt : equity (excl. prefs) » Excludes R441m of perpetual
%
preference shares
60
50 52
» Net D:E below target ratio of 60% - 80%
39 39
40
31 » Moody’s Ratings:
20 • Domestic short term credit rating P-1.za
• Domestic long term credit rating A2.za
0
F2009 F2010 F2011 F2012 H1 2013 • International scale rating Baa3
» Strong balance sheet
• Higher net debt
o Lehnkering acquisition
o Share buy back (R474m)
o Working capital and hence debt seasonally higher in
Dec than June
• Capacity for further acquisitions and organic
growth
• Group has R3.5bn un-utilised funding facilities
excl asset based finance facilities
42
43. Returns
ROE#
ROIC vs WACC
23.4
24 22.0 16.3
16.5
20.3 15.5
20 15
17.1 10-yr
16 avg. of 11.5 12.2
19% 11
12
9.4 10.9
10.5 10.1
8 9.7
8.9
7
4
0
3
F2013^^
F2009
F2010
F2012
F2011
F2009
F2010
F2011
F2012
H1 2013
# based on core earnings ROIC WACC
^^ annualised
» ROE is healthy » Objective: Average ROIC > than WACC
• More asset-light business mix + 4% through the cycles
• Underpinned by growth in annuity revenue » WACC declined due to share buyback
streams and financial services
and additional finance on Lehnkering
• Strong balance sheet management and focus acquisition
on returns
43
44. Cash flow - summary
Rm 2012 2011
Cash flow from operating activities 1 101 170
Cash flow from investing activities (1 969) (901)
Cash flow from financing activities (1 361) (757)
Shares repurchased (474) -
Dividends paid (877) (620)
Other (10) (137)
(Increase) / Decrease in net debt (2 229) 1 488
Free cash flow – total operations 1 009 186
Free cash conversion ratio 63% 13%
44
47. IMPERIAL re-pledges to make South Africa’s roads safer
Your safety is our concern
IMPERIAL and Europcar put nine patrol vehicles on the N3TC and Bakwena N1/N4 for
your safety.
Giving you peace of mind
IMPERIAL I-Pledge collected 750 car seats in partnership with Lead SA, which were
refurbished and donated over the 2012 festive break.
Changing lives for the better
IMPERIAL is changing the lives of school children by making our roads safer though our
scholars patrol initiative. IMPERIAL will refurbish its Zebra crossings and supply scholar patrol
visibility and kits.
To date, 100 schools have been visited and by the end of September, we will reach
240 schools.
47
51. Strategy
» Focused on generating higher returns on capital
» Seeking growth opportunities in and adjacent to existing industries and geographies
» Focused on expanding our footprint in logistics industry in Africa and abroad
• Specific focus on consumer logistics in Africa
• Europe to expand around existing themes
» Maximizing position in motor value chain
• Scale and experience stands us in good stead
• Enable us to earn ever increasing annuity income streams from financial services and a growing
vehicle parc (parts & services)
» Distribution of products which carry strong brands in the automotive and industrial
markets remain a core focus
» Car Rental and Tourism division offers fewer opportunities for expansion
• Focus will be on improving the returns
» Regent and LiquidCapital to expand product ranges and improve market penetration
51
52. Recent acquisitions and disposals
» Acquisitions during the period
• Midas acquired 80 % of Afintapart SA (Pty) Limited – a commercial vehicle parts distributor
• 60% of LTS Kenzam (Pty) Limited - a logistics business that distributes bituminous products
throughout Southern Africa
• 100% of RTT Health Sciences (rebranded Imperial Health Sciences) – a pharmaceutical
distribution and healthcare supply chain services business, effective January 2013
» Disposals during the period
• 60% of Megafreight, a freight forwarding business; and
• 62% of NAC, the aircraft distributor and aviation services business. The sale of NAC was finalized
on 15 February 2013 and R433m of capital was released
52
53. RTT Health Sciences acquisition
2 110 employees
Medical Trans Africa Consumer Health Essentials
2012 Revenue: 2012 EBITDA: Enterprise value: EV/EBITDA 1st year ROIC*
R1.1bn R101m R515m multiple: 5.1x (incl. goodwill):
10.0%
Earnings enhancing acquisition; meets internal acquisition criteria
* Pre any synergies and amortization of intangibles
53
54. RTT Health Sciences presence in Africa
Presence in 6 Sub – Saharan countries
» South Africa
• Jet Park 30 000m2
• Centurion 26,500 m2
» Rest of Africa
• Kenya
• Nigeria
• Ghana
• Malawi
• Swaziland
» Delivers, through agents to 27 further
countries across Africa
» 2 110 staff members
» 26 Trained pharmacists and pharmacist
assistants
54
55. Rationale for RTT Health Sciences acquisition
» In line with consumer growth
strategy in Africa
» Compliments Imperial Logistics
service offering
» Expansion to the growing Nairobi facility
(Kenya)
Pharma and Healthcare
industries
» Strengthens exposure to high
growth African economies Accra facility Lilongwe facility
(Ghana) (Malawi)
Rental of pallet positions
in a warehouse in Abuja
(Nigeria)
Rental of pallet positions
Countries serviced by RTT Health Sciences
Centurion in a warehouse in
(South Africa) Mbabane (Swaziland)
55
56. Prospects
» Imperial holds leading positions in its main markets
» Trading conditions in SA logistics are challenging
» RTT acquisition will contribute in second half and enhance our capabilities
» African logistics to continue gaining momentum
» International logistics – slow down expected, in line with slowing German economy
» Car rental market to remain competitive
» Growth in new car sales in South Africa expected to moderate further
• Low interest rates and credit availability to support demand
» Growth of Distributorship car parc - increasing annuity income streams from parts and
service activities
» Industrial parts and components will be solid
» Improvement expected in used car market
» Earnings in Financial Services will be robust
» Strong balance sheet will allow us to take advantage of growth opportunities
» Under current conditions subdued growth is expected in 2013 financial year
56