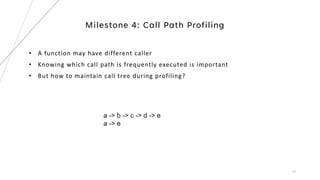
1. The document describes building a source code level profiler for C++ applications. It outlines 4 milestones: logging execution time, reducing macros, tracking function hit counts, and call path profiling using a radix tree.
2. Key aspects discussed include using timers to log function durations, storing profiling data in a timed entry class, and maintaining a call tree using a radix tree with nodes representing functions and profiling data.
3. The goal is to develop a customizable profiler to identify performance bottlenecks by profiling execution times and call paths at the source code level.


![# Overhead Samples Command Shared Object Symbol
# ........ ............ ....... ................. ...................................
#
20.42% 605 bash [kernel.kallsyms] [k] xen_hypercall_xen_version
|
--- xen_hypercall_xen_version
check_events
|
|--44.13%-- syscall_trace_enter
| tracesys
| |
| |--35.58%-- __GI___libc_fcntl
| | |
| | |--65.26%-- do_redirection_internal
| | | do_redirections
| | | execute_builtin_or_function
| | | execute_simple_command
| | | execute_command_internal
| | | execute_command
| | | execute_while_or_until
| | | execute_while_command
| | | execute_command_internal
| | | execute_command
| | | reader_loop
| | | main
| | | __libc_start_main
| | |
| | --34.74%-- do_redirections
| | |
| | |--54.55%-- execute_builtin_or_function
| | | execute_simple_command
| | | execute_command_internal
| | | execute_command
| | | execute_while_or_until
| | | execute_while_command
| | | execute_command_internal
| | | execute_command
| | | reader_loop
| | | main
| | | __libc_start_main
| | |
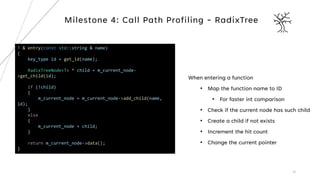
Linux Perf
Linux built in sampling-based profiler
20](https://image.slidesharecdn.com/buildingsourcecodelevelprofilerforc-231210031423-1cf15bb3/85/Building-source-code-level-profiler-for-C-pdf-20-320.jpg)
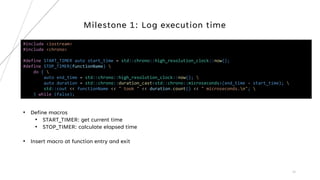
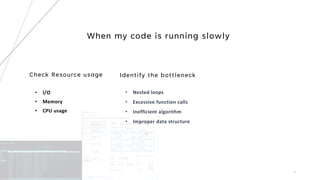
![33
template <typename T>
class RadixTree
{
public:
using key_type = typename RadixTreeNode<T>::key_type;
RadixTree()
: m_root(std::make_unique<RadixTreeNode<T>>())
, m_current_node(m_root.get())
{
}
private:
key_type get_id(const std::string & name)
{
auto [it, inserted] = m_id_map.try_emplace(name,
m_unique_id++);
return it->second;
}
std::unique_ptr<RadixTreeNode<T>> m_root;
RadixTreeNode<T> * m_current_node;
std::unordered_map<std::string, key_type> m_id_map;
key_type m_unique_id = 0;
};
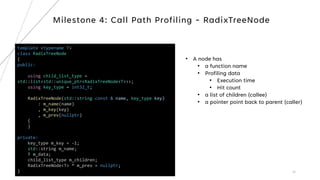
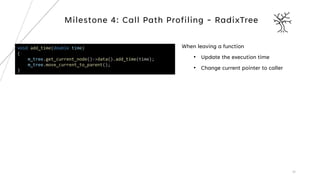
A tree has
• a root pointer
• a current pointer (on CPU function)
Milestone 4: Call Path Profiling - RadixTree](https://image.slidesharecdn.com/buildingsourcecodelevelprofilerforc-231210031423-1cf15bb3/85/Building-source-code-level-profiler-for-C-pdf-33-320.jpg)


![[ CNCF Q1 2024 ] Intro to Continuous Profiling and Grafana Pyroscope.pdf](https://cdn.slidesharecdn.com/ss_thumbnails/cncfq12024introtocontinuousprofilingandgrafanapyroscope-240407162420-9c15afb7-thumbnail.jpg?width=640&height=640&fit=bounds)