Download to read offline


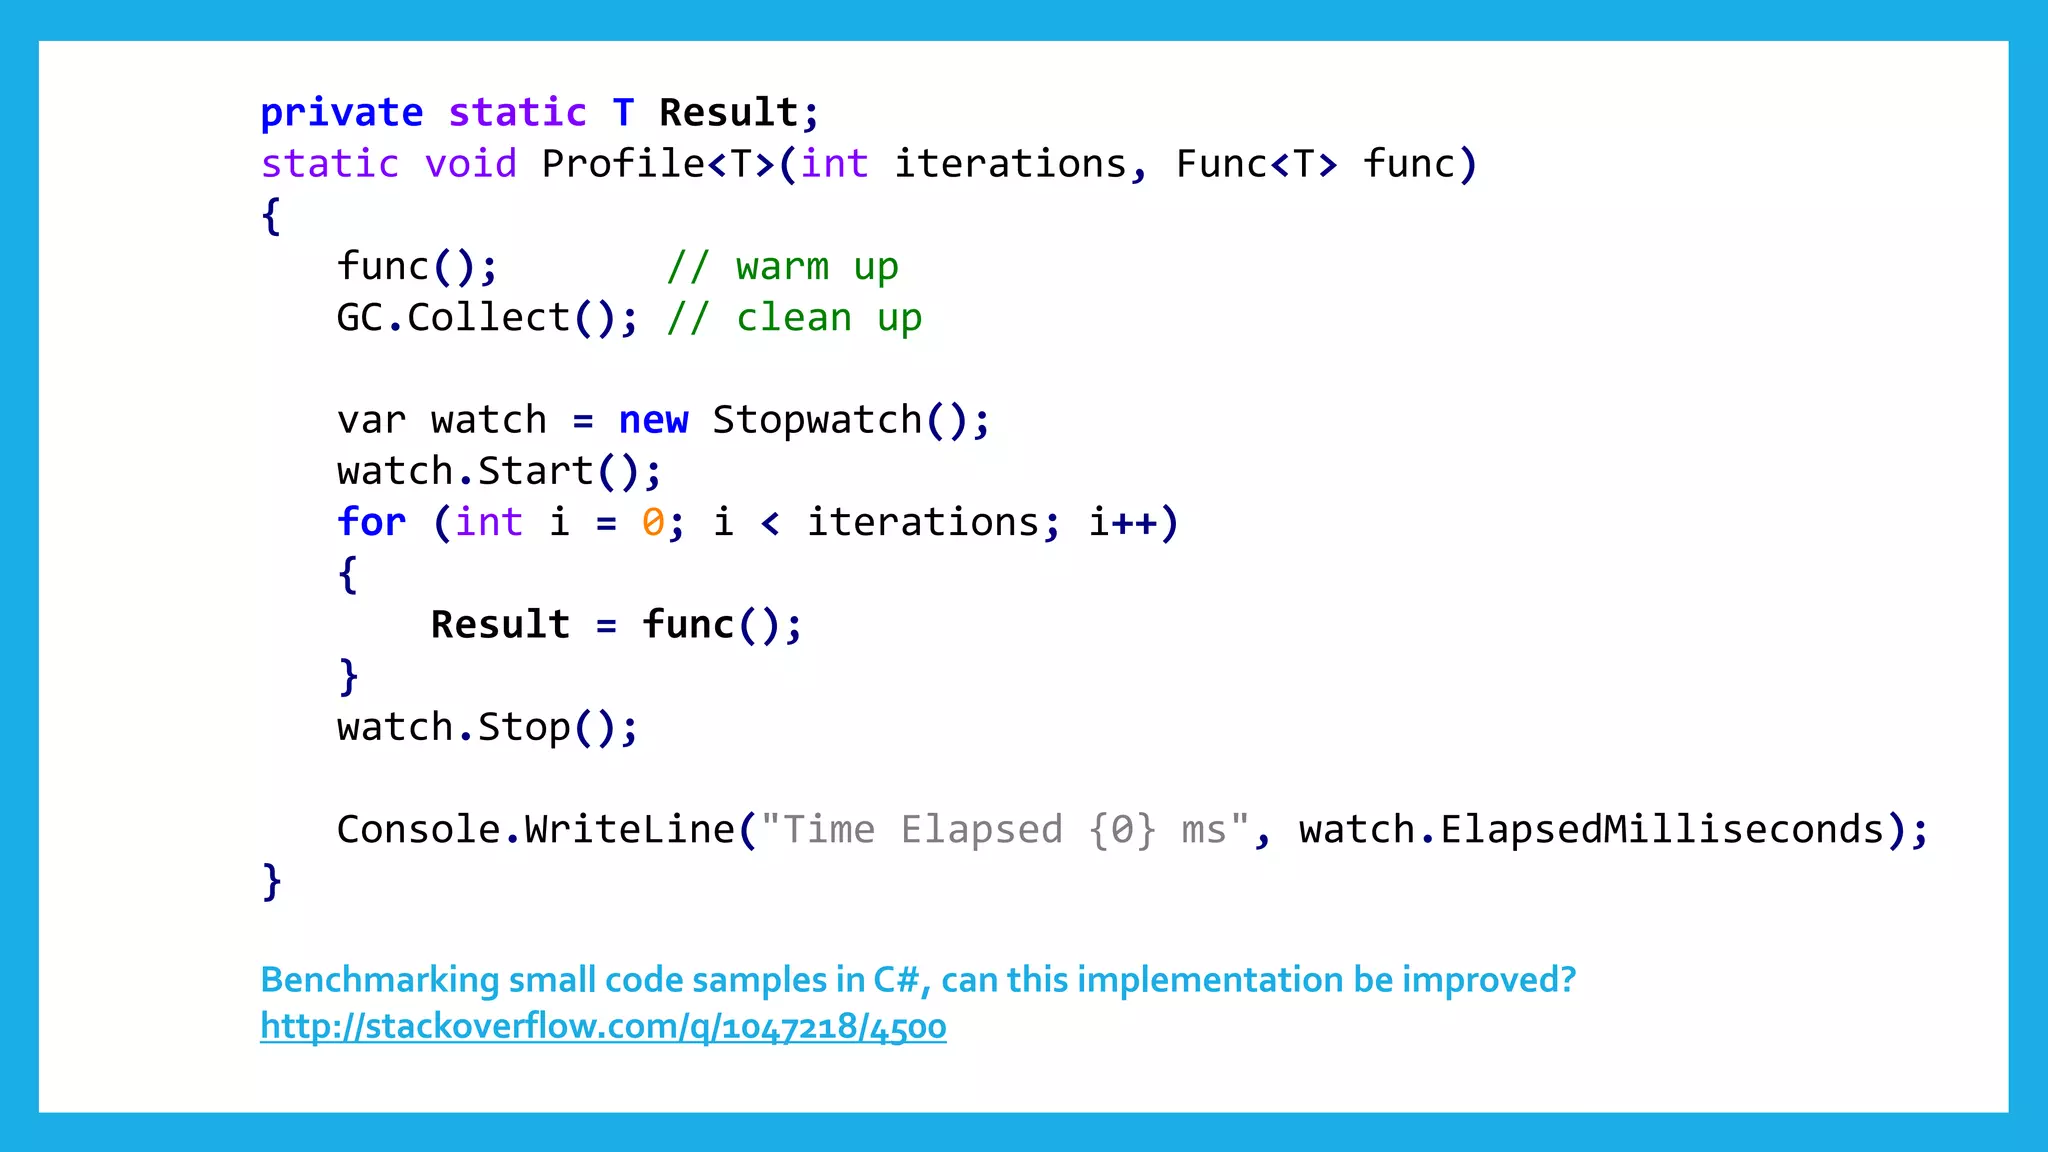


![Who ‘times’ the timers?
[Benchmark]
public long StopwatchLatency()
{
return Stopwatch.GetTimestamp();
}
[Benchmark]
public long StopwatchGranularity()
{
// Loop until Stopwatch.GetTimestamp()
// gives us a different value
long lastTimestamp =
Stopwatch.GetTimestamp();
while (Stopwatch.GetTimestamp() ==
lastTimestamp)
{
}
return lastTimestamp;
}
[Benchmark]
public long DateTimeLatency()
{
return DateTime.Now.Ticks;
}
[Benchmark]
public long DateTimeGranularity()
{
// Loop until DateTime.Now
// gives us a different value
long lastTimestamp = DateTime.Now.Ticks;
while (DateTime.Now.Ticks == lastTimestamp)
{
}
return lastTimestamp;
}](https://image.slidesharecdn.com/wherethewildthingsare-benchmarkingandmicro-optimisations-uploaded-170217093557/75/Where-the-wild-things-are-Benchmarking-and-Micro-Optimisations-23-2048.jpg)
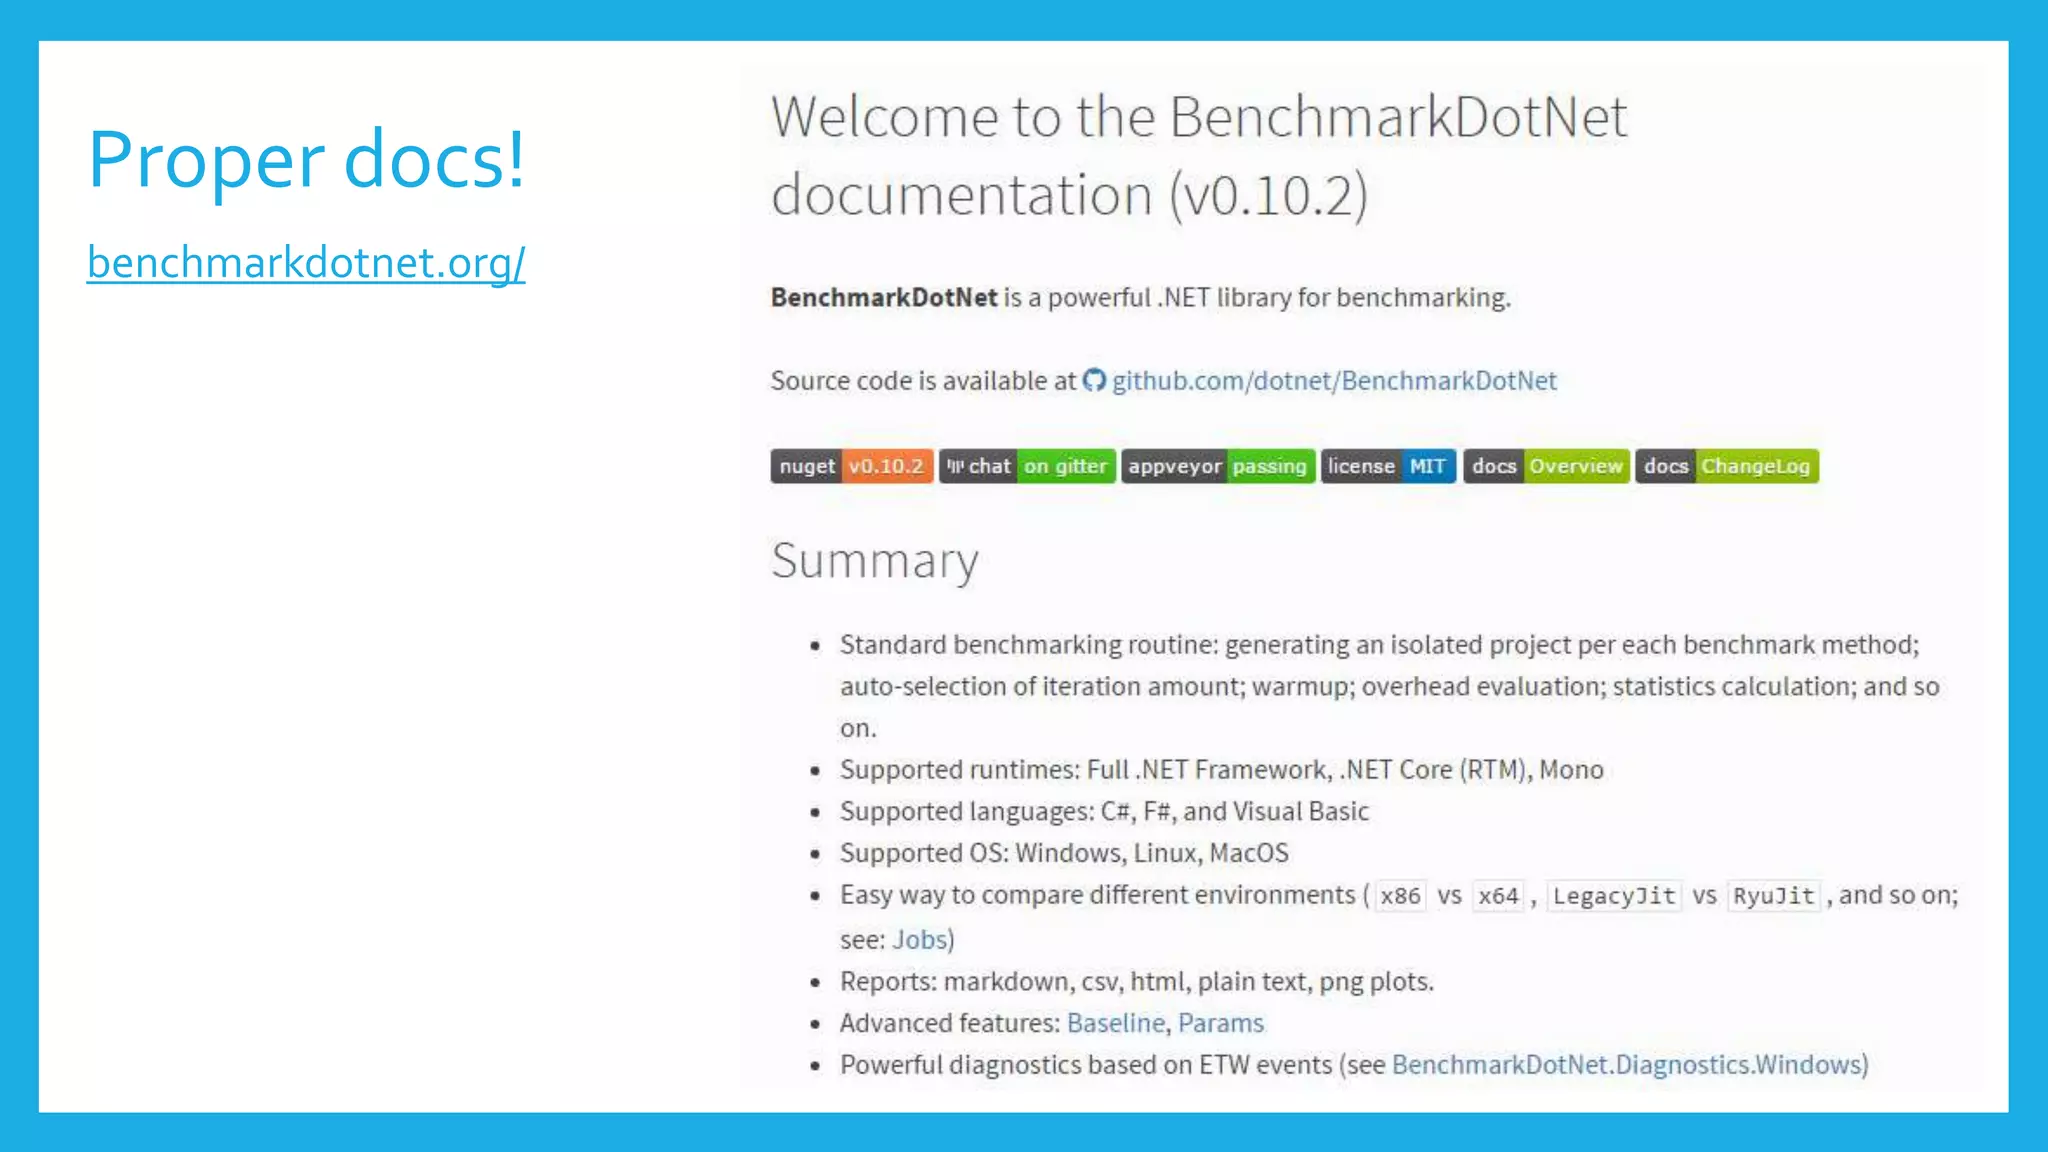
![BenchmarkDotNet=v0.10.1, OS=Microsoft Windows NT 6.1.7601 Service Pack 1
Processor=Intel(R) Core(TM) i7-4800MQ CPU 2.70GHz, ProcessorCount=8
Frequency=2630673 Hz, Resolution=380.1309 ns, Timer=TSC
[Host] : Clr 4.0.30319.42000, 32bit LegacyJIT-v4.6.1590.0
Job-FIDMNL : Clr 4.0.30319.42000, 32bit LegacyJIT-v4.6.1590.0
Method | Mean | StdDev | Allocated |
--------------------- |---------------- |------------ |---------- |
StopwatchLatency | ?? ns | ?? ns | ?? B |
StopwatchGranularity | ?? ns | ?? ns | ?? B |
DateTimeLatency | ?? ns | ?? ns | ?? B |
DateTimeGranularity | ?? ns | ?? ns | ?? B |
Who ‘times’ the timers?](https://image.slidesharecdn.com/wherethewildthingsare-benchmarkingandmicro-optimisations-uploaded-170217093557/75/Where-the-wild-things-are-Benchmarking-and-Micro-Optimisations-24-2048.jpg)
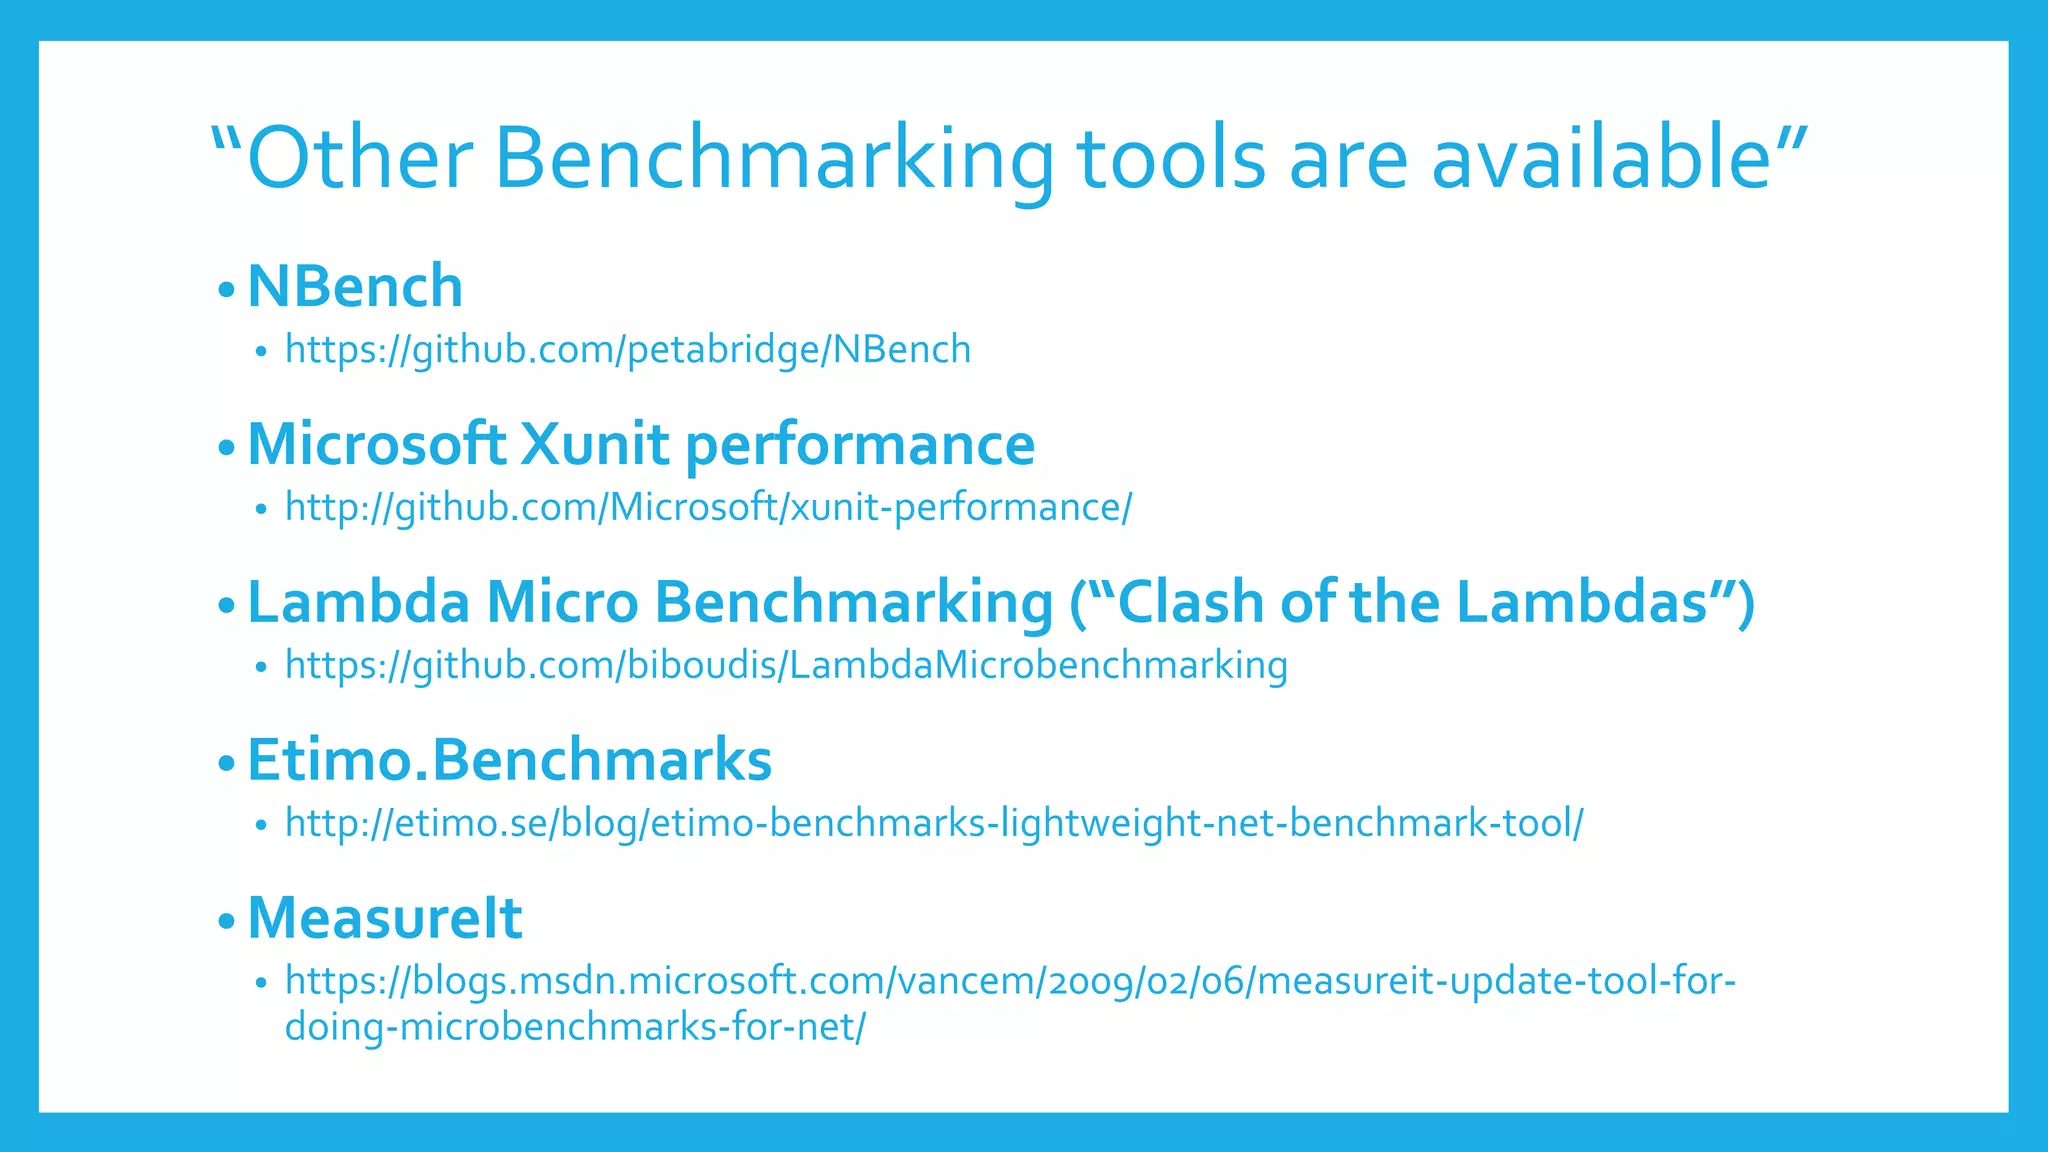
![BenchmarkDotNet=v0.10.1, OS=Microsoft Windows NT 6.1.7601 Service Pack 1
Processor=Intel(R) Core(TM) i7-4800MQ CPU 2.70GHz, ProcessorCount=8
Frequency=2630673 Hz, Resolution=380.1309 ns, Timer=TSC
[Host] : Clr 4.0.30319.42000, 32bit LegacyJIT-v4.6.1590.0
Job-FIDMNL : Clr 4.0.30319.42000, 32bit LegacyJIT-v4.6.1590.0
Method | Mean | StdDev | Allocated |
--------------------- |---------------- |------------ |---------- |
StopwatchLatency | 12.9960 ns | 0.1609 ns | 0 B |
StopwatchGranularity | 374.3049 ns | 2.4388 ns | 0 B |
DateTimeLatency | 682.2320 ns | 8.9341 ns | 32 B |
DateTimeGranularity | 996,025.6492 ns | 413.9175 ns | 47.34 kB |
Who ‘times’ the timers?](https://image.slidesharecdn.com/wherethewildthingsare-benchmarkingandmicro-optimisations-uploaded-170217093557/75/Where-the-wild-things-are-Benchmarking-and-Micro-Optimisations-25-2048.jpg)
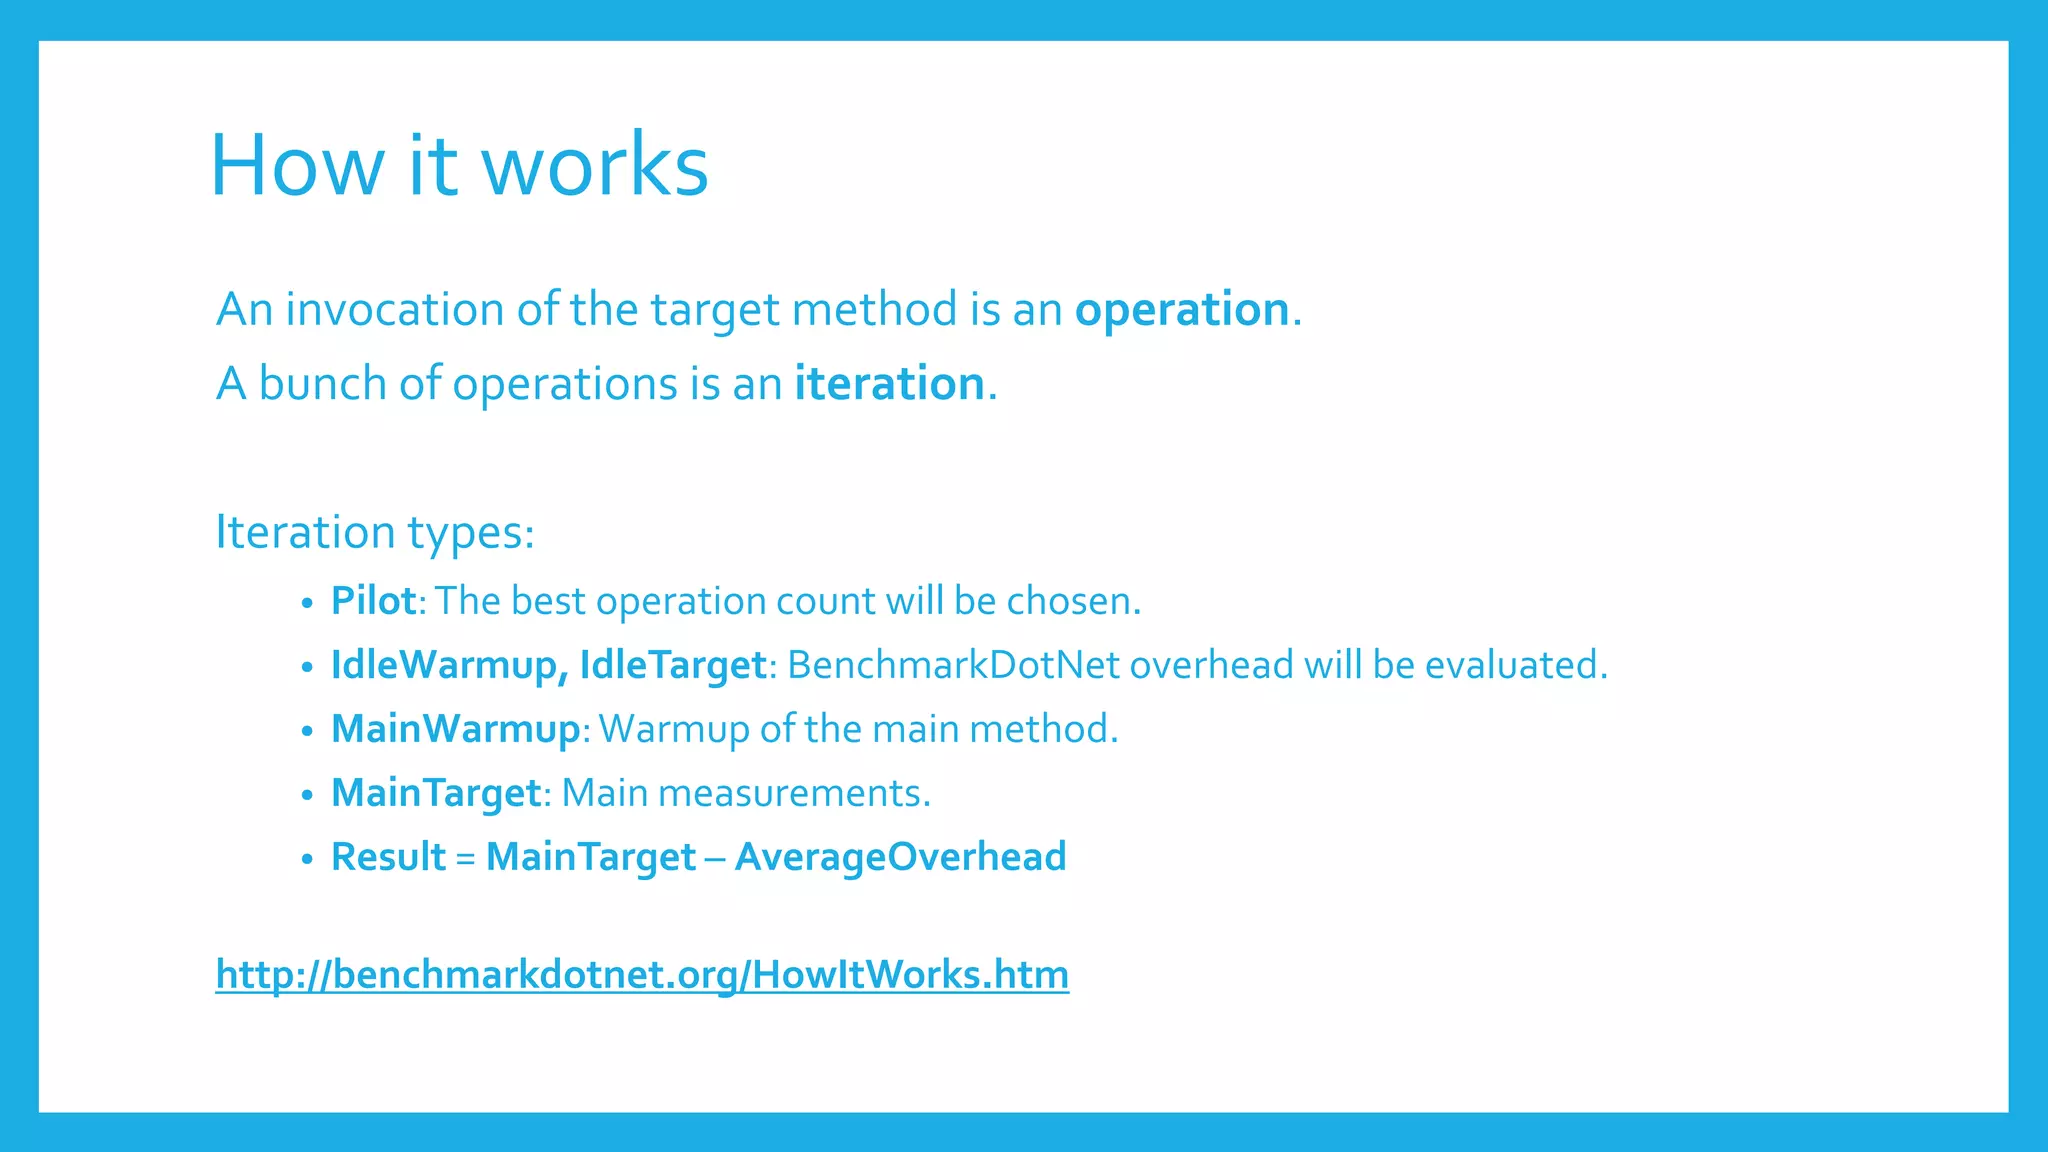
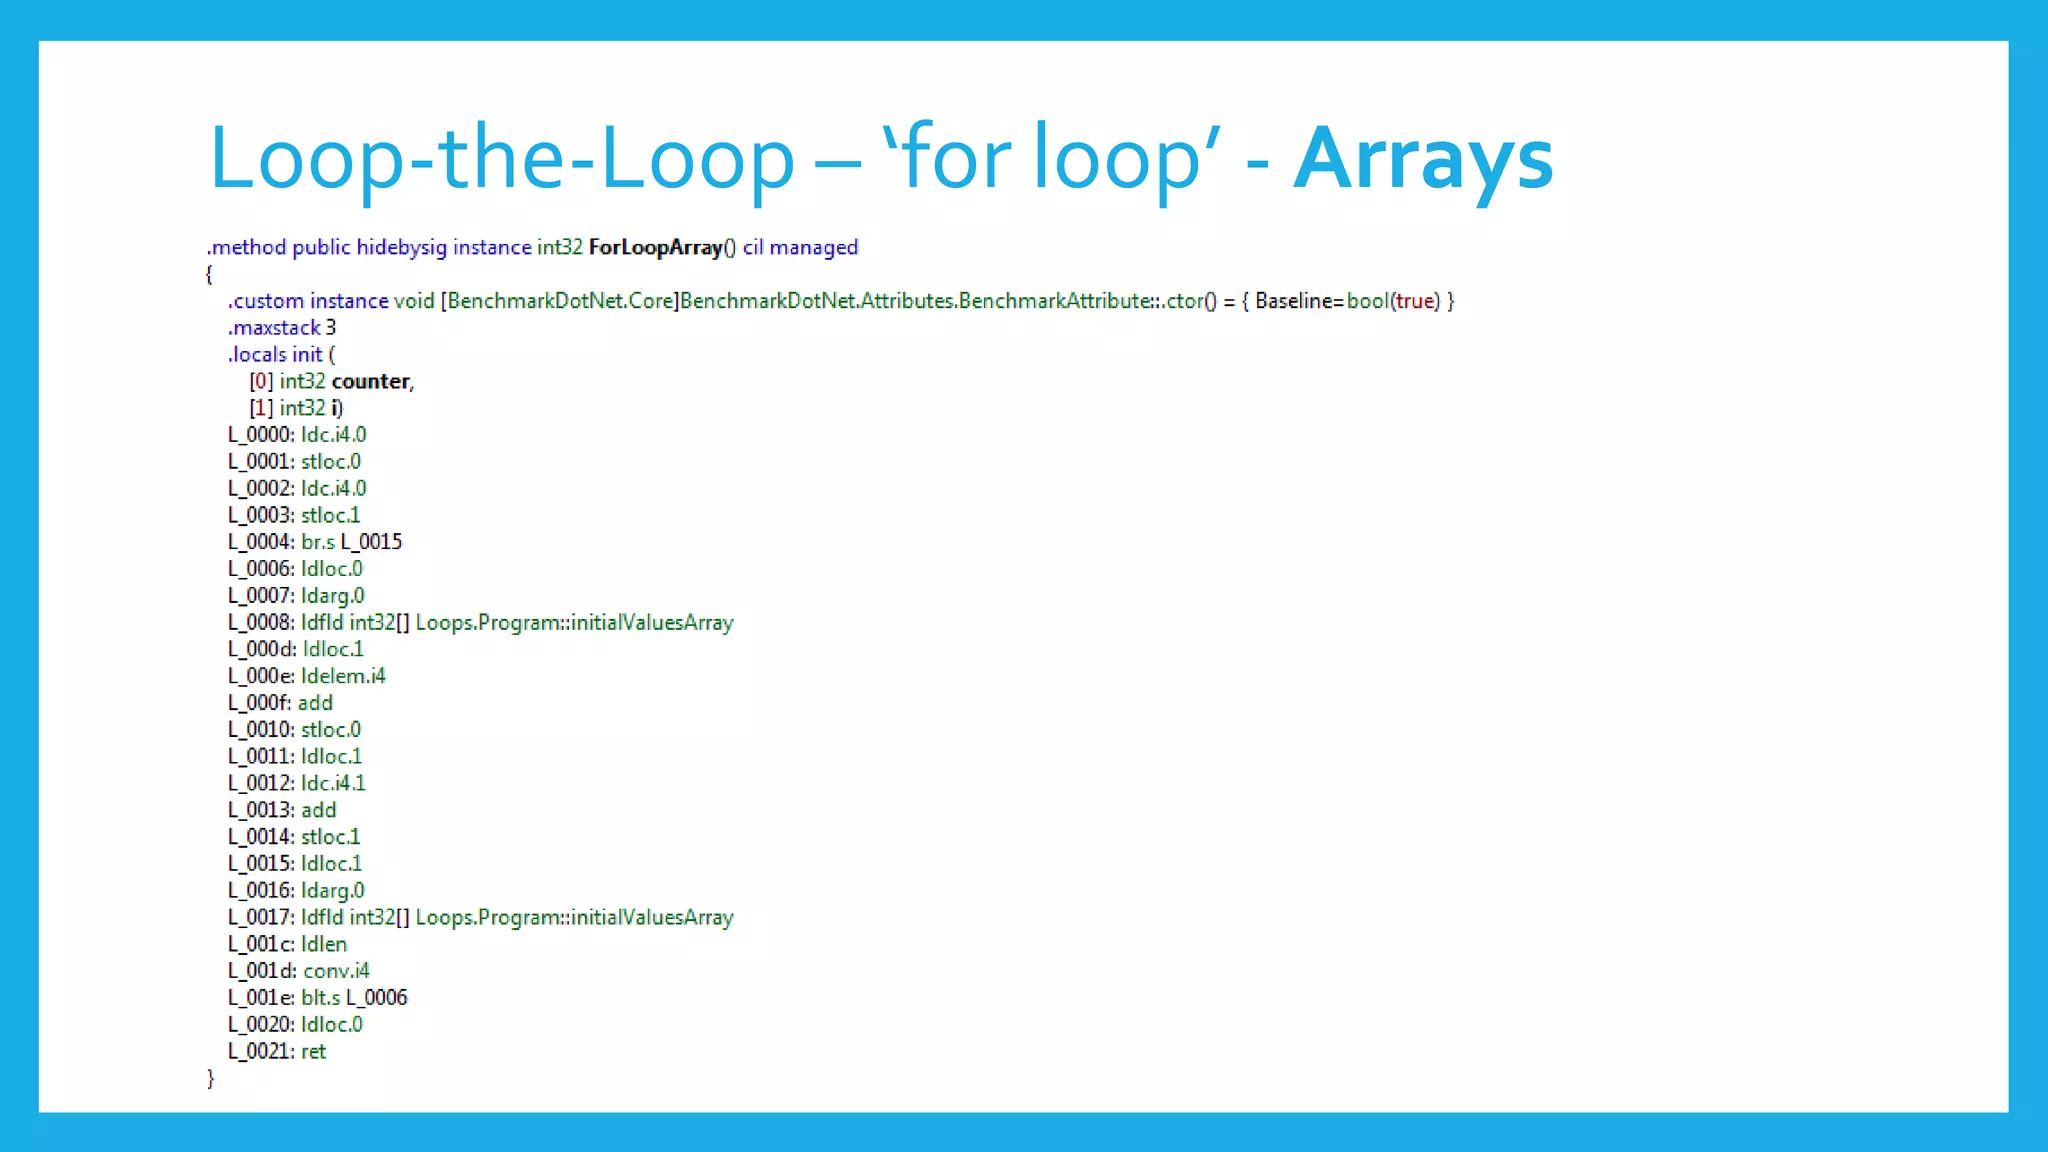
![Loop-the-Loop
”Avoid foreach loop on everything except raw arrays?”
[Benchmark(Baseline = true)]
public int ForLoopArray()
{
var counter = 0;
for (int i = 0; i < anArray.Length; i++)
counter += anArray[i];
return counter;
}
[Benchmark]
public int ForEachArray()
{
var counter = 0;
foreach (var i in anArray)
counter += i;
return counter;
}
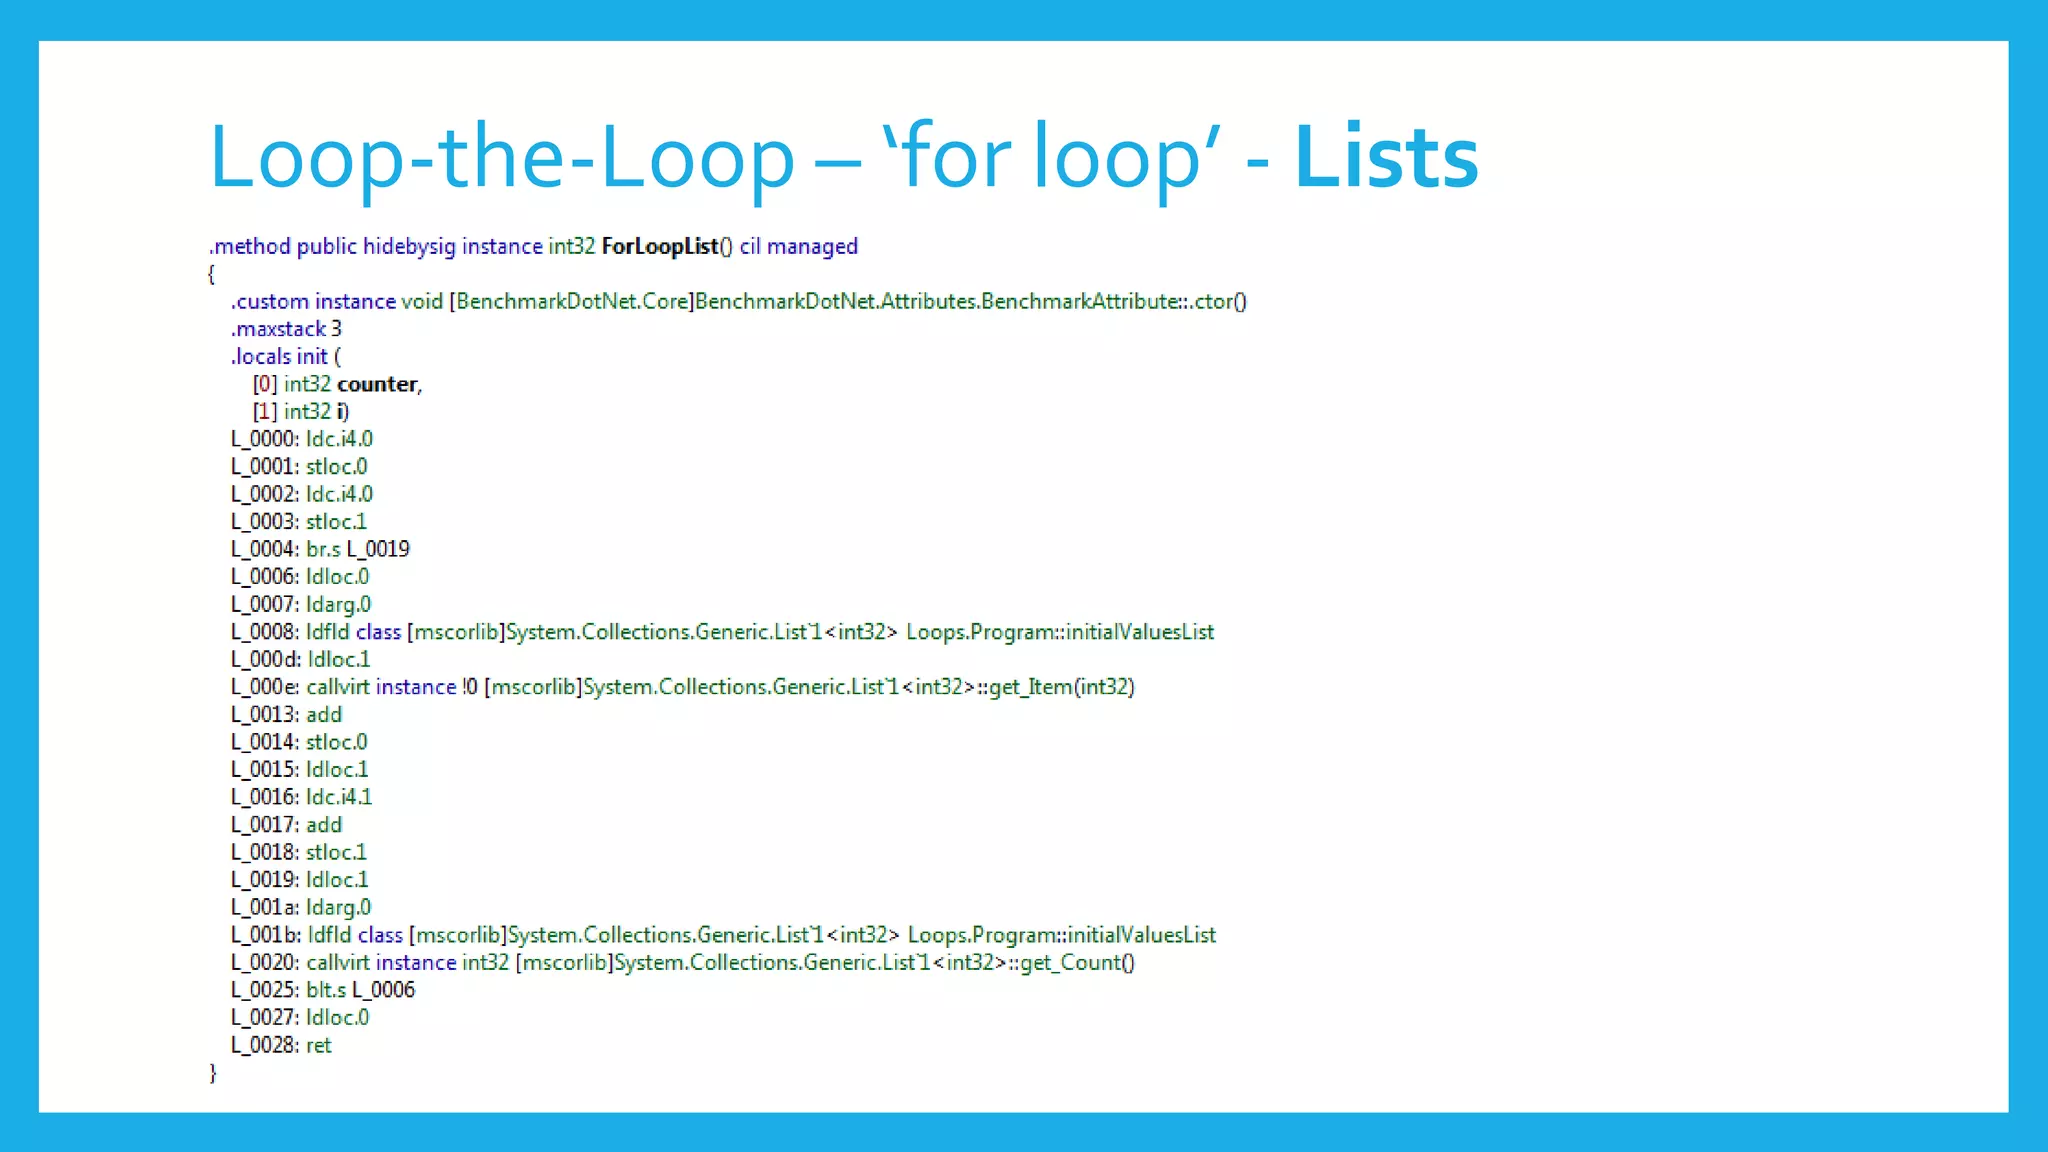
[Benchmark]
public int ForLoopList()
{
var counter = 0;
for (int i = 0; i < aList.Count; i++)
counter += aList[i];
return counter;
}
[Benchmark]
public int ForEachList()
{
var counter = 0;
foreach (var i in aList)
counter += i;
return counter;
}](https://image.slidesharecdn.com/wherethewildthingsare-benchmarkingandmicro-optimisations-uploaded-170217093557/75/Where-the-wild-things-are-Benchmarking-and-Micro-Optimisations-26-2048.jpg)
![Loop-the-Loop
”Avoid foreach loop on everything except raw arrays?”
BenchmarkDotNet=v0.10.1, OS=Microsoft Windows NT 6.1.7601 Service Pack 1
Processor=Intel(R) Core(TM) i7-4800MQ CPU 2.70GHz, ProcessorCount=8
Frequency=2630673 Hz, Resolution=380.1309 ns, Timer=TSC
[Host] : Clr 4.0.30319.42000, 32bit LegacyJIT-v4.6.1590.0
DefaultJob : Clr 4.0.30319.42000, 32bit LegacyJIT-v4.6.1590.0
Method | Mean | StdDev | Scaled | Scaled-StdDev |
--------------- |-------------- |------------ |------- |-------------- |
ForLoopArray | ?? ns | | ?? | |
ForEachArray | ?? ns | | ?? | |
ForLoopList | ?? ns | | ?? | |
ForEachList | ?? ns | | ?? | |](https://image.slidesharecdn.com/wherethewildthingsare-benchmarkingandmicro-optimisations-uploaded-170217093557/75/Where-the-wild-things-are-Benchmarking-and-Micro-Optimisations-27-2048.jpg)
![Loop-the-Loop
”Avoid foreach loop on everything except raw arrays?”
BenchmarkDotNet=v0.10.1, OS=Microsoft Windows NT 6.1.7601 Service Pack 1
Processor=Intel(R) Core(TM) i7-4800MQ CPU 2.70GHz, ProcessorCount=8
Frequency=2630673 Hz, Resolution=380.1309 ns, Timer=TSC
[Host] : Clr 4.0.30319.42000, 32bit LegacyJIT-v4.6.1590.0
DefaultJob : Clr 4.0.30319.42000, 32bit LegacyJIT-v4.6.1590.0
Method | Mean | StdDev | Scaled | Scaled-StdDev |
--------------- |-------------- |------------ |------- |-------------- |
ForLoopArray | 383.8279 ns | 2.9472 ns | 1.00 | 0.00 |
ForEachArray | 392.5611 ns | 4.1286 ns | 1.02 | 0.01 |
ForLoopList | 2,315.9658 ns | 12.1001 ns | 6.03 | 0.05 |
ForEachList | 2,663.5771 ns | 21.9822 ns | 6.94 | 0.08 |](https://image.slidesharecdn.com/wherethewildthingsare-benchmarkingandmicro-optimisations-uploaded-170217093557/75/Where-the-wild-things-are-Benchmarking-and-Micro-Optimisations-28-2048.jpg)
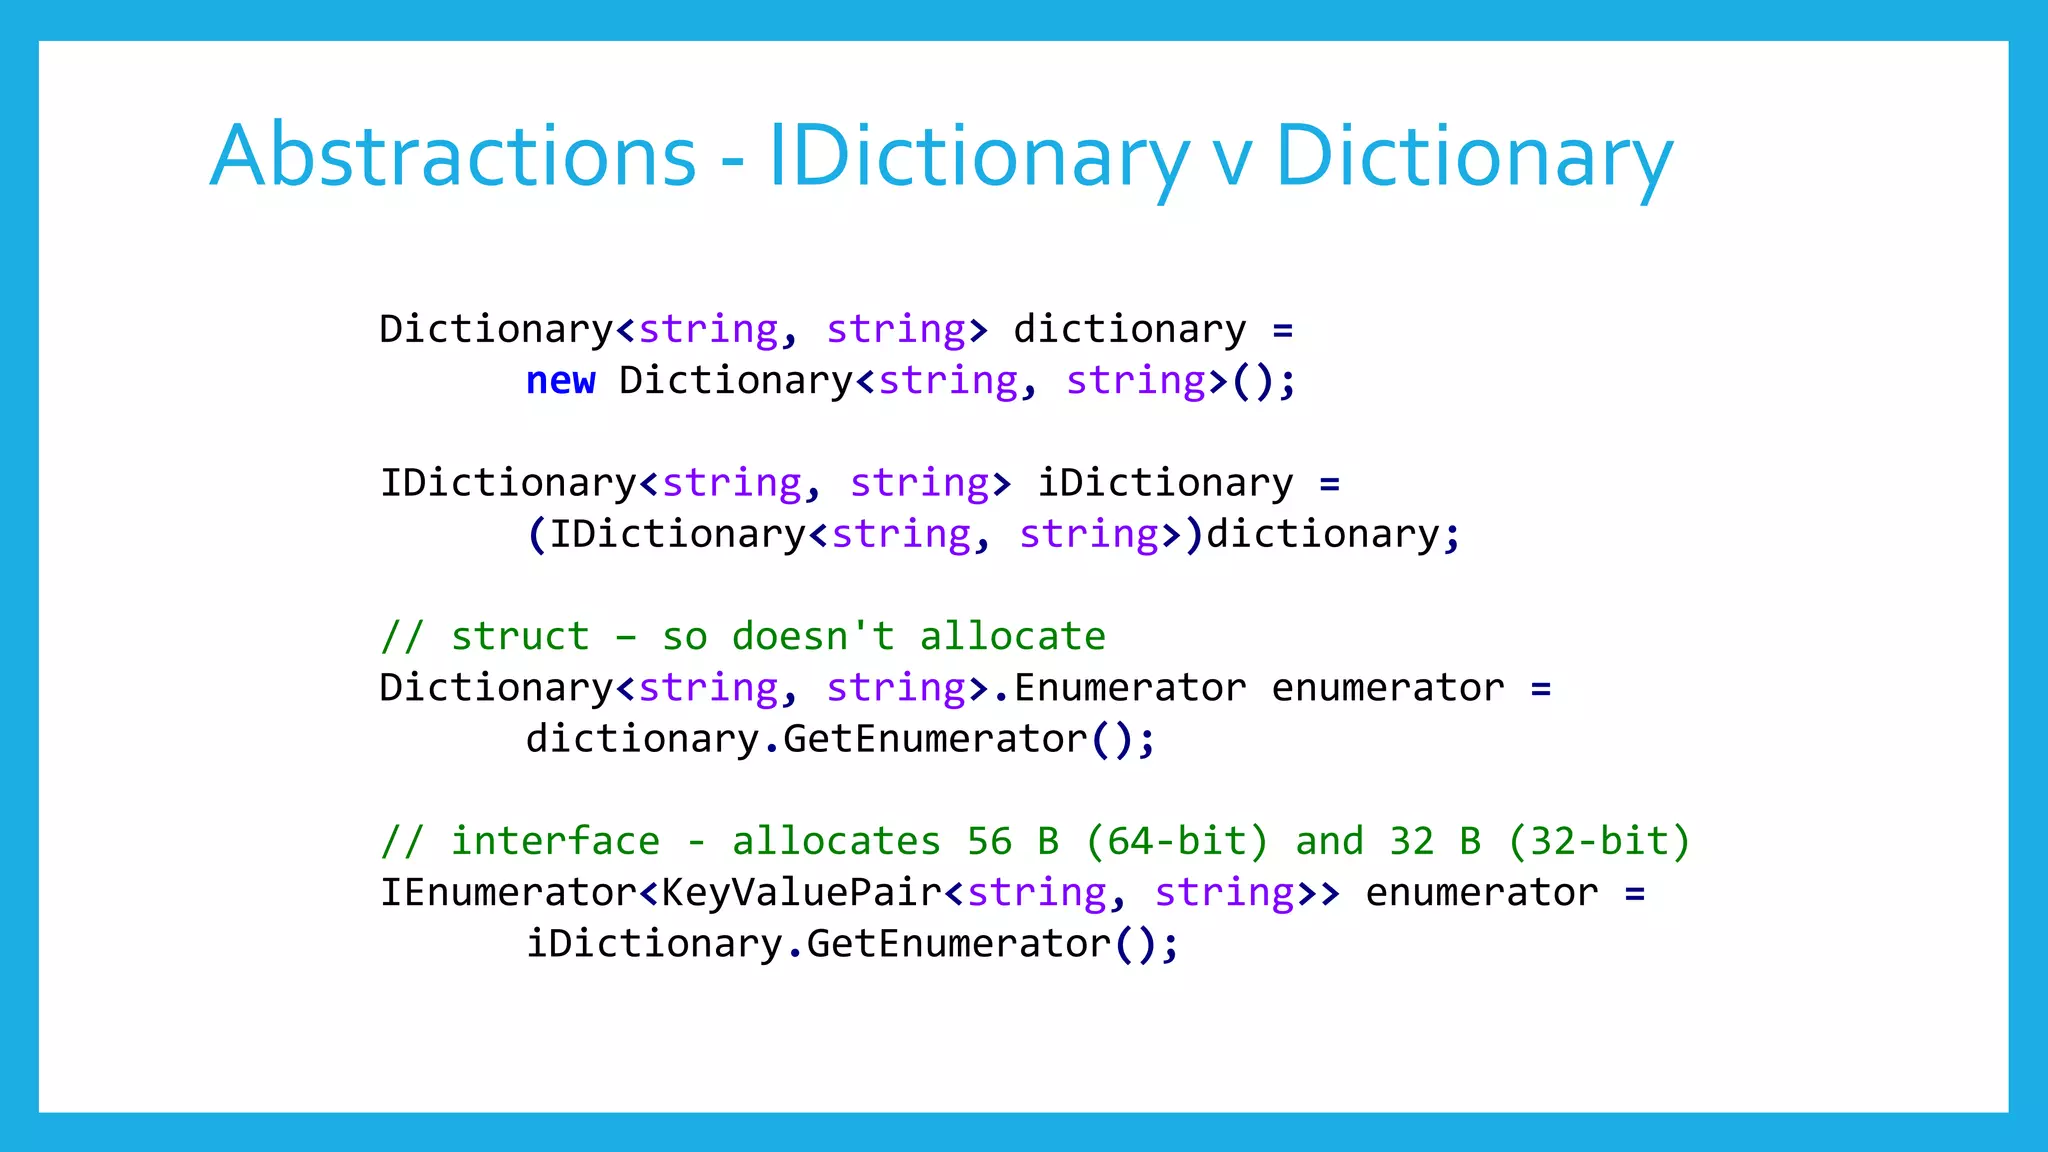
![Abstractions - IDictionary v Dictionary
Dictionary<string, string> dictionary =
new Dictionary<string, string>();
IDictionary<string, string> iDictionary =
(IDictionary<string, string>)dictionary;
[Benchmark]
public Dictionary<string, string> DictionaryEnumeration()
{
foreach (var item in dictionary) { ; }
return dictionary;
}
[Benchmark]
public IDictionary<string, string> IDictionaryEnumeration()
{
foreach (var item in iDictionary) { ; }
return iDictionary;
}](https://image.slidesharecdn.com/wherethewildthingsare-benchmarkingandmicro-optimisations-uploaded-170217093557/75/Where-the-wild-things-are-Benchmarking-and-Micro-Optimisations-31-2048.jpg)
![Abstractions - IDictionary v Dictionary
BenchmarkDotNet=v0.10.1, OS=Microsoft Windows NT 6.1.7601 Service Pack 1
Processor=Intel(R) Core(TM) i7-4800MQ CPU 2.70GHz, ProcessorCount=8
Frequency=2630673 Hz, Resolution=380.1309 ns, Timer=TSC
[Host] : Clr 4.0.30319.42000, 32bit LegacyJIT-v4.6.1590.0
DefaultJob : Clr 4.0.30319.42000, 32bit LegacyJIT-v4.6.1590.0
Method | Mean | StdErr | StdDev | Gen 0 | Allocated |
----------------------- |----------- |---------- |---------- |------- |---------- |
DictionaryEnumeration | ?? ns | ?? ns | ?? ns | ?? | ?? B |
IDictionaryEnumeration | ?? ns | ?? ns | ?? ns | ?? | ?? B |
// * Diagnostic Output - MemoryDiagnoser *
Note: the Gen 0/1/2 Measurements are per 1k Operations](https://image.slidesharecdn.com/wherethewildthingsare-benchmarkingandmicro-optimisations-uploaded-170217093557/75/Where-the-wild-things-are-Benchmarking-and-Micro-Optimisations-32-2048.jpg)
![Abstractions - IDictionary v Dictionary
BenchmarkDotNet=v0.10.1, OS=Microsoft Windows NT 6.1.7601 Service Pack 1
Processor=Intel(R) Core(TM) i7-4800MQ CPU 2.70GHz, ProcessorCount=8
Frequency=2630673 Hz, Resolution=380.1309 ns, Timer=TSC
[Host] : Clr 4.0.30319.42000, 32bit LegacyJIT-v4.6.1590.0
DefaultJob : Clr 4.0.30319.42000, 32bit LegacyJIT-v4.6.1590.0
Method | Mean | StdErr | StdDev | Gen 0 | Allocated |
----------------------- |----------- |---------- |---------- |------- |---------- |
DictionaryEnumeration | 24.0353 ns | 0.2403 ns | 0.9307 ns | - | 0 B |
IDictionaryEnumeration | 41.6301 ns | 0.4479 ns | 2.1944 ns | 0.0086 | 32 B |
// * Diagnostic Output - MemoryDiagnoser *
Note: the Gen 0/1/2 Measurements are per 1k Operations](https://image.slidesharecdn.com/wherethewildthingsare-benchmarkingandmicro-optimisations-uploaded-170217093557/75/Where-the-wild-things-are-Benchmarking-and-Micro-Optimisations-33-2048.jpg)
![Low-level increments
[LegacyJitX86Job, LegacyJitX64Job, RyuJitX64Job]
public class Program
{
private double a, b, c, d;
[Benchmark(OperationsPerInvoke = 4)]
public void MethodA()
{
a++; b++; c++; d++;
}
[Benchmark(OperationsPerInvoke = 4)]
public void MethodB()
{
a++; a++; a++; a++;
}
}](https://image.slidesharecdn.com/wherethewildthingsare-benchmarkingandmicro-optimisations-uploaded-170217093557/75/Where-the-wild-things-are-Benchmarking-and-Micro-Optimisations-35-2048.jpg)
![Low-level increments
BenchmarkDotNet=v0.10.1, OS=Microsoft Windows NT 6.1.7601 Service Pack 1
Processor=Intel(R) Core(TM) i7-4800MQ CPU 2.70GHz, ProcessorCount=8
Frequency=2630673 Hz, Resolution=380.1309 ns, Timer=TSC
[Host] : Clr 4.0.30319.42000, 32bit LegacyJIT-v4.6.1590.0
LegacyJitX64 : Clr 4.0.30319.42000, 64bit LegacyJIT/clrjit-v4.6.1590.0;compatjit-v4.6.1590.0
LegacyJitX86 : Clr 4.0.30319.42000, 32bit LegacyJIT-v4.6.1590.0
RyuJitX64 : Clr 4.0.30319.42000, 64bit RyuJIT-v4.6.1590.0
Runtime=Clr Allocated=0 B
Method | Job | Jit | Platform | Mean | StdErr | StdDev |
----------- |------------- |---------- |--------- |---------- |---------- |---------- |
Parallel | LegacyJitX64 | LegacyJit | X64 | ?? ns | ?? ns | ?? ns |
Sequential | LegacyJitX64 | LegacyJit | X64 | ?? ns | ?? ns | ?? ns |
Parallel | LegacyJitX86 | LegacyJit | X86 | ?? ns | ?? ns | ?? ns |
Sequential | LegacyJitX86 | LegacyJit | X86 | ?? ns | ?? ns | ?? ns |
Parallel | RyuJitX64 | RyuJit | X64 | ?? ns | ?? ns | ?? ns |
Sequential | RyuJitX64 | RyuJit | X64 | ?? ns | ?? ns | ?? ns |
MethodA = Parallel, MethodB() = Sequential](https://image.slidesharecdn.com/wherethewildthingsare-benchmarkingandmicro-optimisations-uploaded-170217093557/75/Where-the-wild-things-are-Benchmarking-and-Micro-Optimisations-36-2048.jpg)
![Low-level increments
BenchmarkDotNet=v0.10.1, OS=Microsoft Windows NT 6.1.7601 Service Pack 1
Processor=Intel(R) Core(TM) i7-4800MQ CPU 2.70GHz, ProcessorCount=8
Frequency=2630673 Hz, Resolution=380.1309 ns, Timer=TSC
[Host] : Clr 4.0.30319.42000, 32bit LegacyJIT-v4.6.1590.0
LegacyJitX64 : Clr 4.0.30319.42000, 64bit LegacyJIT/clrjit-v4.6.1590.0;compatjit-v4.6.1590.0
LegacyJitX86 : Clr 4.0.30319.42000, 32bit LegacyJIT-v4.6.1590.0
RyuJitX64 : Clr 4.0.30319.42000, 64bit RyuJIT-v4.6.1590.0
Runtime=Clr Allocated=0 B
Method | Job | Jit | Platform | Mean | StdErr | StdDev |
----------- |------------- |---------- |--------- |---------- |---------- |---------- |
Parallel | LegacyJitX64 | LegacyJit | X64 | 0.3420 ns | 0.0015 ns | 0.0057 ns |
Sequential | LegacyJitX64 | LegacyJit | X64 | 2.2038 ns | 0.0014 ns | 0.0051 ns |
Parallel | LegacyJitX86 | LegacyJit | X86 | 0.3276 ns | 0.0005 ns | 0.0020 ns |
Sequential | LegacyJitX86 | LegacyJit | X86 | 2.5229 ns | 0.0048 ns | 0.0187 ns |
Parallel | RyuJitX64 | RyuJit | X64 | 0.3686 ns | 0.0037 ns | 0.0144 ns |
Sequential | RyuJitX64 | RyuJit | X64 | 0.8959 ns | 0.0023 ns | 0.0090 ns |
MethodA = Parallel, MethodB() = Sequential
http://en.wikipedia.org/wiki/Instruction-level_parallelism](https://image.slidesharecdn.com/wherethewildthingsare-benchmarkingandmicro-optimisations-uploaded-170217093557/75/Where-the-wild-things-are-Benchmarking-and-Micro-Optimisations-37-2048.jpg)
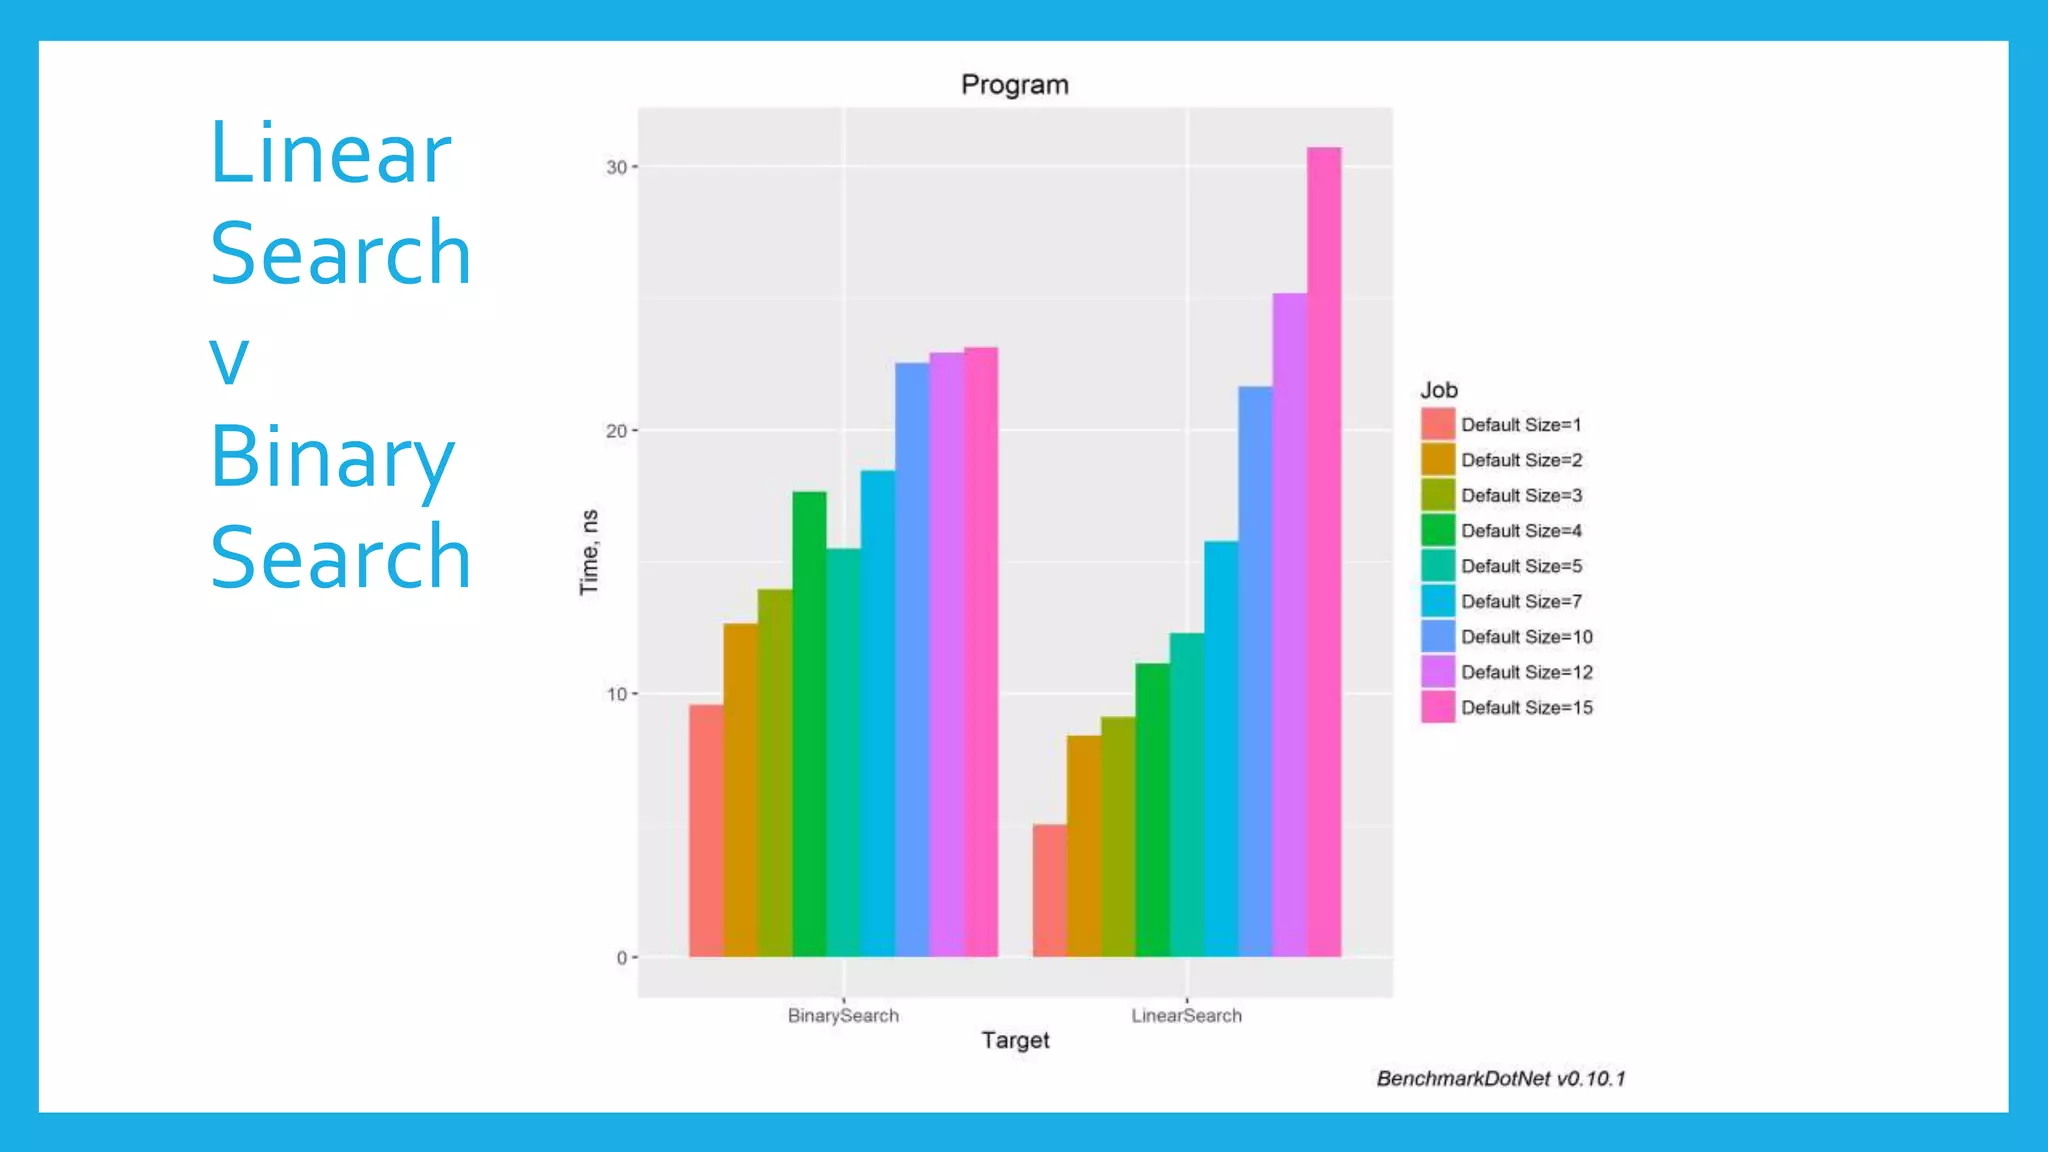
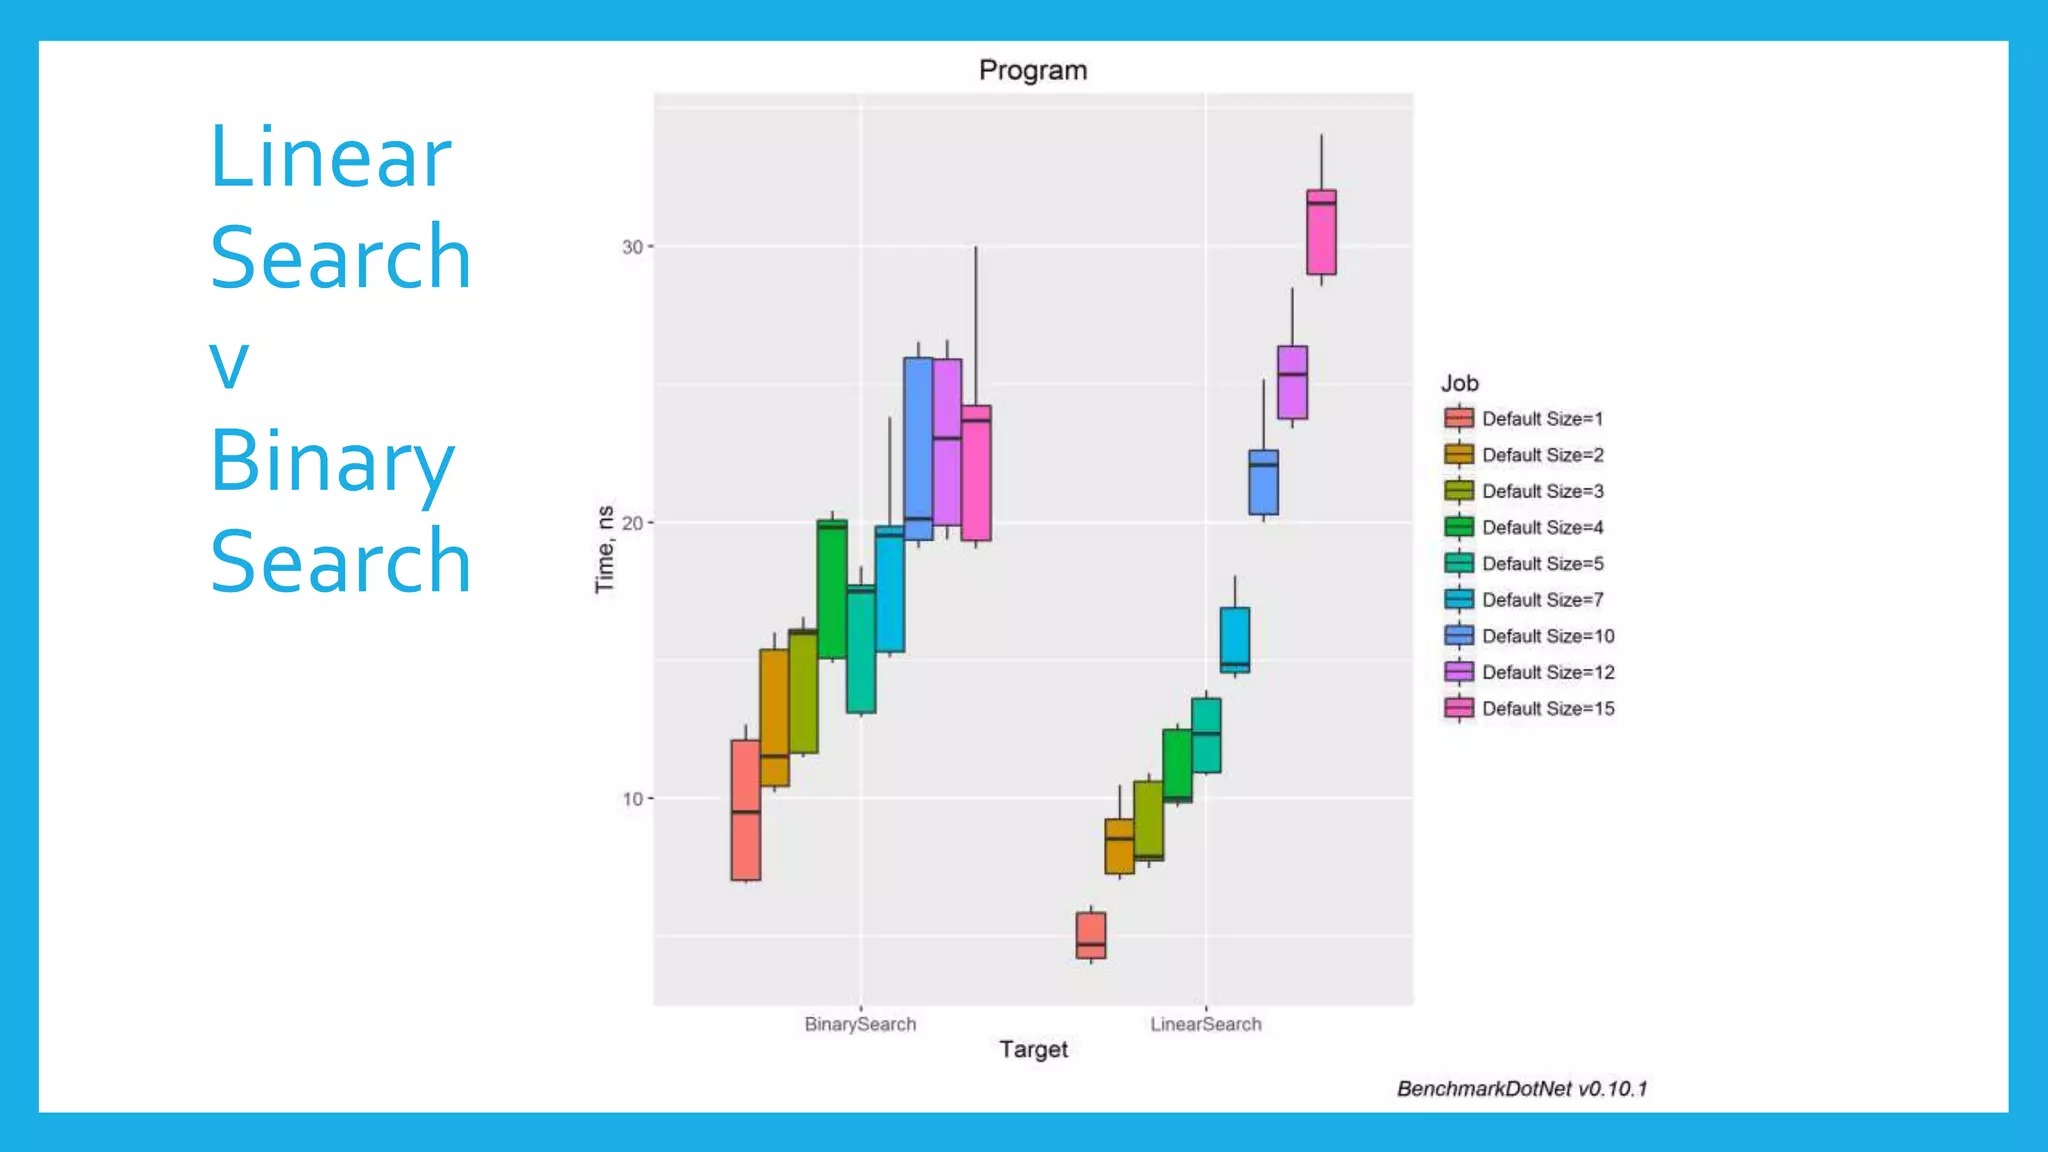
![Search - Linear v Binary
private static int LinearSearch(
Data[] set, int key)
{
for (int i = 0; i < set.Length; i++)
{
var c = set[i].Key - key;
if (c == 0)
{
return i;
}
if (c > 0)
{
return ~i;
}
}
return ~set.Length;
}
private static int BinarySearch(
Data[] set, int key)
{
int i = 0;
int up = set.Length - 1;
while (i <= up)
{
int mid = (up - i) / 2 + i;
int c = set[mid].Key - key;
if (c == 0)
{
return mid;
}
if (c < 0)
i = mid + 1;
else
up = mid - 1;
}
return ~i;
}](https://image.slidesharecdn.com/wherethewildthingsare-benchmarkingandmicro-optimisations-uploaded-170217093557/75/Where-the-wild-things-are-Benchmarking-and-Micro-Optimisations-38-2048.jpg)
![Search - Linear v Binary
private readonly Data[][] dataSet;
private Data[] currentSet;
private int currentMid;
private int currentMax;
[Params(1, 2, 3, 4, 5, 7, 10, 12, 15)]
public int Size
{
set
{
currentSet = dataSet[value];
currentMax = value - 1;
currentMid = value / 2;
}
}](https://image.slidesharecdn.com/wherethewildthingsare-benchmarkingandmicro-optimisations-uploaded-170217093557/75/Where-the-wild-things-are-Benchmarking-and-Micro-Optimisations-39-2048.jpg)
![readonly fields
public struct Int256
{
private readonly long bits0, bits1,
bits2, bits3;
public Int256(long bits0, long bits1,
long bits2, long bits3)
{
this.bits0 = bits0; this.bits1 = bits1;
this.bits2 = bits2; this.bits3 = bits3;
}
public long Bits0 { get { return bits0; } }
public long Bits1 { get { return bits1; } }
public long Bits2 { get { return bits2; } }
public long Bits3 { get { return bits3; } }
}
private readonly Int256 readOnlyField =
new Int256(1L, 5L, 10L, 100L);
private Int256 field =
new Int256(1L, 5L, 10L, 100L);
[LegacyJitX86Job, LegacyJitX64Job, RyuJitX64Job]
public class Program
{
[Benchmark]
public long GetValue()
{
return field.Bits0 + field.Bits1 +
field.Bits2 + field.Bits3;
}
[Benchmark]
public long GetReadOnlyValue()
{
return readOnlyField.Bits0 +
readOnlyField.Bits1 +
readOnlyField.Bits2 +
readOnlyField.Bits3;
}
}](https://image.slidesharecdn.com/wherethewildthingsare-benchmarkingandmicro-optimisations-uploaded-170217093557/75/Where-the-wild-things-are-Benchmarking-and-Micro-Optimisations-42-2048.jpg)
![readonly fields
BenchmarkDotNet=v0.10.1, OS=Microsoft Windows NT 6.1.7601 Service Pack 1
Processor=Intel(R) Core(TM) i7-4800MQ CPU 2.70GHz, ProcessorCount=8
Frequency=2630673 Hz, Resolution=380.1309 ns, Timer=TSC
[Host] : Clr 4.0.30319.42000, 32bit LegacyJIT-v4.6.1590.0
LegacyJitX64 : Clr 4.0.30319.42000, 64bit LegacyJIT/clrjit-v4.6.1590.0;compatjit-v4.6.1590.0
LegacyJitX86 : Clr 4.0.30319.42000, 32bit LegacyJIT-v4.6.1590.0
RyuJitX64 : Clr 4.0.30319.42000, 64bit RyuJIT-v4.6.1590.0
Runtime=Clr Allocated=0 B
Method | Job | Jit | Platform | Mean | StdErr | StdDev |
----------------- |------------- |---------- |--------- |---------- |---------- |---------- |
GetValue | LegacyJitX64 | LegacyJit | X64 | ?? ns | ?? ns | ?? ns |
GetReadOnlyValue | LegacyJitX64 | LegacyJit | X64 | ?? ns | ?? ns | ?? ns |
GetValue | LegacyJitX86 | LegacyJit | X86 | ?? ns | ?? ns | ?? ns |
GetReadOnlyValue | LegacyJitX86 | LegacyJit | X86 | ?? ns | ?? ns | ?? ns |
GetValue | RyuJitX64 | RyuJit | X64 | ?? ns | ?? ns | ?? ns |
GetReadOnlyValue | RyuJitX64 | RyuJit | X64 | ?? ns | ?? ns | ?? ns |](https://image.slidesharecdn.com/wherethewildthingsare-benchmarkingandmicro-optimisations-uploaded-170217093557/75/Where-the-wild-things-are-Benchmarking-and-Micro-Optimisations-43-2048.jpg)
![readonly fields
BenchmarkDotNet=v0.10.1, OS=Microsoft Windows NT 6.1.7601 Service Pack 1
Processor=Intel(R) Core(TM) i7-4800MQ CPU 2.70GHz, ProcessorCount=8
Frequency=2630673 Hz, Resolution=380.1309 ns, Timer=TSC
[Host] : Clr 4.0.30319.42000, 32bit LegacyJIT-v4.6.1590.0
LegacyJitX64 : Clr 4.0.30319.42000, 64bit LegacyJIT/clrjit-v4.6.1590.0;compatjit-v4.6.1590.0
LegacyJitX86 : Clr 4.0.30319.42000, 32bit LegacyJIT-v4.6.1590.0
RyuJitX64 : Clr 4.0.30319.42000, 64bit RyuJIT-v4.6.1590.0
Runtime=Clr Allocated=0 B
Method | Job | Jit | Platform | Mean | StdErr | StdDev |
----------------- |------------- |---------- |--------- |---------- |---------- |---------- |
GetValue | LegacyJitX64 | LegacyJit | X64 | 0.7893 ns | 0.0078 ns | 0.0291 ns |
GetReadOnlyValue | LegacyJitX64 | LegacyJit | X64 | 9.5362 ns | 0.0251 ns | 0.0971 ns |
GetValue | LegacyJitX86 | LegacyJit | X86 | 1.4625 ns | 0.0506 ns | 0.1959 ns |
GetReadOnlyValue | LegacyJitX86 | LegacyJit | X86 | 1.9743 ns | 0.0641 ns | 0.2481 ns |
GetValue | RyuJitX64 | RyuJit | X64 | 0.3852 ns | 0.0183 ns | 0.0710 ns |
GetReadOnlyValue | RyuJitX64 | RyuJit | X64 | 9.6406 ns | 0.0803 ns | 0.3109 ns |
https://codeblog.jonskeet.uk/2014/07/16/micro-optimization-the-surprising-inefficiency-of-readonly-fields/](https://image.slidesharecdn.com/wherethewildthingsare-benchmarkingandmicro-optimisations-uploaded-170217093557/75/Where-the-wild-things-are-Benchmarking-and-Micro-Optimisations-44-2048.jpg)


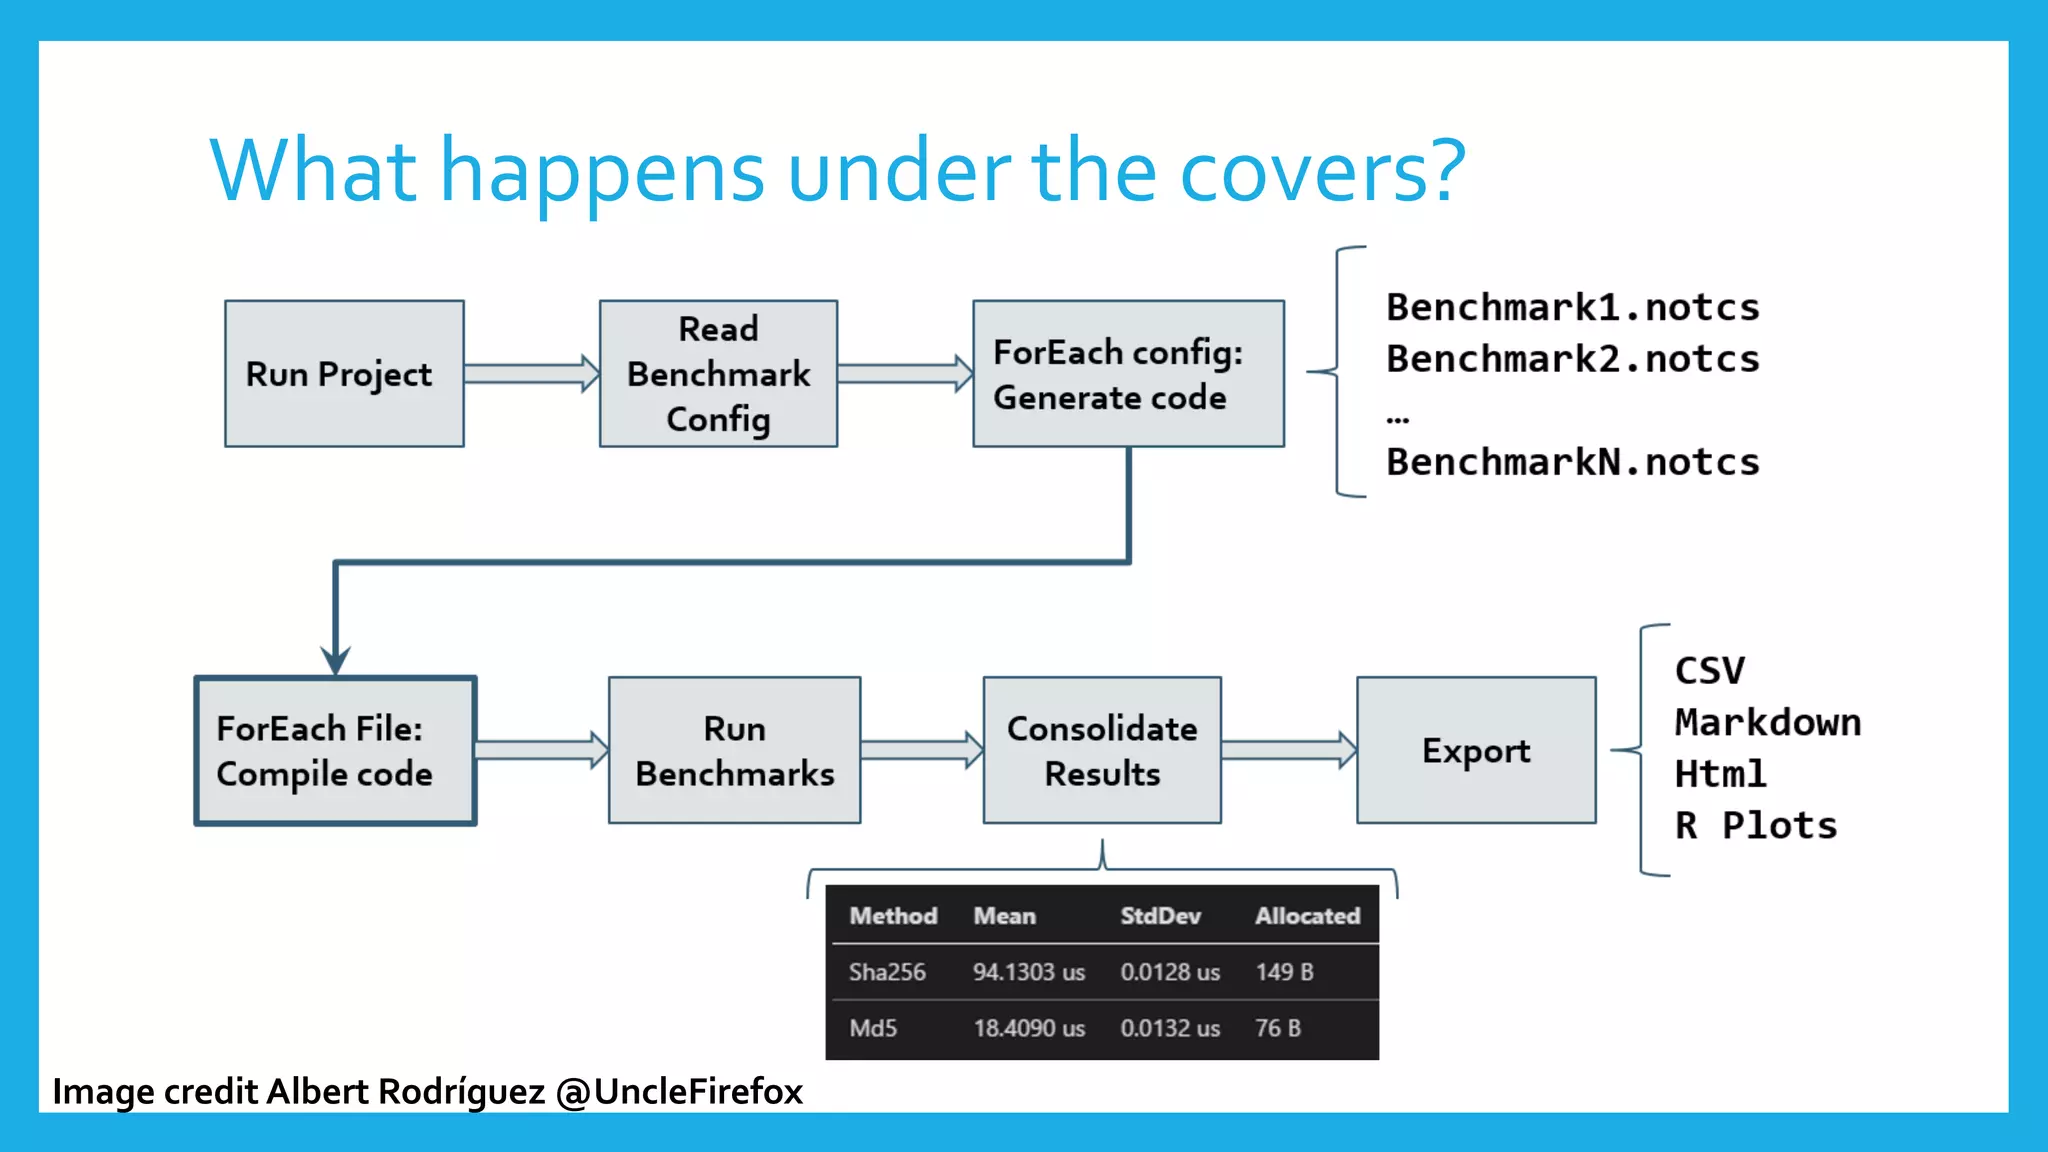
The document discusses benchmarking techniques and micro-optimizations in C# using BenchmarkDotNet and various profiling tools. It emphasizes the importance of accurate and efficient benchmarking while highlighting common pitfalls like premature optimization. The document also compares different types of loops and data structures, analyzing their performance metrics in practical scenarios.