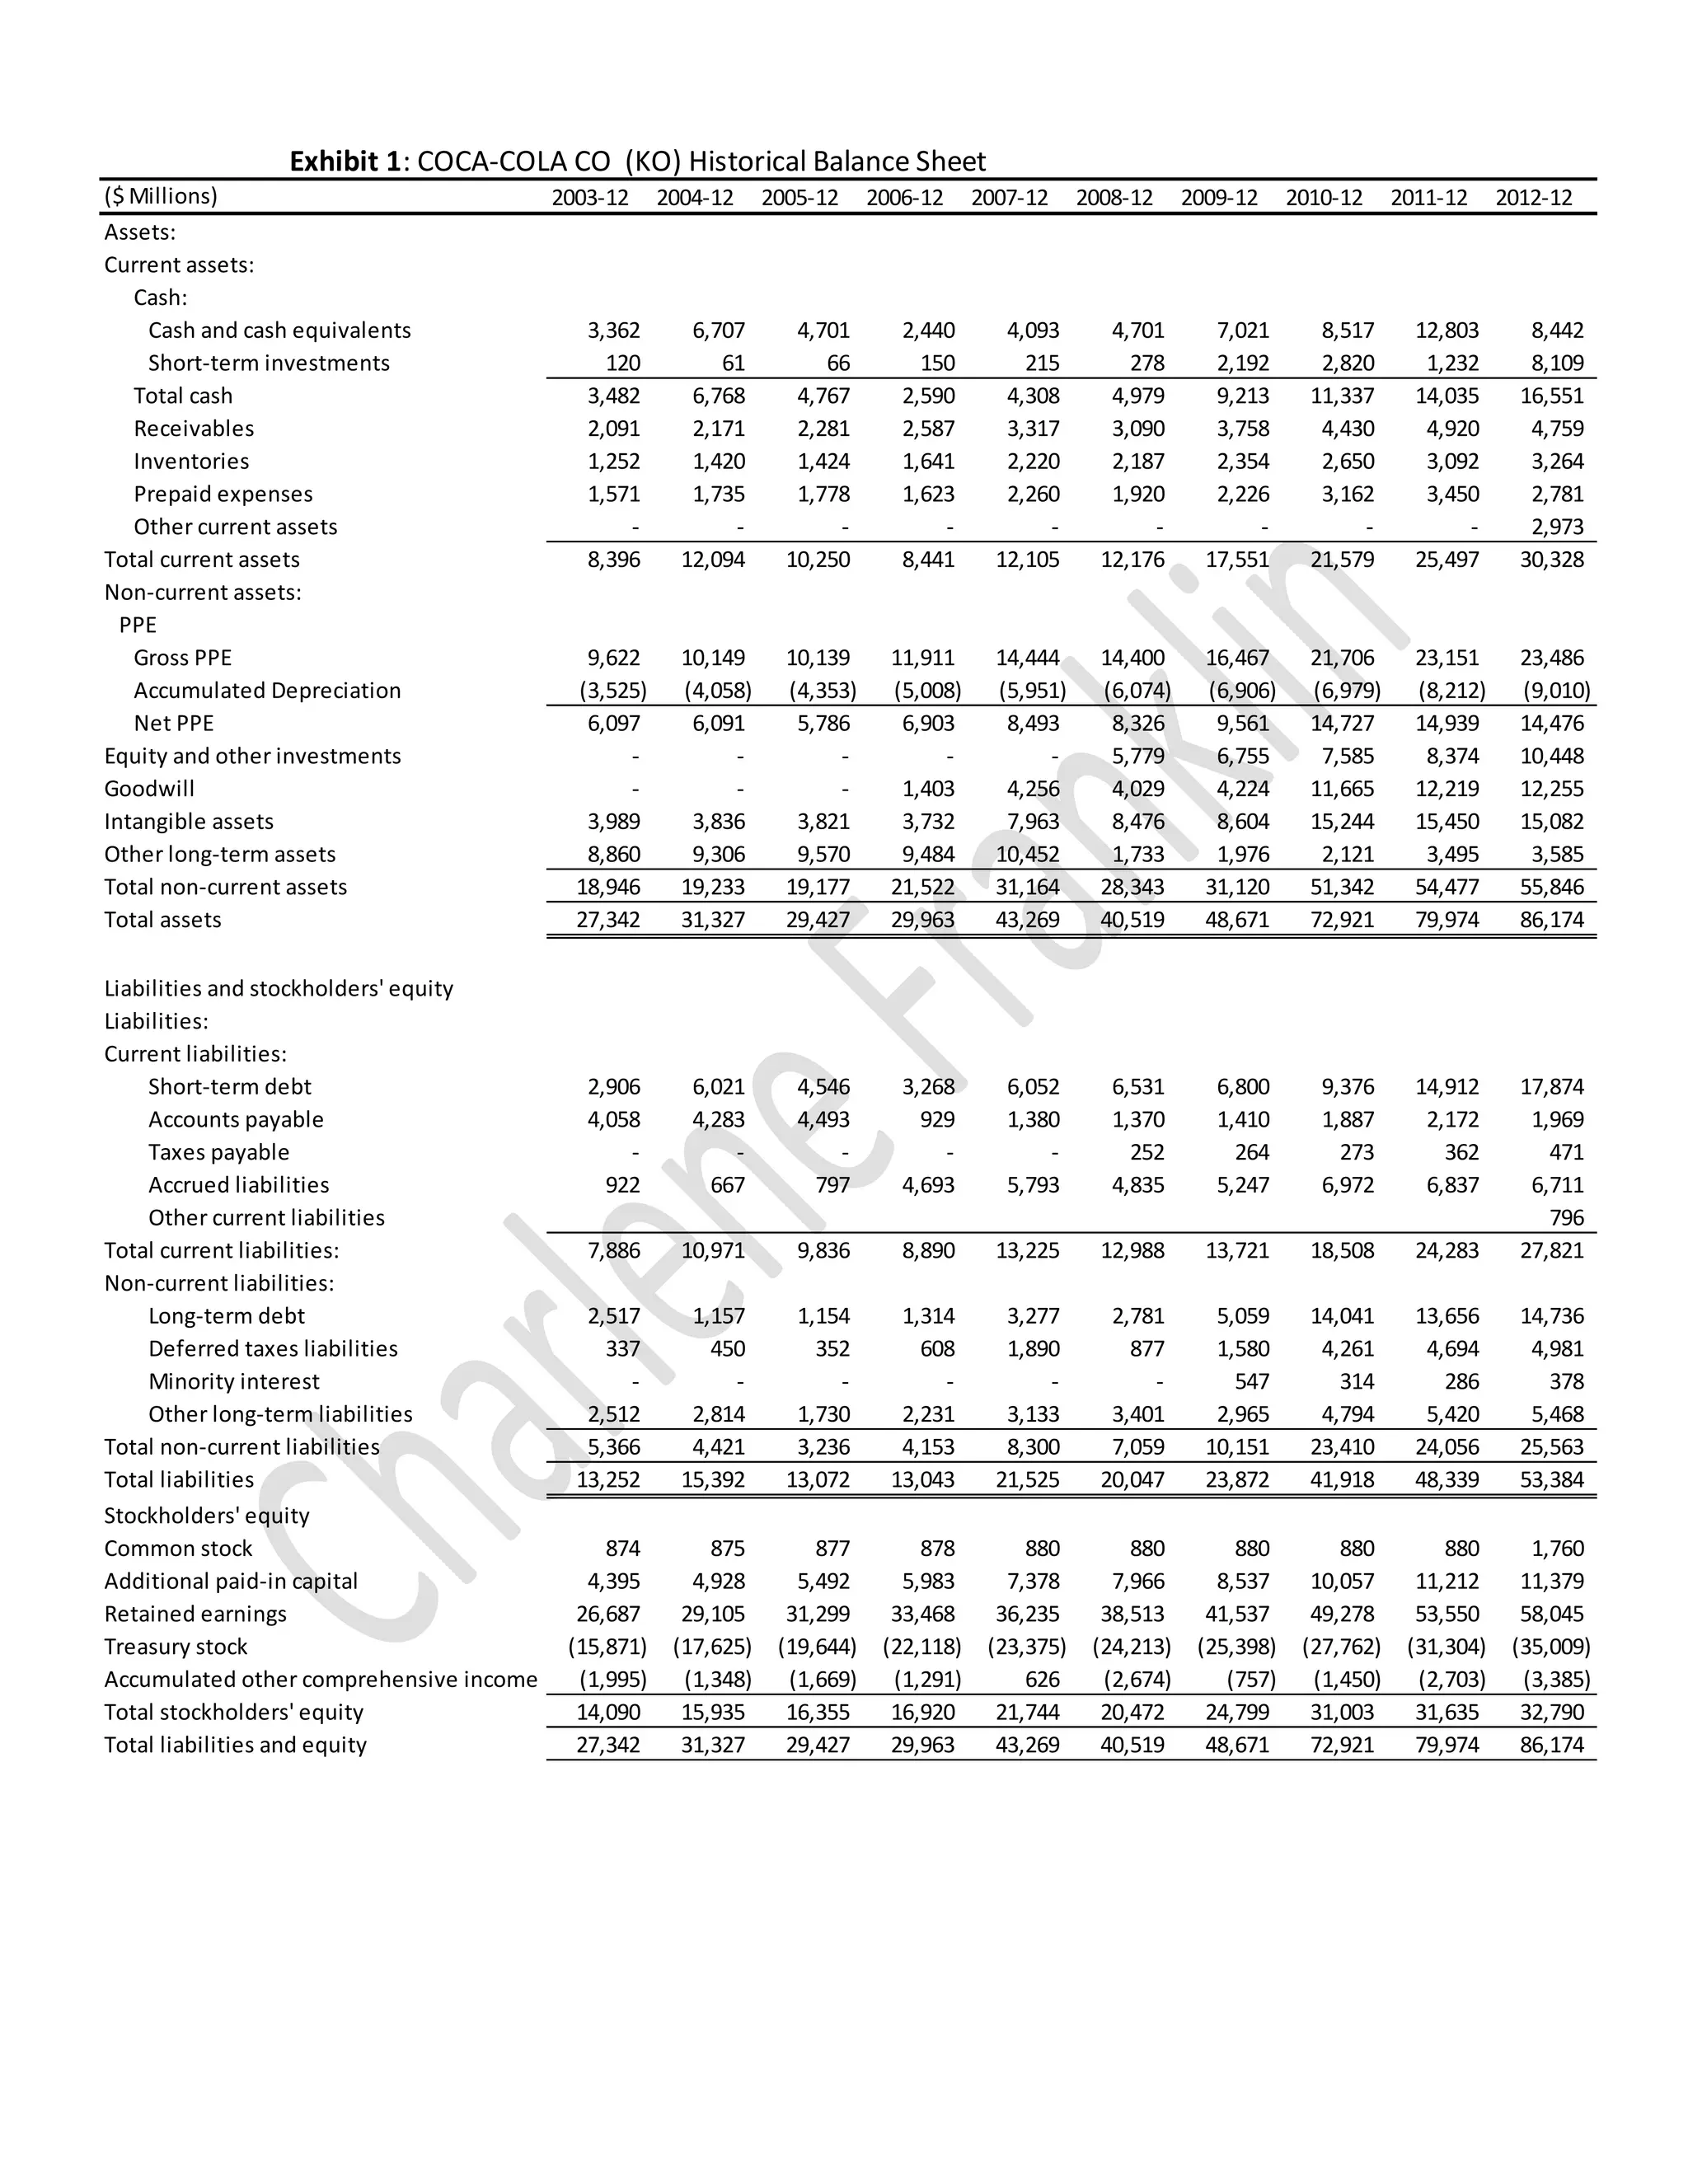
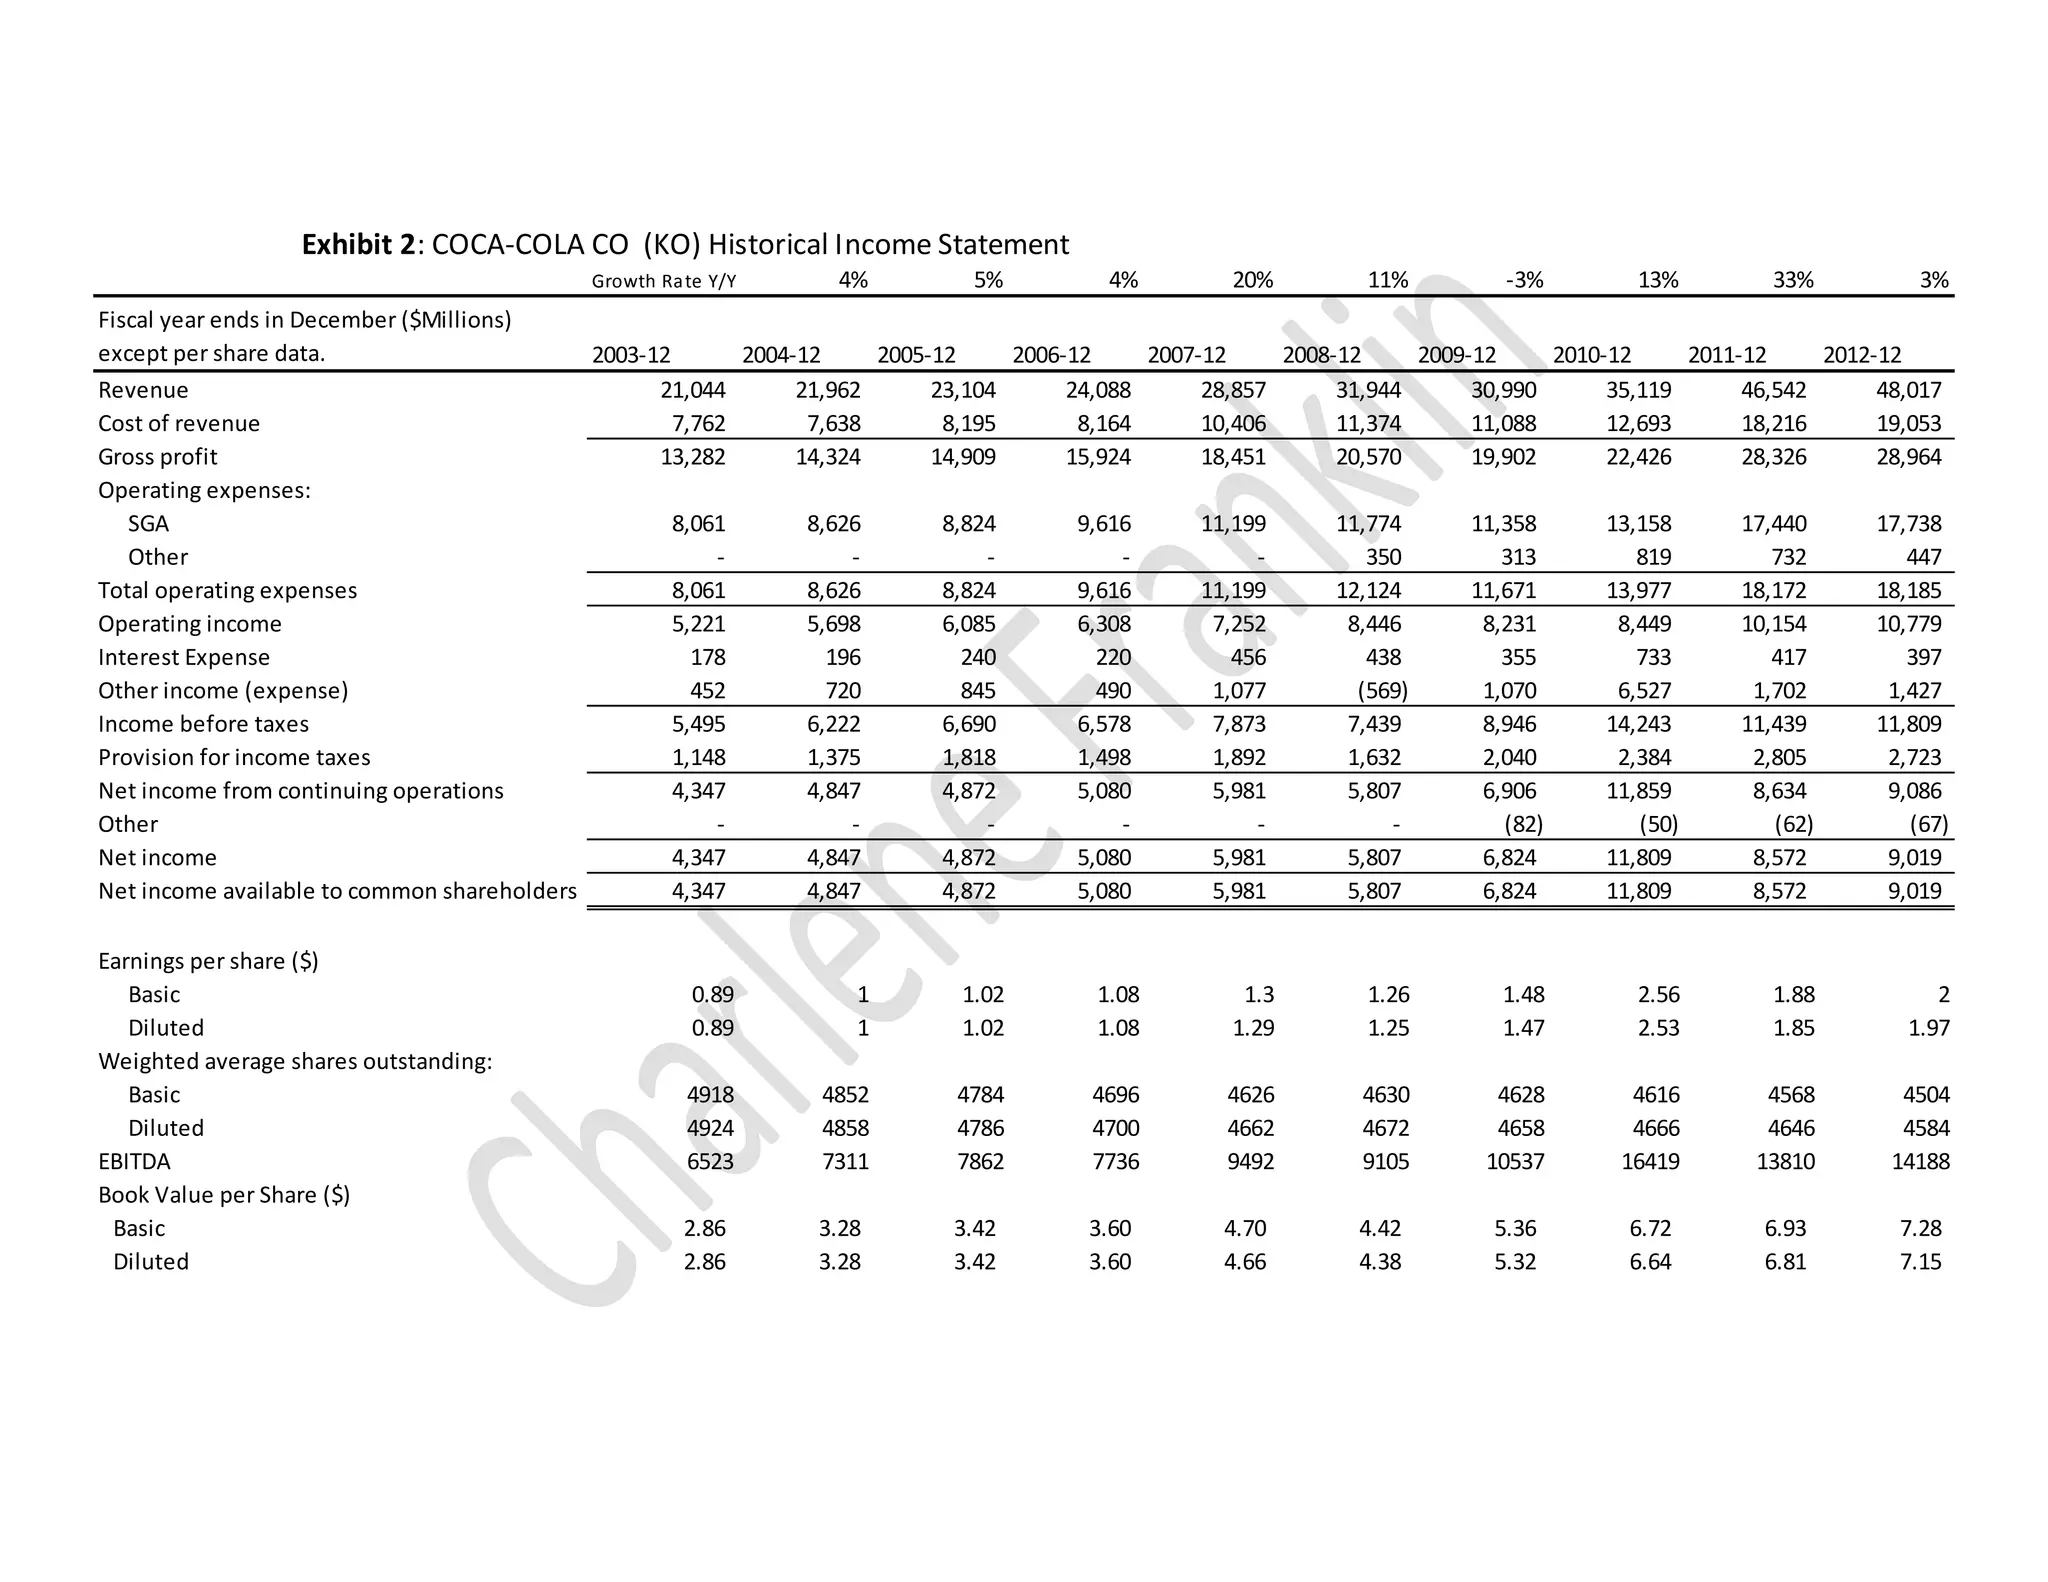
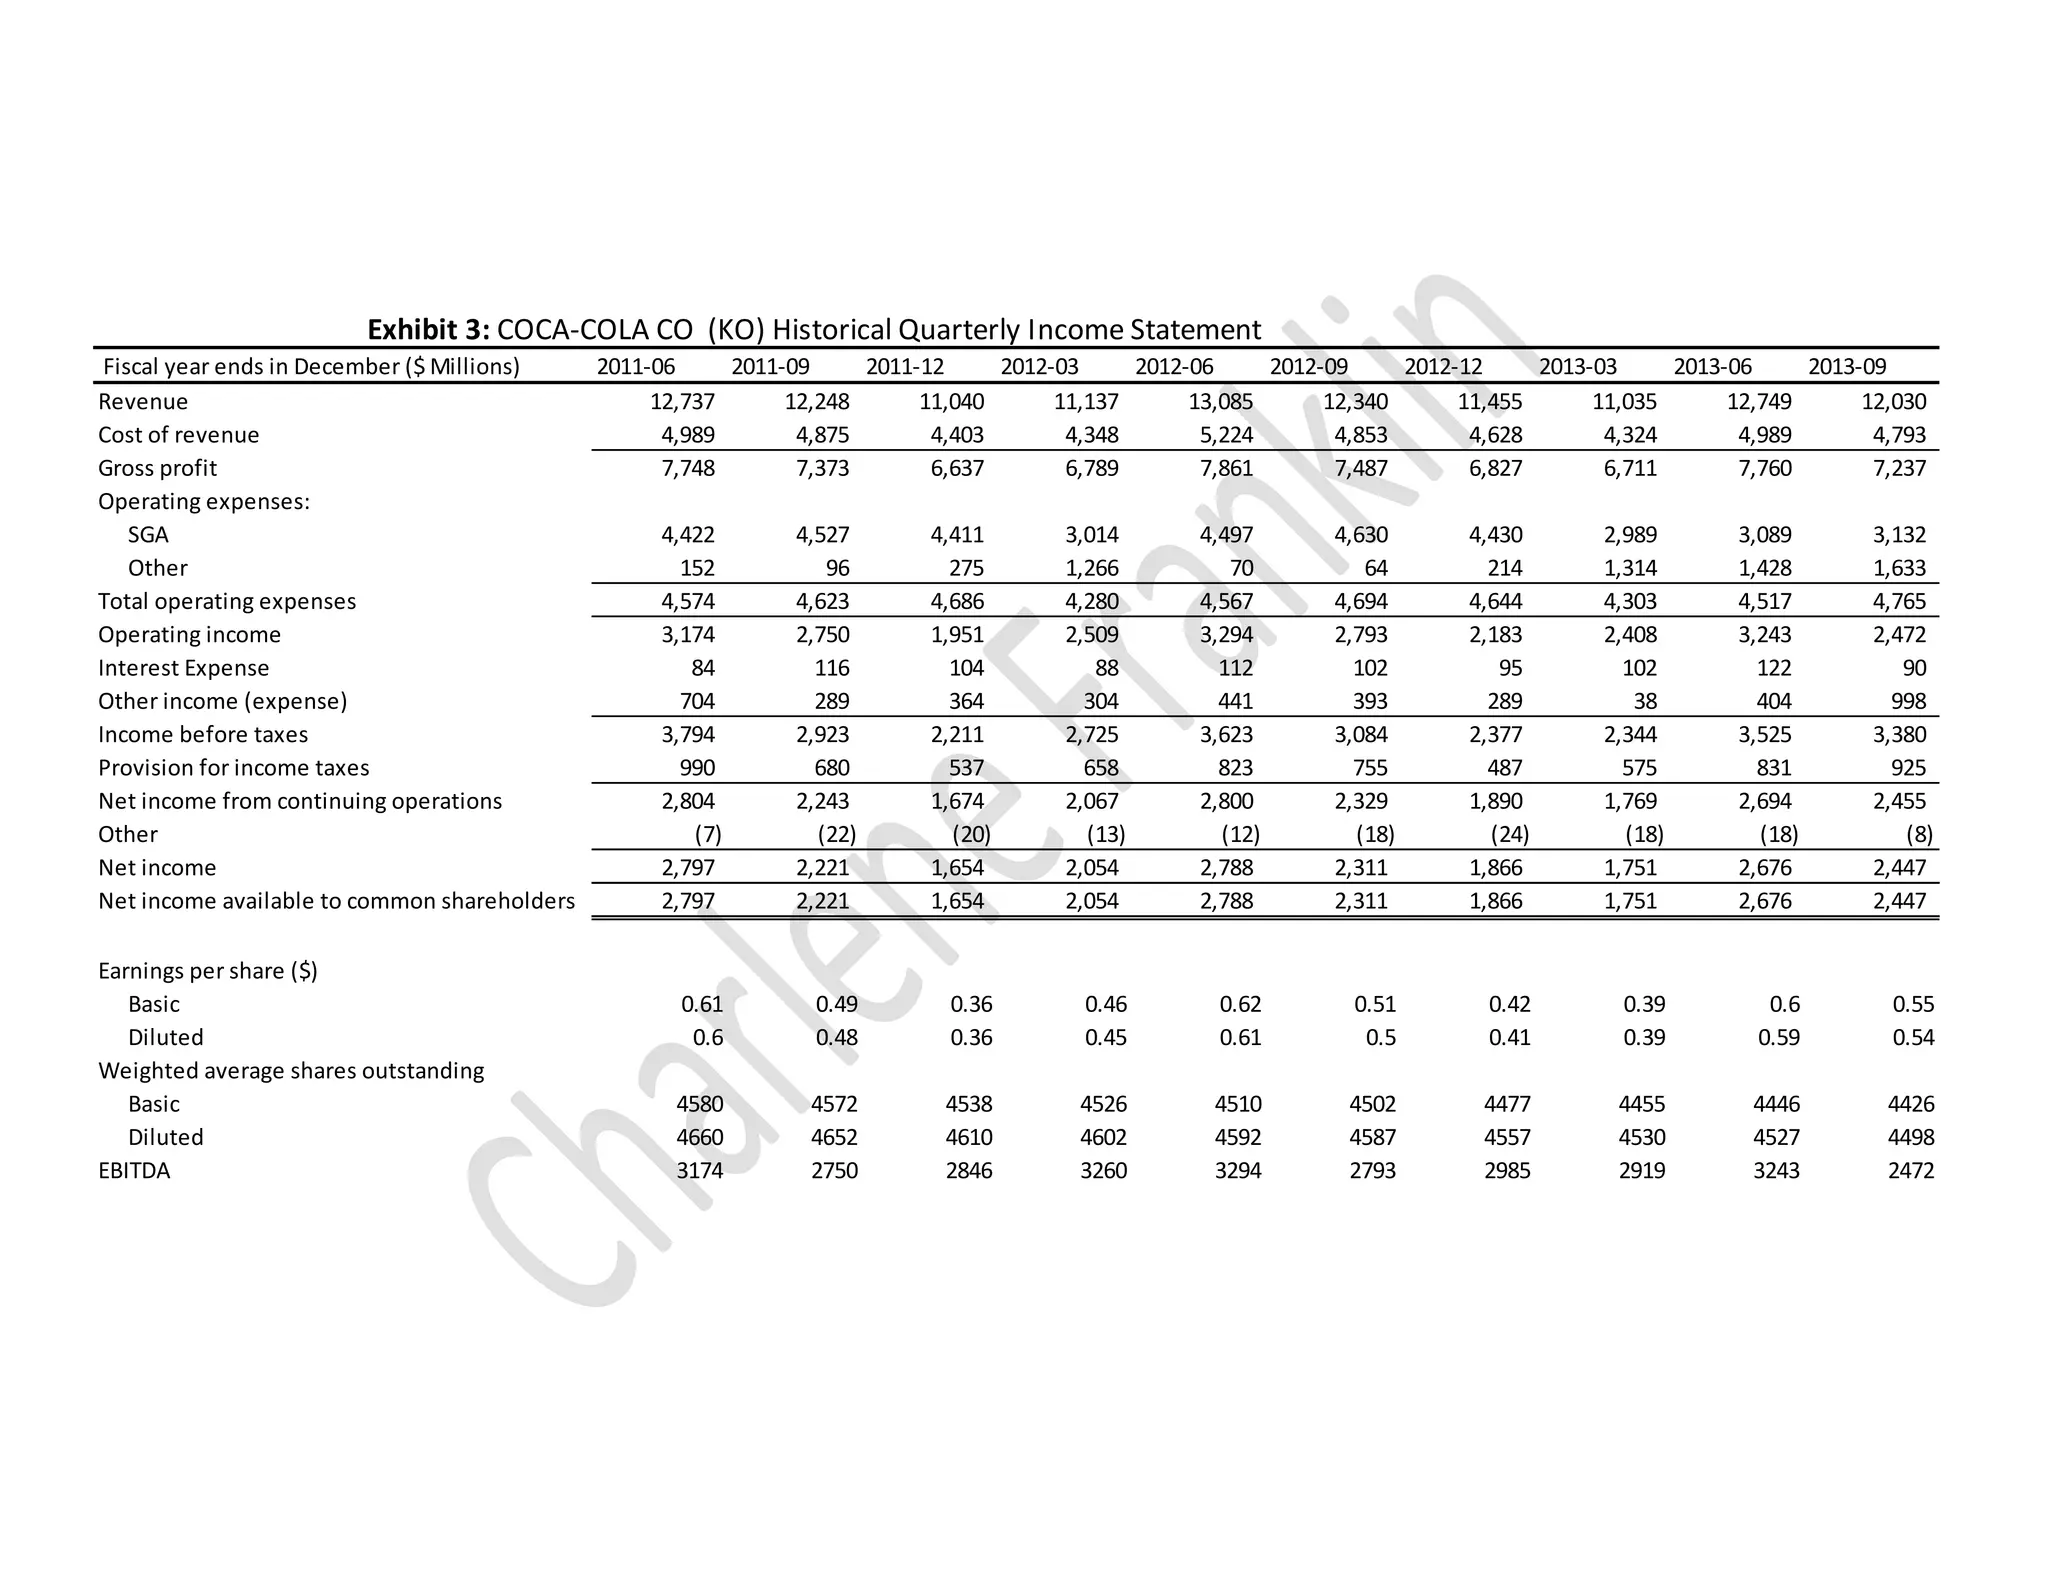
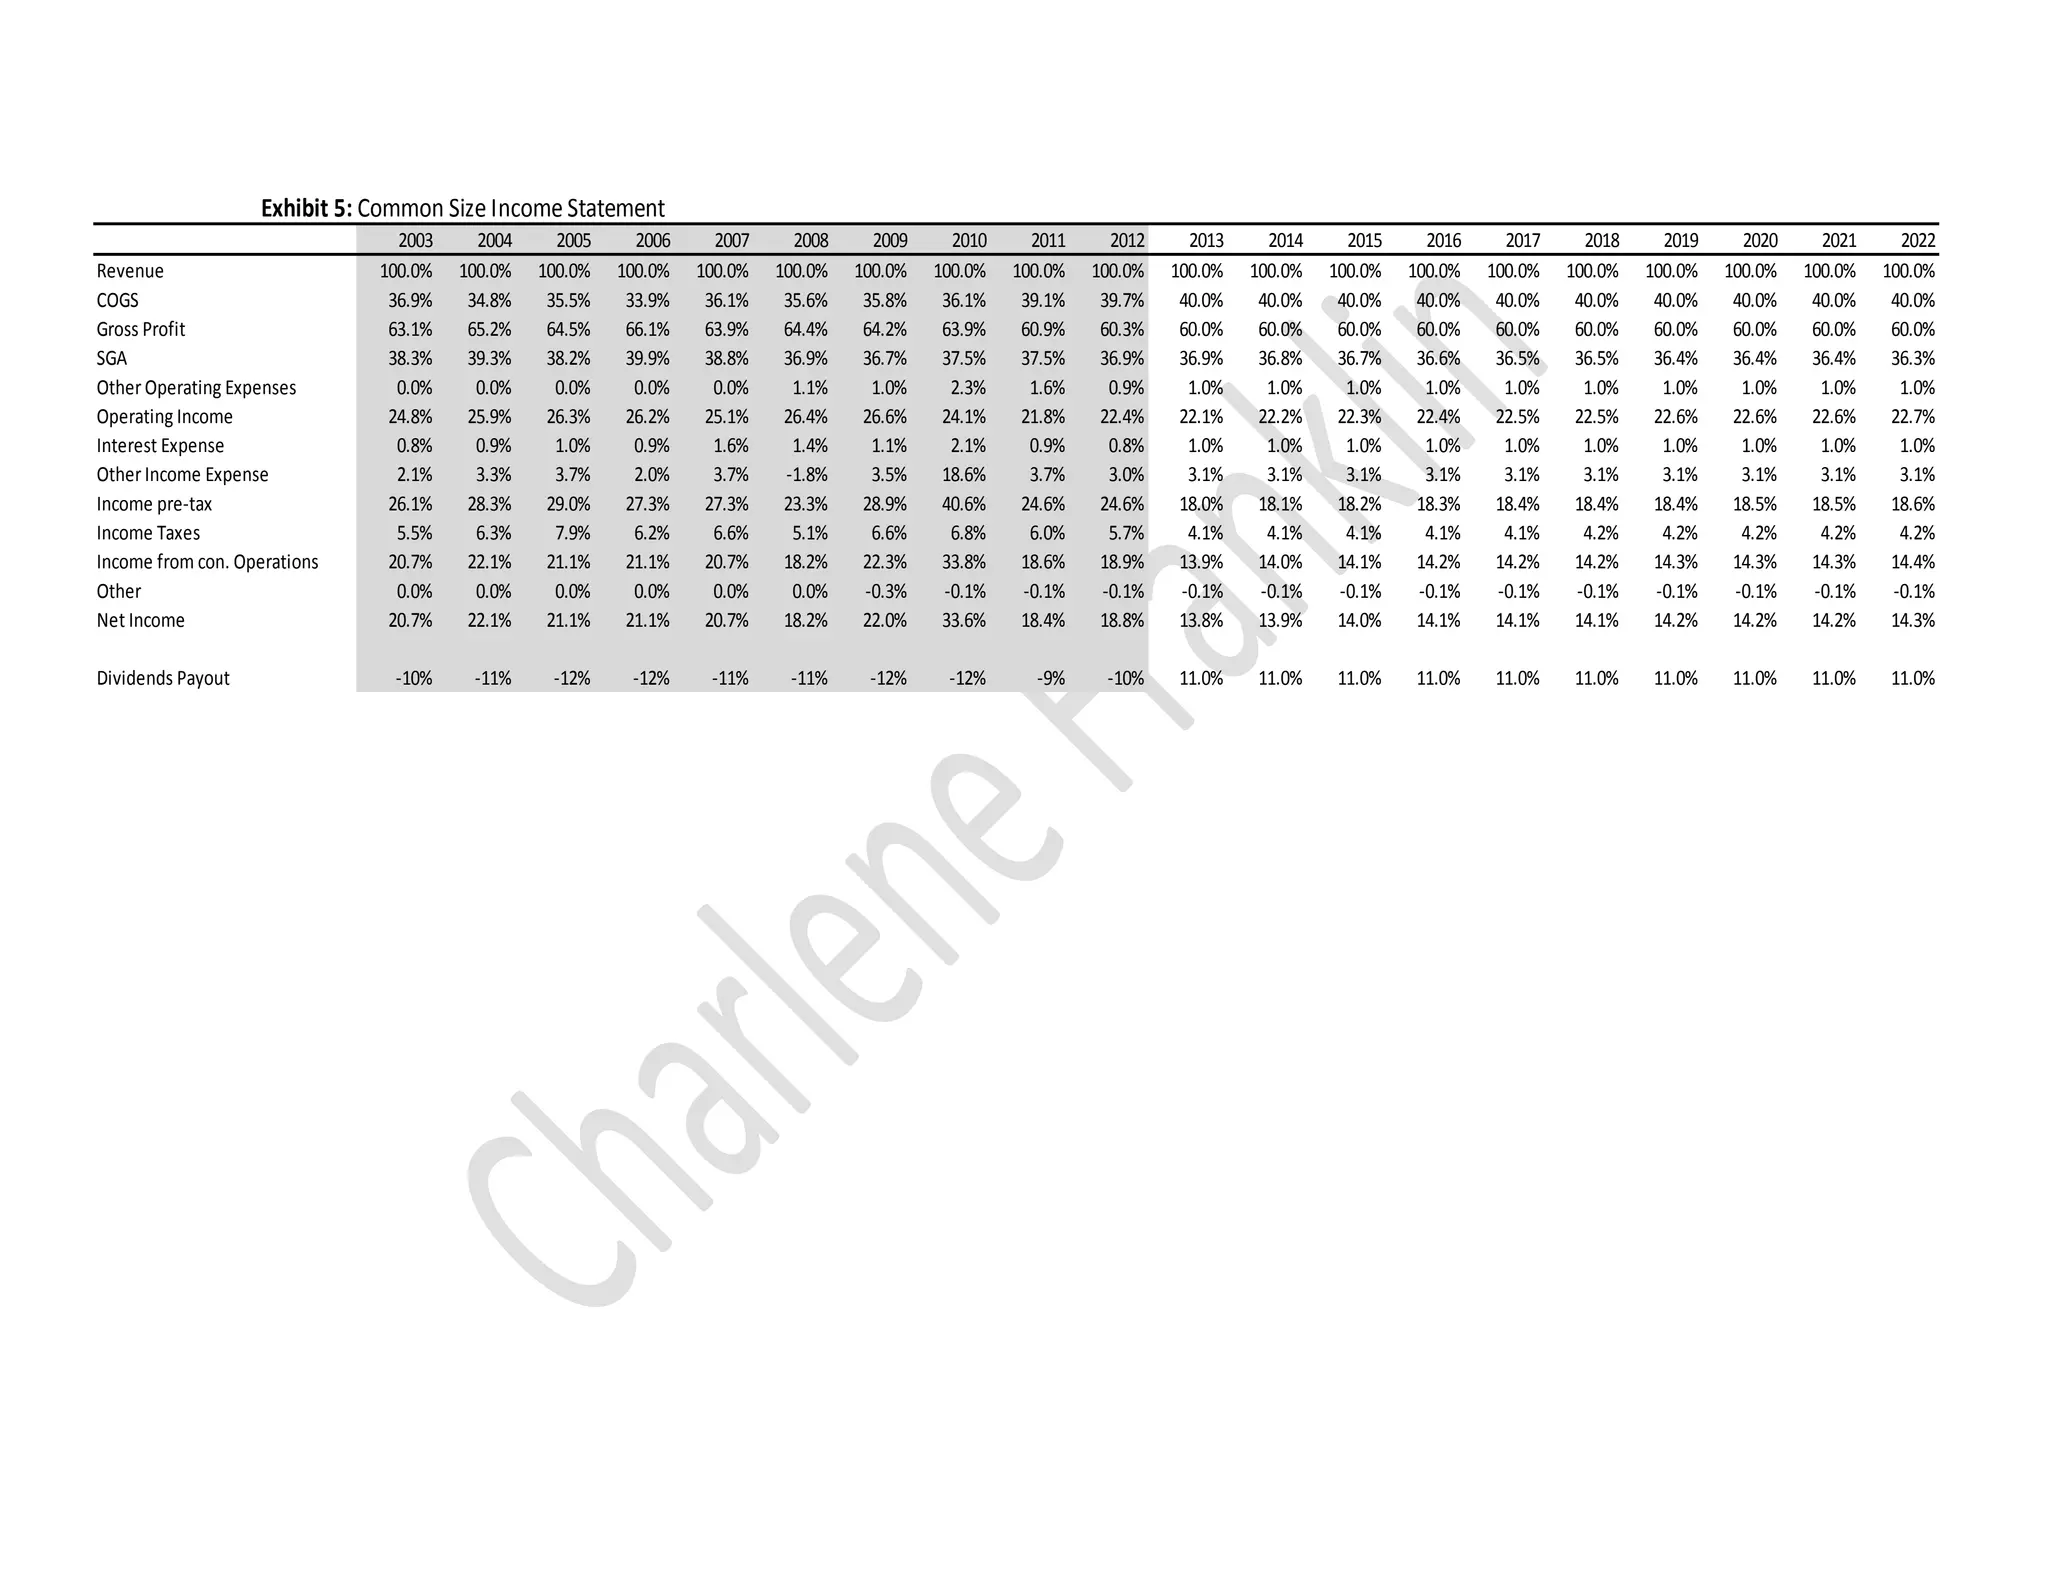
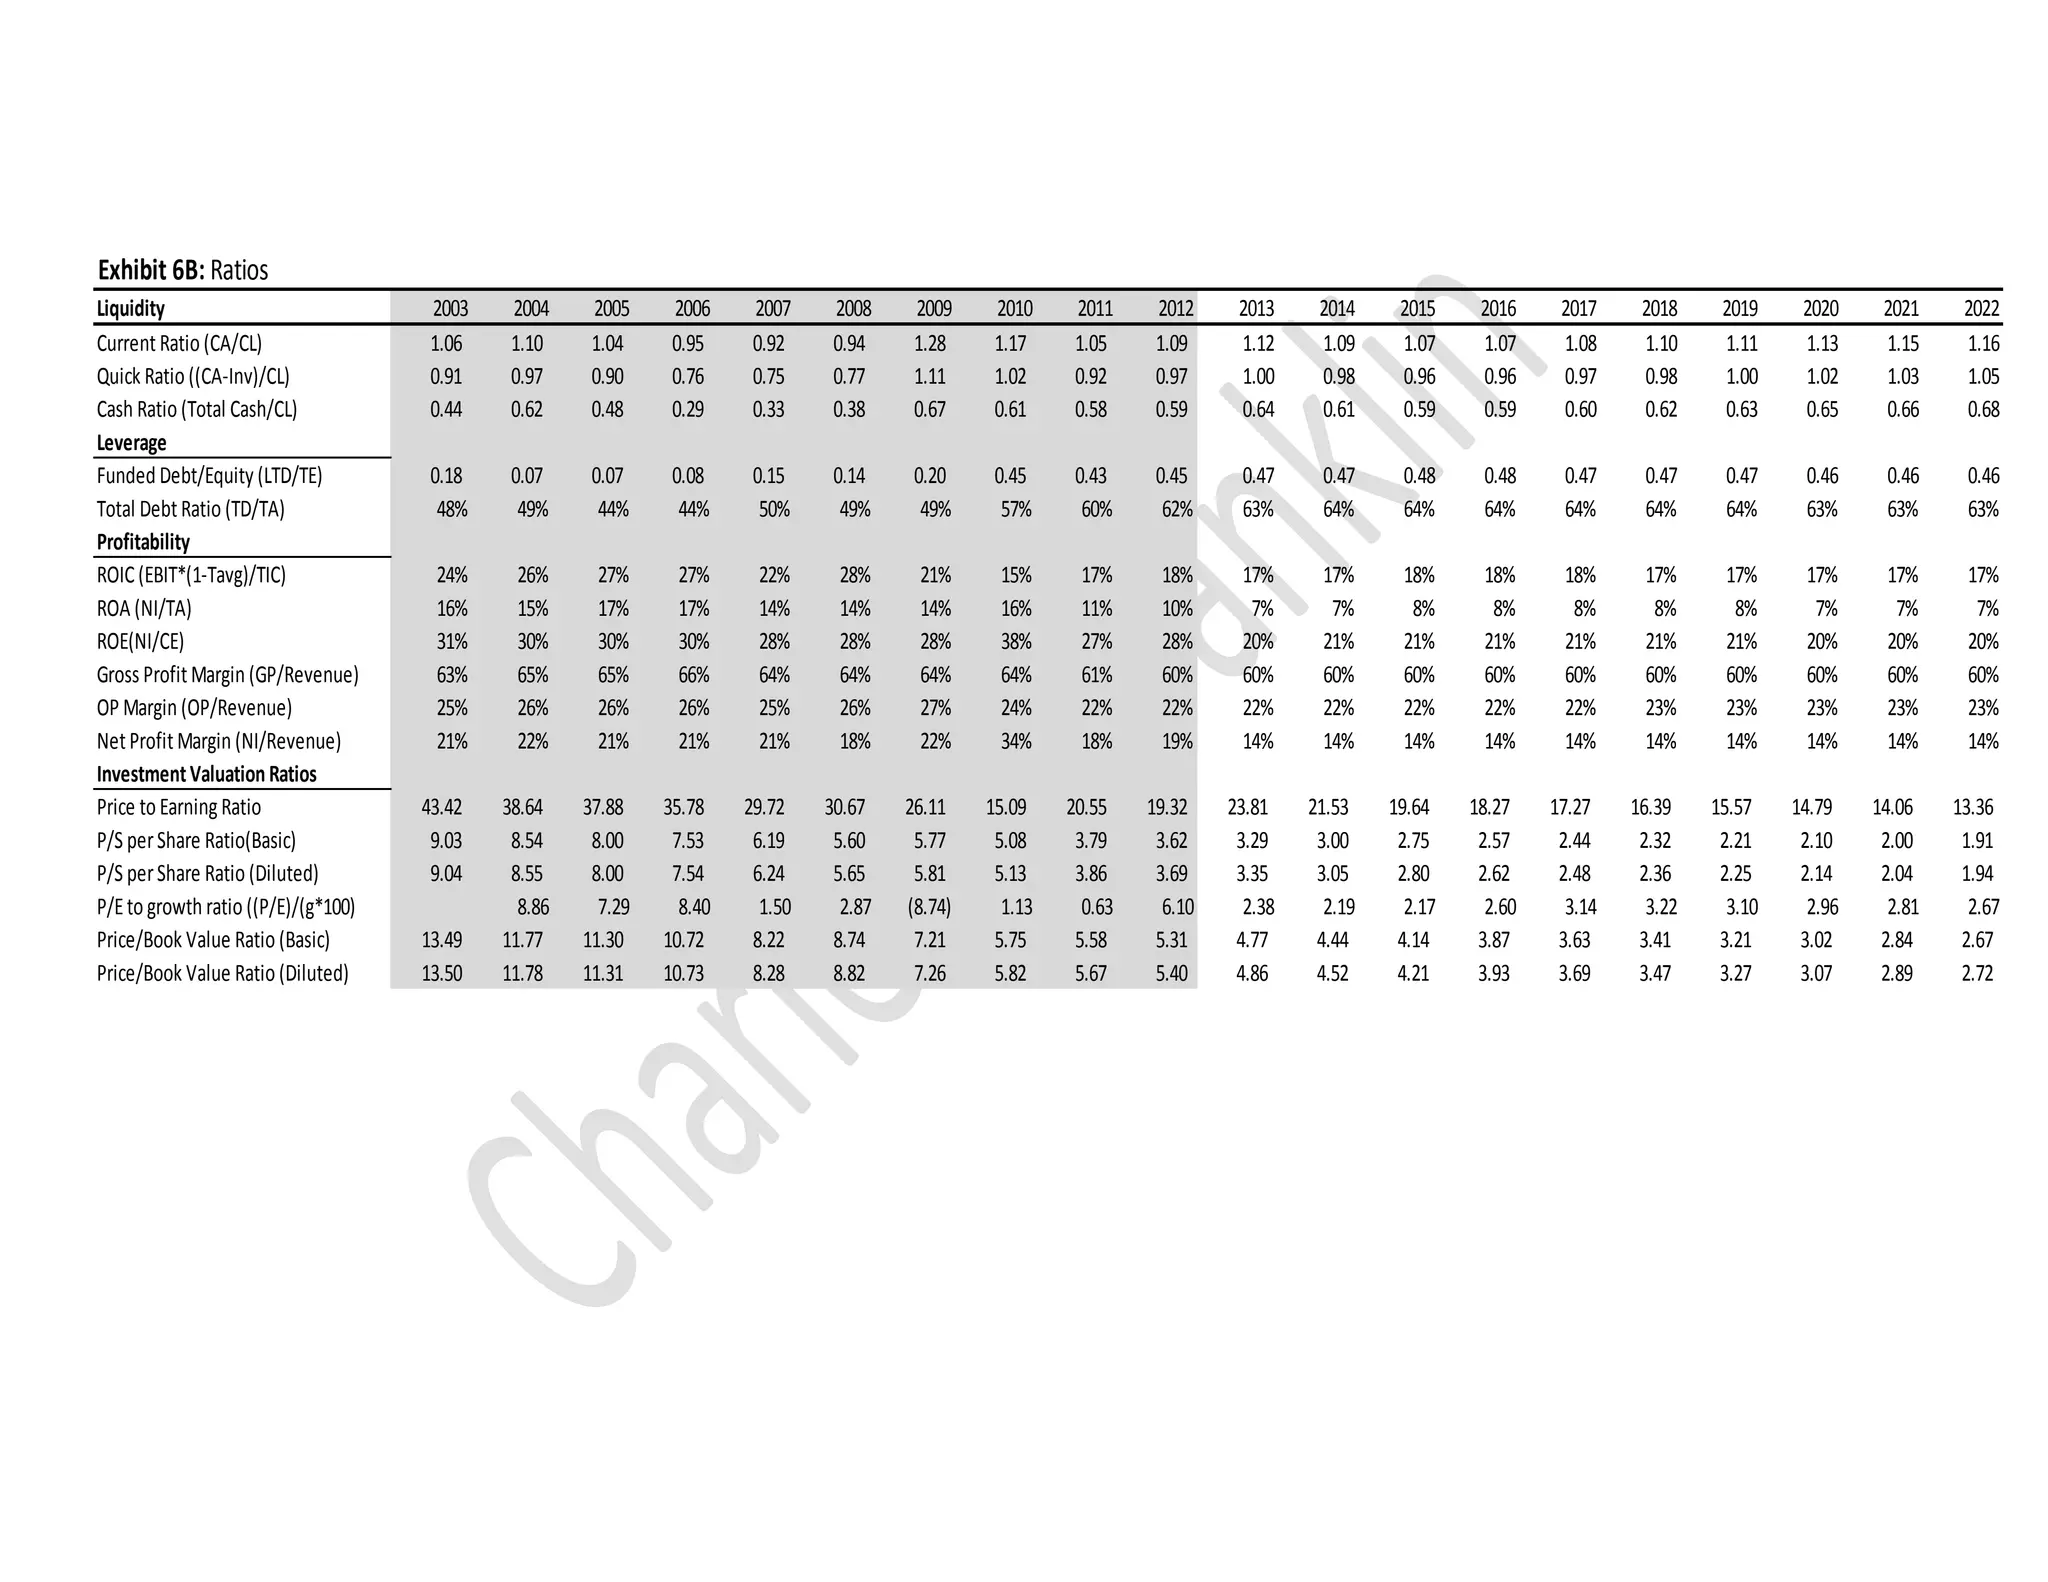
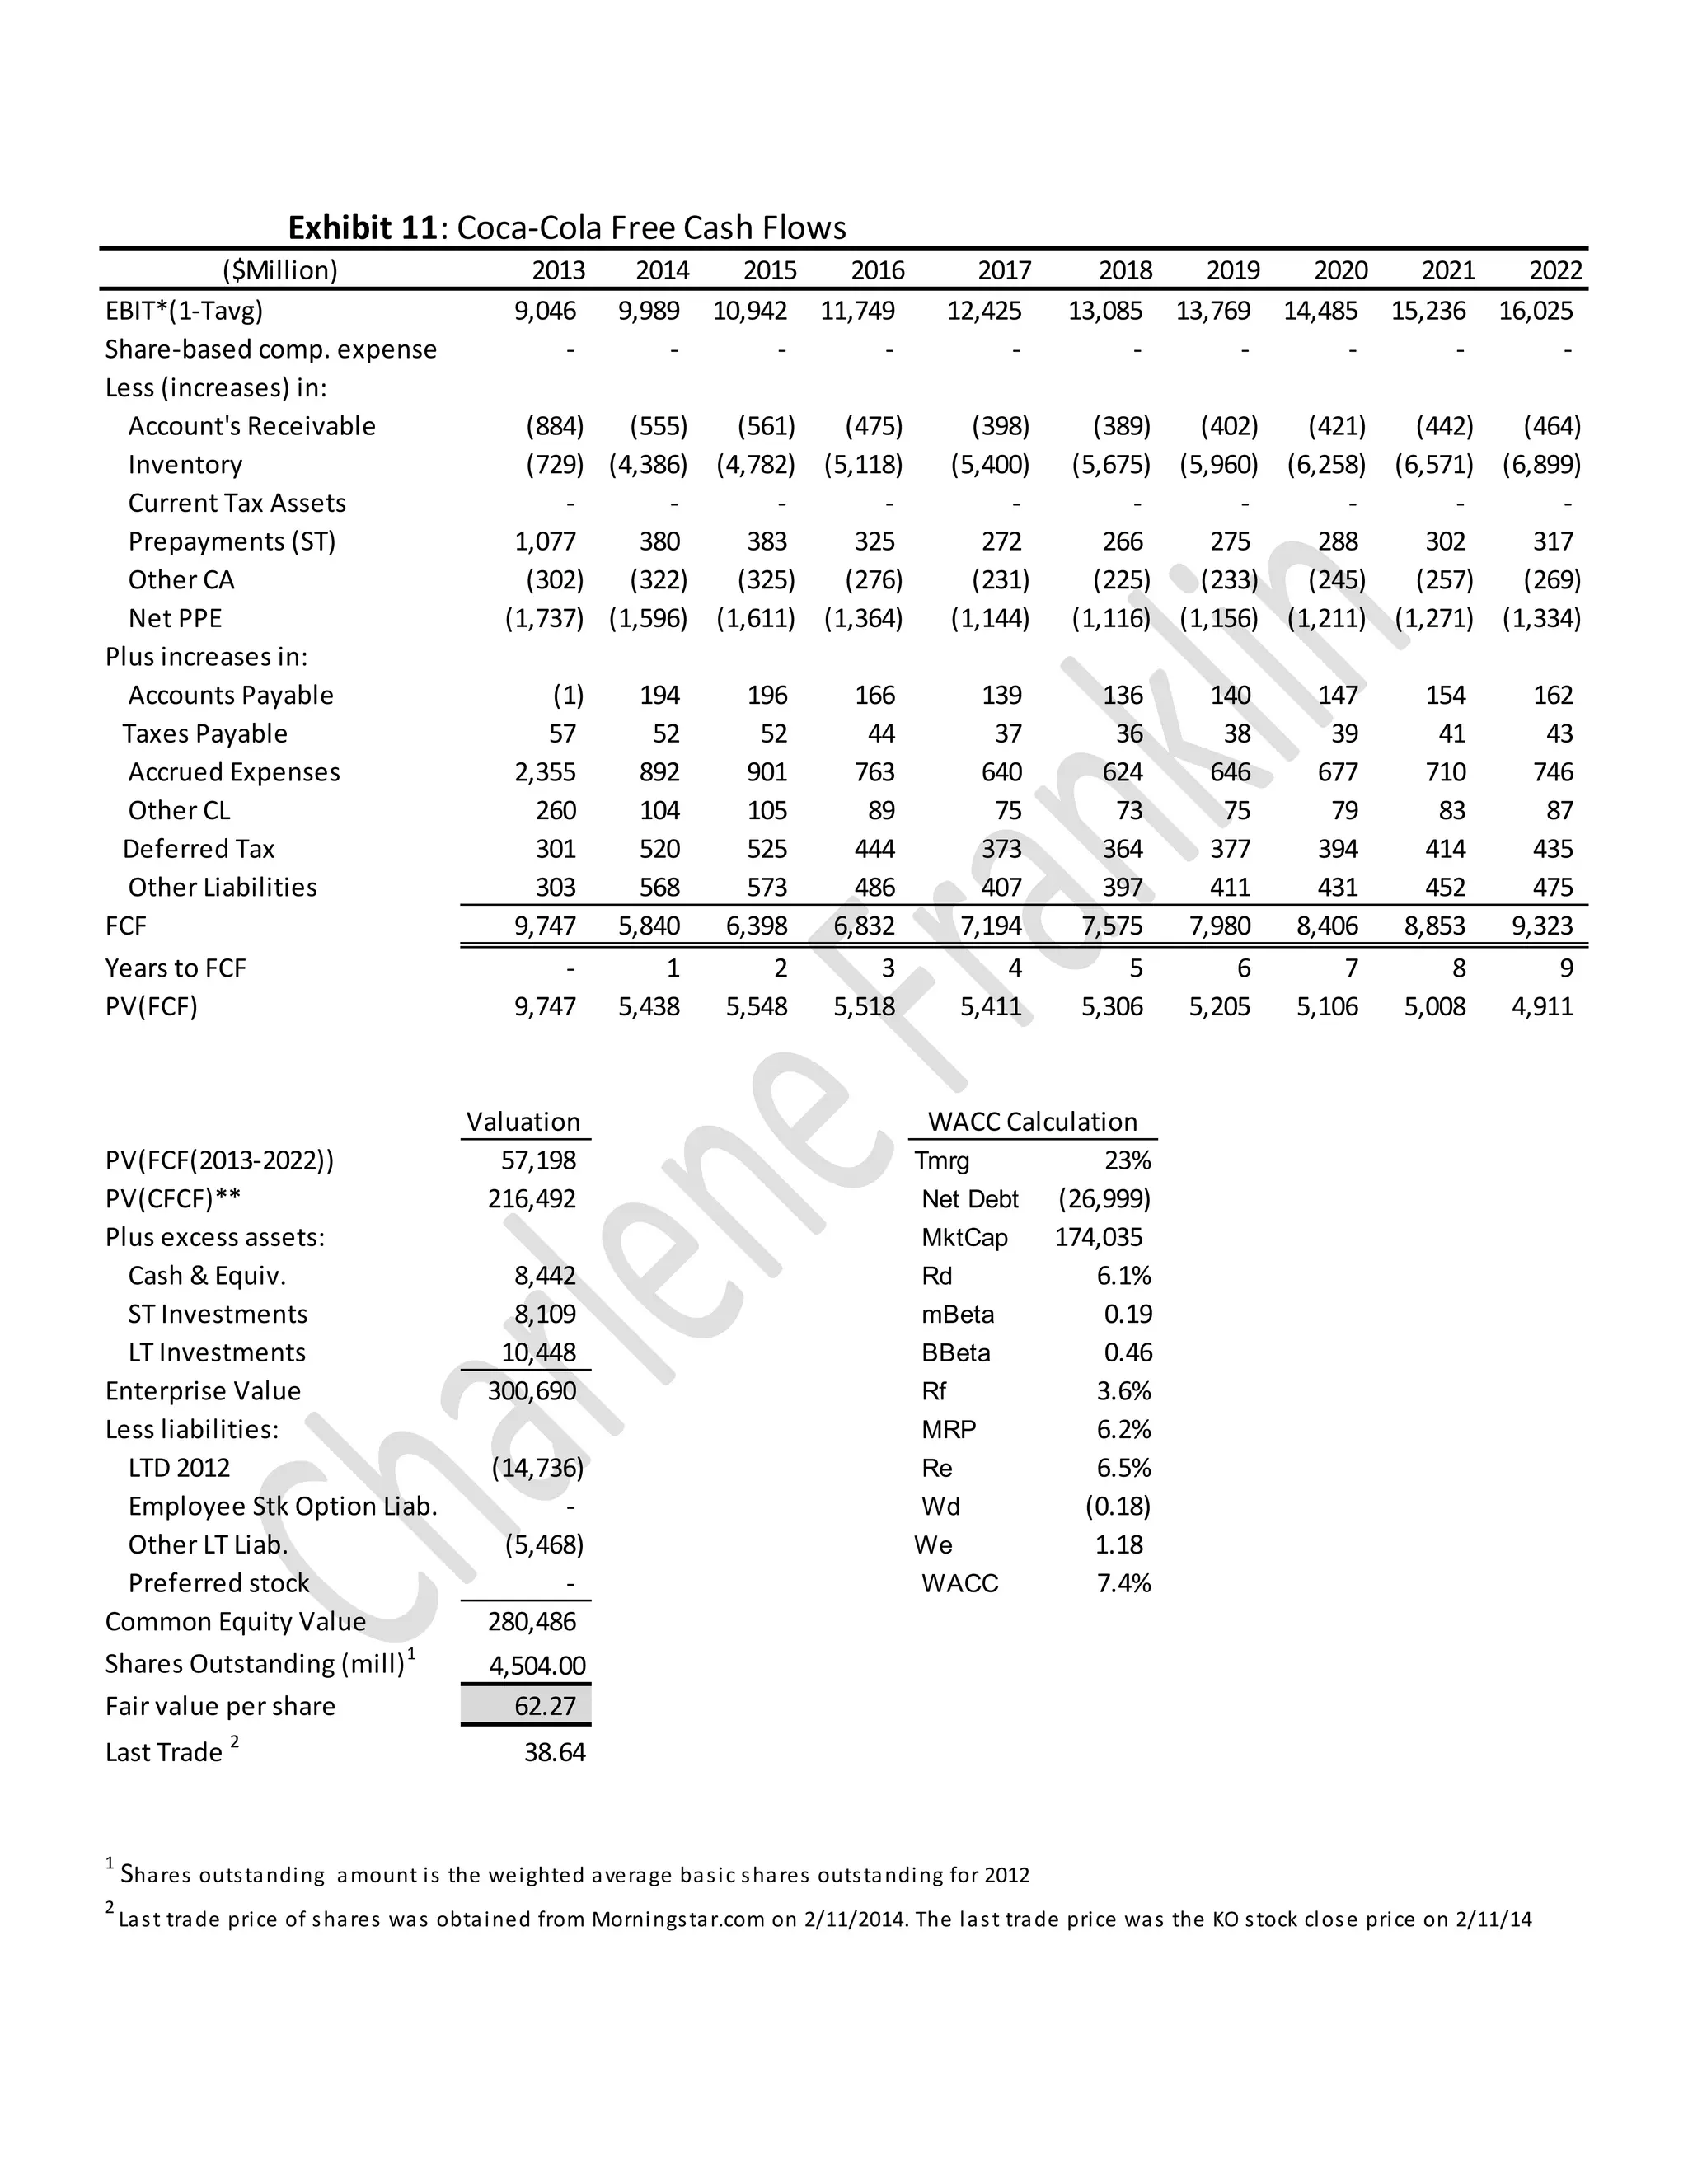
SlideShare a Scribd company logo
Coca-Cola
Charlene Franklin
Fin 449
February 13, 2014
Executive Summary
Coca Cola was founded in 1886 in Atlanta, Georgia, and has become a leading soft drink
producer worldwide. Besides manufacturing the Coca Cola drink, the company is responsible for
introducing a variety of different products to the global market such as Fanta, Sprite, PowerAde,
Dasani and Nestea. Coca-Cola experienced steady growth in sales revenues over the last ten
years. Coca-Cola was able to increase its liquidity and its efficiency over the same time period.
Coca-Cola managed to keep its COGS percentage of sales lower than its main rival, PepsiCo.
Coca-Cola over the last ten years was able to keep its gross profit margin above 60% while rivals
in the industry where unable to do the same.
Based on the historical balance sheet and income statement, a series of ratios were
calculated to produce pro formas. The pro forma balance sheet and income sheet display that
Coca-Cola is able to continue keeping cost of goods sold at similar levels. The pro forma
calculations illustrate the company continuing its 2012’s long term debt levels, while still
producing positive cash flows in the future.
A free cash flow statement was created in order to obtain a fair value of Coca-Cola per
share. An in-depth examination of possible explanations for the difference between the fair value
price of $62.27 and the market value price of $38.46 is analyzed at the end of this paper.
History of Coca-Cola
Coca-Cola was created in 1886 by an Atlanta pharmacist, Dr. John S. Pemberton. Dr.
John S. Pemberton created a flavored syrup mixed with carbonated water and sold it in the
pharmacy’s soda fountain. Frank M. Robinson, who was Dr. Pemberton’s bookkeeper was the
one who thought up the name “Coca-Cola” for the beverage. In 1888, Dr. Pemberton sold
portions of Coca-Cola to various parties. The largest portion was sold to Asa G. Candler.
Candler sold Coca-Cola’s first bottling franchise in 1899. A challenge that overwhelmed early
bottlers was imitations and counterfeits versions of the beverage by competitors. In 1916, the
bottlers approved the unique bottle shape. The 6.5 ounce bottle had a unique skirt design that has
become a renowned bottle shape. The remarkable Coca‑Cola bottle was trademarked in 1977.
Today Coca-Cola has over 3,500 products available in over 200 countries. Coca-Cola is
more than just a soda company, it sells a variety of different types of beverages. The beverages
offered by Coca-Cola include enhanced waters, noncarbonated energy drinks, juices, ready-to-
drink teas, coffees, and sport drinks. The company also provides flavoring ingredients,
sweeteners, powders for purified water products, and fountain syrups. Brands that are a part of
the Coca-Cola Company include DASANI, Fanta, Minute Maid, Odwalla, Sprite, and glacéau
vitaminwater.
Analysis of Coca-Cola Historical Data
Coca-Cola over the last 10 years has experienced positive revenue growth rates except in
2009. In 2009, the company suffered a negative revenue growth rate. The year’s negative
revenue growth could have been due to the volatile economic environment. The decrease in
consumer spending in United States and across the world may have affected Coca-Cola sales for
2009. While 2009 sales growth was not impressive, Coca-Cola had large growth rates of 20% in
2007 and 33% in 2011. The company’s double digit revenue growth rate in 2007 was provided
by the company’s strong sales overseas during that period.
The company over the last 10 years has shown an increase in its long term debt to total
assets. In 2012 Coca-Cola had a long-term debt ratio of 17% which was more than double the
rate of 4% in 2006. It appears that Coca-Cola is becoming more reliant on debt in order to grow
the company. The dependence on debt could be from the company’s expansion into new
markets. Coca-Cola over a period from 2003 to 2012 acquired multiple companies. Some of the
newly acquired companies likely needed substantial capital during their purchase. Long term
debt was possibly used to finance these acquisitions. Coca-Cola’s other liabilities from 2003 to
2012 either stayed the same or experienced a decrease. The company’s accounts payable
declined over a 10 year time period of 191 days outstanding in 2003 to 38 days outstanding in
2012.
The past acquisitions could explain Coca-Cola’s motives for decreasing its accounts
payable while increasing the cash they have on hand. Coca-Cola’s historical balance sheet
displays that the company prefers to keep large amounts of cash on hand. One of the motives
behind Coca-Cola possessing large amounts of cash could be a precautionary measure. Coca-
Cola might prefer to have large amounts of cash on hand in case of another financial crisis like in
2009. Another possible reason could be that they expect a large expense associated with a new
partnership such as Green Mountain that was announcement a few weeks ago. Coca-Cola could
have been anticipating a large amount of cash needed for the new partnership. This cash hording
move by Coca-Cola could be due to the company wanting additional cash on hand to cover
potential mergers and acquisitions.
How Coca-Cola Comparesto Industry Rivals
In the Industry of Soft Drinks, Coca-Cola and PepsiCo are the two big gorillas. Coca-
Cola and PepsiCo have been battling each other for more than a century. PepsiCo’s COGS
percentage has been around 43% to 48% over the last ten years, whereas Coca-Cola has had a
34% to 39% of over the same time frame. The difference between Coca-Cola and PepsiCo’s
COGS might seem small except when you consider that both companies have sales revenue in
the billions each year. The small difference of 2-5% adds to tens of thousands of dollars each
year. Coca-Cola had a slightly higher operating profit margin ranging from 22% to 27% over the
ten year period than PepsiCo. PepsiCo endured an operating profit margin extending from 14%
to 19% over the same period. This signifies that Coca-Cola has better control over its cost
compared to PepsiCo.
Overall, Coca-Cola and PepsiCo have similar margins and ratios. It appears that when
Pepsi experiences a sharp decrease in revenue growth, Coca-Cola experiences that same effect
on its growth revenue. The similarities in growth rates and COGS margin show that possible
industry factors such as the price of sugar have the equivalent effects on the two companies.
Pro Forma Income Sheet Analysis
The assumed revenue growth for Coca-Cola’s pro forma income statement was based on
the average growth rate from 2003 to 2012. One motive behind that assumption was due to the
inconsistence of Coca-Cola’s sales growth. Coca-Cola had a sales growth ranging from -3% to
33%. Another motivation behind the assumed growth rate is caused by its recent announcement.
Coca-Cola’s announced expanding operations into the at-home beverage system sector. The
company will likely observe an increase in revenue as it begins to enter into a new market
segment. Entering into a new market with large potential profits is a reason behind the
assumption that Coca-Cola will have a sales growth rate of 10%. The suggested rate of 10%
sales growth as opposed to a higher rate is due to an already present and successful competitor in
the new market. Coca-Cola has strong brand recognition and a loyal customer base, so it’s not
expected that Coca-Cola will experience negative sales growth in the next 10 years.
The expectation that COGS will be 40% of sales for the next ten years, is based on trends
from the past ten years. The COGS for the last two year were 39% of sales, so it’s expected that
COGS will stay on the same trend. The dividend payout ratio is predicted to be 10% of sales.
That assumption was based on the historical dividends payout ratio, which was around 9% to
12% over the last ten years.
Pro Forma BalanceSheet Analysis
The pro forma cash and equivalents is assumed to be 72 days of cash. That idea was
made based on the average of the cash on hand that Coca-Cola had for the last ten years. The 72
days of cash on hand appears to be an appropriate notion when looking at the last four years.
Coca-Cola for the last four years had a minimum of 64 days of cash on hand and a maximum of
100 days. The thought that short term investments will decrease from 16.9% of sales to 8.7% for
the next ten years was based on the average rates from 2003-2012. That assumption was also
based on Coca-Cola entering a new partnership with Green Mountain which is likely to require
significant investments from Coca-Cola. That new partnership could cause Coca-Cola to scale
back their short term investments while they focus their efforts on the Green Mountain
partnership.
The idea that long term debt will continue to be 17% of its assets, is based on Coca-
Cola’s historical balance sheet ratios and financing needed for acquisition and partnerships.
Coca-Cola’s long term debt for the last two years has stayed at 17% over assets. With Coca-Cola
entering a new market segment of in home beverage system, the company is likely to encounter
new obligations to be achieved in part by long term debt financing.
Valuation of Coca-Cola
It is calculated that Coca-Cola has a current fair value of $62.27 per share. The fair value
price is higher than the last stock price of $38.64 on February 11, 2014. It appears that Coca-
Cola’s stock is currently undervalued. A possible reason is its P/E ratio. Coca-Cola has a P/E
ratio of 23. 81 for 2013. Some investors prefer a lower P/E ratio. The decrease of soda sales
could also be contributing to the undervaluation of Coca-Cola. Americans have decreased their
consumption of soda by 3.5 gallons per person compared to five years ago. Soda sales
throughout industry the having been decreasing over the years. The decrease in consumption
sales might have affected investors’ confidence in Coca-Cola stock.
The investors’ confidence in Coca-Cola could also be low due to other factors such as the
amount of cash Coca-Cola has on hand. Coca-Cola kept a large amount of cash on hand, which
might worry some investors. Investors might have concern that Coca-Cola’s large holding of
cash is a sign the company is taking precautionary effects, tempting investors to pass on
investing. Investors and the market could have a lack of confidence in Coca-Cola’s ability to
create double digit growth rates. Coca-Cola showed a revenue growth rate in double digits in
only 3 of the last 10 years. Based on past sales, investors might expect Coca-Cola’s future
revenue growth rate to be minimal. If investors and the stock market believe that Coca-Cola’s
revenue growth is going to be less than the assumed 10% used in Exhibit 7, then it would cause
the fair value per share to be closer to the current market price of the stock.
An alternative reason that the fair value is higher than the stock price, could be due to the
risk associated with the company. The market might view Coca-Cola’s stock at a higher risk than
the risk used for the calculation of the fair value per share. The risk used for the fair value
calculation was 7.4%. If a higher risk rate such as 13% was used it would make the fair value per
share closer to the stock price. Also, the beta used to calculate the fair value per share of $62.27
was only .19 when the market used a beta of .34 to value Coca-Cola stock. Furthermore this
impacted the difference between the market value and fair value price per share.
The emerging threat of home beverage makers like Soda Stream, could also be
contributing to Coca-Cola’s undervaluation. Coca-Cola and PepsiCo used to account for 70% of
the soft drink beverage market. Coca-Cola underestimated the ability of Soda Stream to enter its
competitive industry. Investors might have not have had the same thinking as Coca-Cola and
viewed Soda Stream as a threat. The company’s impassive response to Soda Stream might have
doubted investors trust in Coca-Cola. Coca-Cola just recently acknowledged Soda Stream as a
threat and the actions it plans take to ensure it doesn’t lose additional market share.
A combination of those factors potentially lead to the undervaluation of Coca-Cola stock.
The company’s future actions and the way the market views those actions will only tell whether
the company will continue to be undervalued or not.
References:
"Yahoo Finance - Business Finance, Stock Market, Quotes, News." Yahoo Finance. N.p., n.d.
Web. 11 Feb. 2014. <http://finance.yahoo.com/>. Used to obtain Coca-Cola and S&P 500
monthly market prices
Spending on Soft Drinks Dropped 3.3% between Late November, and A. Year Ago. "Soda Sales
Are Losing Their Fizz." CNNMoney. Cable News Network, 10 Dec. 2013. Web. 12 Feb. 2014.
<http://money.cnn.com/2013/12/10/news/companies/soda-sales-slump/>.
"PepsiCo Inc." PEP XNYS:PEP Stock Quote Price News. N.p., n.d. Web. 14 Feb. 2014.
<http://quotes.morningstar.com/stock/s?t=PEP®ion=usa&culture=en-US&ownerCo Kavilanz,
Parija B. "Coca-Cola Posts Higher Profit, Sales." CNNMoney. Cable News Network, 17 Oct.
2007. Web. 14 Feb. 2014.
<http://money.cnn.com/2007/10/17/news/companies/coke/>.untry=USA>.
"Is the Coca-Cola Partnership With Green Mountain Truly a Game Changer?"
DailyFinance.com. N.p., n.d. Web. 14 Feb. 2014. <http://www.dailyfinance.com/2014/02/10/is-
the-coca-cola-partnership-with-green-mountain-t/>.
"Coca-Cola History." World of Coca-Cola. N.p., n.d. Web. 11 Feb. 2014.
<http://www.worldofcoca-cola.com/coca-cola-facts/coca-cola-history/>.
"Coca-Cola Co." KO XNYS:KO Stock Quote Price News. N.p., n.d. Web. 14 Feb. 2014.
<http://quotes.morningstar.com/stock/ko/s?t=ko>.
($ Millions) 2003-12 2004-12 2005-12 2006-12 2007-12 2008-12 2009-12 2010-12 2011-12 2012-12
Assets:
Current assets:
Cash:
Cash and cash equivalents 3,362 6,707 4,701 2,440 4,093 4,701 7,021 8,517 12,803 8,442
Short-term investments 120 61 66 150 215 278 2,192 2,820 1,232 8,109
Total cash 3,482 6,768 4,767 2,590 4,308 4,979 9,213 11,337 14,035 16,551
Receivables 2,091 2,171 2,281 2,587 3,317 3,090 3,758 4,430 4,920 4,759
Inventories 1,252 1,420 1,424 1,641 2,220 2,187 2,354 2,650 3,092 3,264
Prepaid expenses 1,571 1,735 1,778 1,623 2,260 1,920 2,226 3,162 3,450 2,781
Other current assets - - - - - - - - - 2,973
Total current assets 8,396 12,094 10,250 8,441 12,105 12,176 17,551 21,579 25,497 30,328
Non-current assets:
PPE
Gross PPE 9,622 10,149 10,139 11,911 14,444 14,400 16,467 21,706 23,151 23,486
Accumulated Depreciation (3,525) (4,058) (4,353) (5,008) (5,951) (6,074) (6,906) (6,979) (8,212) (9,010)
Net PPE 6,097 6,091 5,786 6,903 8,493 8,326 9,561 14,727 14,939 14,476
Equity and other investments - - - - - 5,779 6,755 7,585 8,374 10,448
Goodwill - - - 1,403 4,256 4,029 4,224 11,665 12,219 12,255
Intangible assets 3,989 3,836 3,821 3,732 7,963 8,476 8,604 15,244 15,450 15,082
Other long-term assets 8,860 9,306 9,570 9,484 10,452 1,733 1,976 2,121 3,495 3,585
Total non-current assets 18,946 19,233 19,177 21,522 31,164 28,343 31,120 51,342 54,477 55,846
Total assets 27,342 31,327 29,427 29,963 43,269 40,519 48,671 72,921 79,974 86,174
Liabilities and stockholders' equity
Liabilities:
Current liabilities:
Short-term debt 2,906 6,021 4,546 3,268 6,052 6,531 6,800 9,376 14,912 17,874
Accounts payable 4,058 4,283 4,493 929 1,380 1,370 1,410 1,887 2,172 1,969
Taxes payable - - - - - 252 264 273 362 471
Accrued liabilities 922 667 797 4,693 5,793 4,835 5,247 6,972 6,837 6,711
Other current liabilities 796
Total current liabilities: 7,886 10,971 9,836 8,890 13,225 12,988 13,721 18,508 24,283 27,821
Non-current liabilities:
Long-term debt 2,517 1,157 1,154 1,314 3,277 2,781 5,059 14,041 13,656 14,736
Deferred taxes liabilities 337 450 352 608 1,890 877 1,580 4,261 4,694 4,981
Minority interest - - - - - - 547 314 286 378
Other long-term liabilities 2,512 2,814 1,730 2,231 3,133 3,401 2,965 4,794 5,420 5,468
Total non-current liabilities 5,366 4,421 3,236 4,153 8,300 7,059 10,151 23,410 24,056 25,563
Total liabilities 13,252 15,392 13,072 13,043 21,525 20,047 23,872 41,918 48,339 53,384
Stockholders' equity
Common stock 874 875 877 878 880 880 880 880 880 1,760
Additional paid-in capital 4,395 4,928 5,492 5,983 7,378 7,966 8,537 10,057 11,212 11,379
Retained earnings 26,687 29,105 31,299 33,468 36,235 38,513 41,537 49,278 53,550 58,045
Treasury stock (15,871) (17,625) (19,644) (22,118) (23,375) (24,213) (25,398) (27,762) (31,304) (35,009)
Accumulated other comprehensive income (1,995) (1,348) (1,669) (1,291) 626 (2,674) (757) (1,450) (2,703) (3,385)
Total stockholders' equity 14,090 15,935 16,355 16,920 21,744 20,472 24,799 31,003 31,635 32,790
Total liabilities and equity 27,342 31,327 29,427 29,963 43,269 40,519 48,671 72,921 79,974 86,174
Exhibit 1: COCA-COLA CO (KO) Historical Balance Sheet
Growth Rate Y/Y 4% 5% 4% 20% 11% -3% 13% 33% 3%
Fiscal year ends in December ($Millions)
except per share data. 2003-12 2004-12 2005-12 2006-12 2007-12 2008-12 2009-12 2010-12 2011-12 2012-12
Revenue 21,044 21,962 23,104 24,088 28,857 31,944 30,990 35,119 46,542 48,017
Cost of revenue 7,762 7,638 8,195 8,164 10,406 11,374 11,088 12,693 18,216 19,053
Gross profit 13,282 14,324 14,909 15,924 18,451 20,570 19,902 22,426 28,326 28,964
Operating expenses:
SGA 8,061 8,626 8,824 9,616 11,199 11,774 11,358 13,158 17,440 17,738
Other - - - - - 350 313 819 732 447
Total operating expenses 8,061 8,626 8,824 9,616 11,199 12,124 11,671 13,977 18,172 18,185
Operating income 5,221 5,698 6,085 6,308 7,252 8,446 8,231 8,449 10,154 10,779
Interest Expense 178 196 240 220 456 438 355 733 417 397
Other income (expense) 452 720 845 490 1,077 (569) 1,070 6,527 1,702 1,427
Income before taxes 5,495 6,222 6,690 6,578 7,873 7,439 8,946 14,243 11,439 11,809
Provision for income taxes 1,148 1,375 1,818 1,498 1,892 1,632 2,040 2,384 2,805 2,723
Net income from continuing operations 4,347 4,847 4,872 5,080 5,981 5,807 6,906 11,859 8,634 9,086
Other - - - - - - (82) (50) (62) (67)
Net income 4,347 4,847 4,872 5,080 5,981 5,807 6,824 11,809 8,572 9,019
Net income available to common shareholders 4,347 4,847 4,872 5,080 5,981 5,807 6,824 11,809 8,572 9,019
Earnings per share ($)
Basic 0.89 1 1.02 1.08 1.3 1.26 1.48 2.56 1.88 2
Diluted 0.89 1 1.02 1.08 1.29 1.25 1.47 2.53 1.85 1.97
Weighted average shares outstanding:
Basic 4918 4852 4784 4696 4626 4630 4628 4616 4568 4504
Diluted 4924 4858 4786 4700 4662 4672 4658 4666 4646 4584
EBITDA 6523 7311 7862 7736 9492 9105 10537 16419 13810 14188
Book Value per Share ($)
Basic 2.86 3.28 3.42 3.60 4.70 4.42 5.36 6.72 6.93 7.28
Diluted 2.86 3.28 3.42 3.60 4.66 4.38 5.32 6.64 6.81 7.15
Exhibit 2: COCA-COLA CO (KO) Historical Income Statement
Fiscal year ends in December ($ Millions) 2011-06 2011-09 2011-12 2012-03 2012-06 2012-09 2012-12 2013-03 2013-06 2013-09
Revenue 12,737 12,248 11,040 11,137 13,085 12,340 11,455 11,035 12,749 12,030
Cost of revenue 4,989 4,875 4,403 4,348 5,224 4,853 4,628 4,324 4,989 4,793
Gross profit 7,748 7,373 6,637 6,789 7,861 7,487 6,827 6,711 7,760 7,237
Operating expenses:
SGA 4,422 4,527 4,411 3,014 4,497 4,630 4,430 2,989 3,089 3,132
Other 152 96 275 1,266 70 64 214 1,314 1,428 1,633
Total operating expenses 4,574 4,623 4,686 4,280 4,567 4,694 4,644 4,303 4,517 4,765
Operating income 3,174 2,750 1,951 2,509 3,294 2,793 2,183 2,408 3,243 2,472
Interest Expense 84 116 104 88 112 102 95 102 122 90
Other income (expense) 704 289 364 304 441 393 289 38 404 998
Income before taxes 3,794 2,923 2,211 2,725 3,623 3,084 2,377 2,344 3,525 3,380
Provision for income taxes 990 680 537 658 823 755 487 575 831 925
Net income from continuing operations 2,804 2,243 1,674 2,067 2,800 2,329 1,890 1,769 2,694 2,455
Other (7) (22) (20) (13) (12) (18) (24) (18) (18) (8)
Net income 2,797 2,221 1,654 2,054 2,788 2,311 1,866 1,751 2,676 2,447
Net income available to common shareholders 2,797 2,221 1,654 2,054 2,788 2,311 1,866 1,751 2,676 2,447
Earnings per share ($)
Basic 0.61 0.49 0.36 0.46 0.62 0.51 0.42 0.39 0.6 0.55
Diluted 0.6 0.48 0.36 0.45 0.61 0.5 0.41 0.39 0.59 0.54
Weighted average shares outstanding
Basic 4580 4572 4538 4526 4510 4502 4477 4455 4446 4426
Diluted 4660 4652 4610 4602 4592 4587 4557 4530 4527 4498
EBITDA 3174 2750 2846 3260 3294 2793 2985 2919 3243 2472
Exhibit 3: COCA-COLA CO (KO) Historical Quarterly Income Statement
($millions, except per share data) 2003-12 2004-12 2005-12 2006-12 2007-12 2008-12 2009-12 2010-12 2011-12 2012-12
Cash Flows From Operating Activities
Net income 4,347 4,847 4,872 5,080 5,981 5,807 6,906 11,859 8,634 9,086
Depreciation & amortization 850 893 932 938 1,163 1,228 1,236 1,443 1,954 1,982
Deferred income taxes (188) 162 (88) (35) 109 (360) 353 617 1,028 632
Stock based compensation - - - - - 266 241 380 354 259
Accounts receivable - - - - - 148 (404) (41) (562) (33)
Inventory 111 (57) (79) (150) (258) (165) (50) 182 (447) (286)
Prepaid expenses (276) (397) 244 (152) (244) 63 (332) (148) (350) (29)
Accrued liabilities - - - - - (121) 81 (266) (132) 770
Other working capital (3) (163) 265 (313) 508 (613) 141 643 (402) (1,502)
Other non-cash items 615 683 277 589 (109) 1,318 14 (5,137) (603) (234)
Net cash provided by operating activities 5,456 5,968 6,423 5,957 7,150 7,571 8,186 9,532 9,474 10,645
Cash Flows From Investing Activities:
Investments in PPE (812) (755) (899) (1,407) (1,648) (1,968) (1,993) (2,215) (2,920) (2,780)
PPE reductions 87 341 88 112 239 129 104 134 101 143
Acquisitions, net (359) (267) (637) (901) (5,653) (280) (60) (1,539) 562 2,189
Purchases of investments (177) (46) (53) (82) (99) (244) (2,200) (4,817) (5,821) (16,391)
Sales/Maturities of investments 147 161 33 640 448 - - 4,032 5,647 5,622
Other investing activities 178 63 (28) (62) (6) - - - (93) (187)
Net cash used for investing activities (936) (503) (1,496) (1,700) (6,719) (2,363) (4,149) (4,405) (2,524) (11,404)
Cash Flows From Financing Activities:
Debt issued - - - - - 4,337 14,689 15,251 27,495 42,791
Debt repayment - - - - - (4,308) (12,326) (13,403) (22,530) (38,573)
Common stock issued 98 193 230 148 1,619 586 662 1,666 1,569 1,489
Common stock repurchased (1,440) (1,739) (2,055) (2,416) (1,838) (1,079) (1,518) (2,961) (4,513) (4,559)
Dividend paid (2,166) (2,429) (2,678) (2,911) (3,149) (3,521) (3,800) (4,068) (4,300) (4,595)
Other financing activities (93) 1,714 (2,282) (1,404) 4,341 - - 50 45 100
Net cash provided by financing activities (3,601) (2,261) (6,785) (6,583) 973 (3,985) (2,293) (3,465) (2,234) (3,347)
Effect of exchange rate changes 183 141 (148) 65 249 (615) 576 (166) (430) (255)
Net change in cash 1,102 3,345 (2,006) (2,261) 1,653 608 2,320 1,496 4,286 (4,361)
Cash at beginning of period 2,260 3,362 6,707 4,701 2,440 4,093 4,701 7,021 8,517 12,803
Cash at end of period 3,362 6,707 4,701 2,440 4,093 4,701 7,021 8,517 12,803 8,442
Free Cash Flow
Operating cash flow 5,456 5,968 6,423 5,957 7,150 7,571 8,186 9,532 9,474 10,645
Capital expenditure (812) (755) (899) (1,407) (1,648) (1,968) (1,993) (2,215) (2,920) (2,780)
Free cash flow 4,644 5,213 5,524 4,550 5,502 5,603 6,193 7,317 6,554 7,865
Exhibit 4: COCA-COLA CO (KO) Historical Statement of Cash Flow
2003 2004 2005 2006 2007 2008 2009 2010 2011 2012 2013 2014 2015 2016 2017 2018 2019 2020 2021 2022
Revenue 100.0% 100.0% 100.0% 100.0% 100.0% 100.0% 100.0% 100.0% 100.0% 100.0% 100.0% 100.0% 100.0% 100.0% 100.0% 100.0% 100.0% 100.0% 100.0% 100.0%
COGS 36.9% 34.8% 35.5% 33.9% 36.1% 35.6% 35.8% 36.1% 39.1% 39.7% 40.0% 40.0% 40.0% 40.0% 40.0% 40.0% 40.0% 40.0% 40.0% 40.0%
Gross Profit 63.1% 65.2% 64.5% 66.1% 63.9% 64.4% 64.2% 63.9% 60.9% 60.3% 60.0% 60.0% 60.0% 60.0% 60.0% 60.0% 60.0% 60.0% 60.0% 60.0%
SGA 38.3% 39.3% 38.2% 39.9% 38.8% 36.9% 36.7% 37.5% 37.5% 36.9% 36.9% 36.8% 36.7% 36.6% 36.5% 36.5% 36.4% 36.4% 36.4% 36.3%
Other Operating Expenses 0.0% 0.0% 0.0% 0.0% 0.0% 1.1% 1.0% 2.3% 1.6% 0.9% 1.0% 1.0% 1.0% 1.0% 1.0% 1.0% 1.0% 1.0% 1.0% 1.0%
Operating Income 24.8% 25.9% 26.3% 26.2% 25.1% 26.4% 26.6% 24.1% 21.8% 22.4% 22.1% 22.2% 22.3% 22.4% 22.5% 22.5% 22.6% 22.6% 22.6% 22.7%
Interest Expense 0.8% 0.9% 1.0% 0.9% 1.6% 1.4% 1.1% 2.1% 0.9% 0.8% 1.0% 1.0% 1.0% 1.0% 1.0% 1.0% 1.0% 1.0% 1.0% 1.0%
Other Income Expense 2.1% 3.3% 3.7% 2.0% 3.7% -1.8% 3.5% 18.6% 3.7% 3.0% 3.1% 3.1% 3.1% 3.1% 3.1% 3.1% 3.1% 3.1% 3.1% 3.1%
Income pre-tax 26.1% 28.3% 29.0% 27.3% 27.3% 23.3% 28.9% 40.6% 24.6% 24.6% 18.0% 18.1% 18.2% 18.3% 18.4% 18.4% 18.4% 18.5% 18.5% 18.6%
Income Taxes 5.5% 6.3% 7.9% 6.2% 6.6% 5.1% 6.6% 6.8% 6.0% 5.7% 4.1% 4.1% 4.1% 4.1% 4.1% 4.2% 4.2% 4.2% 4.2% 4.2%
Income from con. Operations 20.7% 22.1% 21.1% 21.1% 20.7% 18.2% 22.3% 33.8% 18.6% 18.9% 13.9% 14.0% 14.1% 14.2% 14.2% 14.2% 14.3% 14.3% 14.3% 14.4%
Other 0.0% 0.0% 0.0% 0.0% 0.0% 0.0% -0.3% -0.1% -0.1% -0.1% -0.1% -0.1% -0.1% -0.1% -0.1% -0.1% -0.1% -0.1% -0.1% -0.1%
Net Income 20.7% 22.1% 21.1% 21.1% 20.7% 18.2% 22.0% 33.6% 18.4% 18.8% 13.8% 13.9% 14.0% 14.1% 14.1% 14.1% 14.2% 14.2% 14.2% 14.3%
Dividends Payout -10% -11% -12% -12% -11% -11% -12% -12% -9% -10% 11.0% 11.0% 11.0% 11.0% 11.0% 11.0% 11.0% 11.0% 11.0% 11.0%
Exhibit 5: Common Size Income Statement
Exhibit 6A: Ratios
Activity Rates 2003 2004 2005 2006 2007 2008 2009 2010 2011 2012 2013 2014 2015 2016 2017 2018 2019 2020 2021 2022
Sales per Day 58 60 63 66 79 88 85 96 128 132 145 159 173 186 196 206 216 227 238 250
COGS per Day 21 21 22 22 29 31 30 35 50 52 58 64 69 74 78 82 86 91 95 100
SGA per Day 22 24 24 26 31 32 31 36 48 49 53 58 64 68 71 75 79 83 87 91
Activity Ratios 2003 2004 2005 2006 2007 2008 2009 2010 2011 2012 2013 2014 2015 2016 2017 2018 2019 2020 2021 2022
Days of Cash (Cash/SPD) 58 111 74 37 52 54 83 89 100 64 72.22956 72.22956 72.22956 72.22956 72.22956 72.22956 72.22956 72.22956 72.22956 72.22956
Short Term Invest. (% of Sales) 0.6% 0.3% 0.3% 0.6% 0.7% 0.9% 7.1% 8.0% 2.6% 16.9% 8.7% 8.7% 8.7% 8.7% 8.7% 8.7% 8.7% 8.7% 8.7% 8.7%
Days of Receivables (AR/SPD) 36 36 36 39 42 35 44 46 39 36 39 39 39 39 39 39 39 39 39 39
Days of Inventory (IN/DCPD) 59 68 63 73 78 70 77 76 62 63 69 69 69 69 69 69 69 69 69 69
Prepaid Expenses (% of Sales) 7% 8% 8% 7% 8% 6% 7% 9% 7% 6% 7% 7% 7% 7% 7% 7% 7% 7% 7% 7%
Other CA (% of Sales) 0.0% 0.0% 0.0% 0.0% 0.0% 0.0% 0.0% 0.0% 0.0% 6.2% 6% 6% 6% 6% 6% 6% 6% 6% 6% 6%
Gross PPETurns/Year (Sales/PPE) 2.2 2.2 2.3 2.0 2.0 2.2 1.9 1.6 2.0 2.0 2 2 2 2 2 2 2 2 2 2
Deprecation (% of Sales) -17% -18% -19% -21% -21% -19% -22% -20% -18% -19% -19% -19% -19% -19% -19% -19% -19% -19% -19% -19%
Equity and other In. (% of Sales) 0% 0% 0% 0% 0% 18% 22% 22% 18% 22% 22% 22% 22% 22% 22% 22% 22% 22% 22% 22%
Goodwill (% of Sales) 0% 0% 0% 6% 15% 13% 14% 33% 26% 26% 26% 26% 26% 26% 26% 26% 26% 26% 26% 26%
Intangible Assets (% of Sales) 19% 17% 17% 15% 28% 27% 28% 43% 33% 31% 30% 30% 30% 30% 30% 30% 30% 30% 30% 30%
Other LTAssets (% of Sales) 42% 42% 41% 39% 36% 5% 6% 6% 8% 7% 7% 7% 7% 7% 7% 7% 7% 7% 7% 7%
Total Assets Turnover (Sales/TA) 0.77 0.70 0.79 0.80 0.67 0.79 0.64 0.48 0.58 0.56 0.53 0.53 0.54 0.54 0.54 0.53 0.53 0.53 0.52 0.52
Short Term Debt (% of Sales) 14% 27% 20% 14% 21% 20% 22% 27% 32% 37% 42% 42% 42% 42% 42% 42% 42% 42% 42% 42%
Days of AP (AP/DCPD) 191 205 200 42 48 44 46 54 44 38 34 34 34 34 34 34 34 34 34 34
Taxes Payable (% of Sales) 0% 0% 0% 0% 0% 1% 1% 1% 1% 1% 1% 1% 1% 1% 1% 1% 1% 1% 1% 1%
Accrued Liab. (% of Sales) 4% 3% 3% 19% 20% 15% 17% 20% 15% 14% 17% 17% 17% 17% 17% 17% 17% 17% 17% 17%
Other CL(% of Sales) 0% 0% 0% 0% 0% 0% 0% 0% 0% 2% 2% 2% 2% 2% 2% 2% 2% 2% 2% 2%
LTD/TA 9% 4% 4% 4% 8% 7% 10% 19% 17% 17% 17% 17% 17% 17% 17% 17% 17% 17% 17% 17%
Deferred Tax Liab (% of Sales) 2% 2% 2% 3% 7% 3% 5% 12% 10% 10% 10% 10% 10% 10% 10% 10% 10% 10% 10% 10%
Minority Interest (% of sales) 0% 0% 0% 0% 0% 0% 2% 1% 1% 1% 1% 1% 1% 1% 1% 1% 1% 1% 1% 1%
Other Long term Liab (% of Sales) 12% 13% 7% 9% 11% 11% 10% 14% 12% 11% 11% 11% 11% 11% 11% 11% 11% 11% 11% 11%
Addition In Capital (% of Sales) 21% 22% 24% 25% 26% 25% 28% 29% 24% 24% 25% 25% 25% 25% 25% 25% 25% 25% 25% 25%
Acc. income( % of sales) -9% -6% -7% -5% 2% -8% -2% -4% -6% -7% -5% -5% -5% -5% -5% -5% -5% -5% -5% -5%
Total Equity Turnover (Sales/TE) 1.5 1.4 1.4 1.4 1.3 1.6 1.2 1.1 1.5 1.5 1.4 1.5 1.5 1.5 1.5 1.5 1.5 1.4 1.4 1.4
Exhibit 6B: Ratios
Liquidity 2003 2004 2005 2006 2007 2008 2009 2010 2011 2012 2013 2014 2015 2016 2017 2018 2019 2020 2021 2022
CurrentRatio (CA/CL) 1.06 1.10 1.04 0.95 0.92 0.94 1.28 1.17 1.05 1.09 1.12 1.09 1.07 1.07 1.08 1.10 1.11 1.13 1.15 1.16
Quick Ratio ((CA-Inv)/CL) 0.91 0.97 0.90 0.76 0.75 0.77 1.11 1.02 0.92 0.97 1.00 0.98 0.96 0.96 0.97 0.98 1.00 1.02 1.03 1.05
Cash Ratio (Total Cash/CL) 0.44 0.62 0.48 0.29 0.33 0.38 0.67 0.61 0.58 0.59 0.64 0.61 0.59 0.59 0.60 0.62 0.63 0.65 0.66 0.68
Leverage
Funded Debt/Equity (LTD/TE) 0.18 0.07 0.07 0.08 0.15 0.14 0.20 0.45 0.43 0.45 0.47 0.47 0.48 0.48 0.47 0.47 0.47 0.46 0.46 0.46
Total DebtRatio (TD/TA) 48% 49% 44% 44% 50% 49% 49% 57% 60% 62% 63% 64% 64% 64% 64% 64% 64% 63% 63% 63%
Profitability
ROIC (EBIT*(1-Tavg)/TIC) 24% 26% 27% 27% 22% 28% 21% 15% 17% 18% 17% 17% 18% 18% 18% 17% 17% 17% 17% 17%
ROA (NI/TA) 16% 15% 17% 17% 14% 14% 14% 16% 11% 10% 7% 7% 8% 8% 8% 8% 8% 7% 7% 7%
ROE(NI/CE) 31% 30% 30% 30% 28% 28% 28% 38% 27% 28% 20% 21% 21% 21% 21% 21% 21% 20% 20% 20%
Gross ProfitMargin (GP/Revenue) 63% 65% 65% 66% 64% 64% 64% 64% 61% 60% 60% 60% 60% 60% 60% 60% 60% 60% 60% 60%
OP Margin (OP/Revenue) 25% 26% 26% 26% 25% 26% 27% 24% 22% 22% 22% 22% 22% 22% 22% 23% 23% 23% 23% 23%
NetProfitMargin (NI/Revenue) 21% 22% 21% 21% 21% 18% 22% 34% 18% 19% 14% 14% 14% 14% 14% 14% 14% 14% 14% 14%
InvestmentValuationRatios
Price to EarningRatio 43.42 38.64 37.88 35.78 29.72 30.67 26.11 15.09 20.55 19.32 23.81 21.53 19.64 18.27 17.27 16.39 15.57 14.79 14.06 13.36
P/S perShare Ratio(Basic) 9.03 8.54 8.00 7.53 6.19 5.60 5.77 5.08 3.79 3.62 3.29 3.00 2.75 2.57 2.44 2.32 2.21 2.10 2.00 1.91
P/S perShare Ratio (Diluted) 9.04 8.55 8.00 7.54 6.24 5.65 5.81 5.13 3.86 3.69 3.35 3.05 2.80 2.62 2.48 2.36 2.25 2.14 2.04 1.94
P/Eto growth ratio ((P/E)/(g*100) 8.86 7.29 8.40 1.50 2.87 (8.74) 1.13 0.63 6.10 2.38 2.19 2.17 2.60 3.14 3.22 3.10 2.96 2.81 2.67
Price/Book Value Ratio (Basic) 13.49 11.77 11.30 10.72 8.22 8.74 7.21 5.75 5.58 5.31 4.77 4.44 4.14 3.87 3.63 3.41 3.21 3.02 2.84 2.67
Price/Book Value Ratio (Diluted) 13.50 11.78 11.31 10.73 8.28 8.82 7.26 5.82 5.67 5.40 4.86 4.52 4.21 3.93 3.69 3.47 3.27 3.07 2.89 2.72
mu 5 gs 10% gs = expected sales growth rate
lam 10 gp 5% gp= perpetual growth rate
1 2 3 4 5 6 7 8 9 10 t
Exhibit 7 99% 96% 80% 40% 10% 2% 0% 0% 0% 0% yt
Pro Forma Income Statement ($ Millions) 10% 10% 9% 7% 6% 5% 5% 5% 5% 5% gt
2013 2014 2015 2016 2017 2018 2019 2020 2021 2022
Revenue 52,821 58,020 63,267 67,712 71,439 75,076 78,841 82,785 86,925 91,271
Cost of revenue 21,128 23,208 25,307 27,085 28,576 30,030 31,536 33,114 34,770 36,508 40% % of Sales
Gross profit 31,693 34,812 37,960 40,627 42,863 45,045 47,305 49,671 52,155 54,763
Operating expenses:
SGA 19,477 21,325 23,190 24,770 26,095 27,388 28,727 30,129 31,600 33,145 Trend
Other 528 580 633 677 714 751 788 828 869 913 1% % of Sales
Total operating expenses 20,005 21,905 23,823 25,448 26,810 28,139 29,515 30,956 32,469 34,058
Operating income 11,687 12,907 14,137 15,180 16,054 16,907 17,790 18,715 19,685 20,705
Interest Expense 528 580 633 677 714 751 788 828 869 913 1% % of Sales
Other income (expense) 1,646 1,808 1,972 2,110 2,226 2,340 2,457 2,580 2,709 2,844 3% % of Sales
Income before taxes 9,513 10,518 11,533 12,392 13,113 13,816 14,544 15,307 16,107 16,948
Provision for income taxes 2,150 2,377 2,607 2,801 2,964 3,123 3,287 3,460 3,641 3,831 23% Avg. Tax
Net income from continuing operations 7,363 8,141 8,926 9,591 10,149 10,693 11,257 11,847 12,467 13,117
Other (53) (58) (63) (68) (71) (75) (79) (83) (87) (91) -0.1% % of Sales
Net income 7,310 8,083 8,863 9,524 10,078 10,618 11,178 11,764 12,380 13,026
Dividends Paid 5,810 6,382 6,959 7,448 7,858 8,258 8,673 9,106 9,562 10,040 11% % of Sales
Weighted average shares outstanding:
Basic 4,504 4,504 4,504 4,504 4,504 4,504 4,504 4,504 4,504 4,504 No Change
Diluted 4,584 4,584 4,584 4,584 4,584 4,584 4,584 4,584 4,584 4,584 No Change
Earnings per share ($)
Basic 1.62 1.79 1.97 2.11 2.24 2.36 2.48 2.61 2.75 2.89
Diluted 1.59 1.76 1.93 2.08 2.20 2.32 2.44 2.57 2.70 2.84
Dividend Per Share ($)
Basic 1.29 1.42 1.55 1.65 1.74 1.83 1.93 2.02 2.12 2.23
Diluted 1.27 1.39 1.52 1.62 1.71 1.80 1.89 1.99 2.09 2.19
Book Value per Share ($)
Basic 8.10 8.70 9.34 9.99 10.65 11.33 12.04 12.80 13.60 14.45
Diluted 7.96 8.54 9.18 9.82 10.46 11.13 11.83 12.58 13.37 14.20
Assumptions
($ Millions) 2013 2014 2015 2016 2017 2018 2019 2020 2021 2022
Beginning Balance 58,045 59,545 61,245 63,149 65,224 67,443 69,803 72,309 74,967 77,784
Plus: Net Income 7,310 8,083 8,863 9,524 10,078 10,618 11,178 11,764 12,380 13,026
Less: Dividends 5,810 6,382 6,959 7,448 7,858 8,258 8,673 9,106 9,562 10,040
Ending Balance 59,545 61,245 63,149 65,224 67,443 69,803 72,309 74,967 77,784 80,770
Exhibit 9: Schedule of Retained Earnings
($Million) 2013 2014 2015 2016 2017 2018 2019 2020 2021 2022
EBIT*(1-Tavg) 9,046 9,989 10,942 11,749 12,425 13,085 13,769 14,485 15,236 16,025
Share-based comp. expense - - - - - - - - - -
Less (increases) in:
Account's Receivable (884) (555) (561) (475) (398) (389) (402) (421) (442) (464)
Inventory (729) (4,386) (4,782) (5,118) (5,400) (5,675) (5,960) (6,258) (6,571) (6,899)
Current Tax Assets - - - - - - - - - -
Prepayments (ST) 1,077 380 383 325 272 266 275 288 302 317
Other CA (302) (322) (325) (276) (231) (225) (233) (245) (257) (269)
Net PPE (1,737) (1,596) (1,611) (1,364) (1,144) (1,116) (1,156) (1,211) (1,271) (1,334)
Plus increases in:
Accounts Payable (1) 194 196 166 139 136 140 147 154 162
Taxes Payable 57 52 52 44 37 36 38 39 41 43
Accrued Expenses 2,355 892 901 763 640 624 646 677 710 746
Other CL 260 104 105 89 75 73 75 79 83 87
Deferred Tax 301 520 525 444 373 364 377 394 414 435
Other Liabilities 303 568 573 486 407 397 411 431 452 475
FCF 9,747 5,840 6,398 6,832 7,194 7,575 7,980 8,406 8,853 9,323
Years to FCF - 1 2 3 4 5 6 7 8 9
PV(FCF) 9,747 5,438 5,548 5,518 5,411 5,306 5,205 5,106 5,008 4,911
Valuation
PV(FCF(2013-2022)) 57,198 Tmrg 23%
PV(CFCF)** 216,492 Net Debt (26,999)
Plus excess assets: MktCap 174,035
Cash & Equiv. 8,442 Rd 6.1%
ST Investments 8,109 mBeta 0.19
LT Investments 10,448 BBeta 0.46
Enterprise Value 300,690 Rf 3.6%
Less liabilities: MRP 6.2%
LTD 2012 (14,736) Re 6.5%
Employee Stk Option Liab. - Wd (0.18)
Other LT Liab. (5,468) We 1.18
Preferred stock - WACC 7.4%
Common Equity Value 280,486
Shares Outstanding (mill)1
4,504.00
Fair value per share 62.27
Last Trade 2
38.64
1
Shares outstanding amount is the weighted average basic shares outstanding for 2012
2
Last trade price of shares was obtained from Morningstar.com on 2/11/2014. The last trade price was the KO stock close price on 2/11/14
Exhibit 11: Coca-Cola Free Cash Flows
WACC Calculation
Exhibit 12: Market Prices For S&P 500 and Coca-Cola (KO)
Date S&P500 KO
1/4/2010 1073.87 54.25 LN(It/It-1) LN(Pt/Pt-1)
2/1/2010 1104.49 52.72 2.81% -2.86%
3/1/2010 1169.43 55 5.71% 4.23%
4/1/2010 1186.69 53.45 1.47% -2.86%
5/3/2010 1089.41 51.4 -8.55% -3.91%
6/1/2010 1030.71 50.12 -5.54% -2.52%
7/1/2010 1101.6 55.11 6.65% 9.49%
8/2/2010 1049.33 55.88 -4.86% 1.39%
9/1/2010 1141.2 58.52 8.39% 4.62%
10/1/2010 1183.26 61.32 3.62% 4.67%
11/1/2010 1180.55 63.17 -0.23% 2.97%
12/1/2010 1257.64 65.77 6.33% 4.03%
1/3/2011 1286.12 62.85 2.24% -4.54%
2/1/2011 1327.22 63.92 3.15% 1.69%
3/1/2011 1325.83 66.34 -0.10% 3.72%
4/1/2011 1363.61 67.46 2.81% 1.67%
5/2/2011 1345.2 66.81 -1.36% -0.97%
6/1/2011 1320.64 67.29 -1.84% 0.72%
7/1/2011 1292.28 68.01 -2.17% 1.06%
8/1/2011 1218.89 70.45 -5.85% 3.52%
9/1/2011 1131.42 67.56 -7.45% -4.19%
10/3/2011 1253.3 68.32 10.23% 1.12%
11/1/2011 1246.96 67.23 -0.51% -1.61%
12/1/2011 1257.6 69.97 0.85% 3.99%
1/3/2012 1312.41 67.53 4.27% -3.55%
2/1/2012 1365.68 69.86 3.98% 3.39%
3/1/2012 1408.47 74.01 3.09% 5.77%
4/2/2012 1397.91 76.32 -0.75% 3.07%
5/1/2012 1310.33 74.73 -6.47% -2.11%
6/1/2012 1362.16 78.19 3.88% 4.53%
7/2/2012 1379.32 80.8 1.25% 3.28%
8/1/2012 1406.58 37.4 1.96% -77.03%
9/4/2012 1440.67 37.93 2.39% 1.41%
10/1/2012 1412.16 37.18 -2.00% -2.00% Slope
11/1/2012 1416.18 37.92 0.28% 1.97% 0.235049
12/3/2012 1426.19 36.25 0.70% -4.50% 0.235601
1/2/2013 1498.11 37.24 4.92% 2.69% 0.259219
2/1/2013 1514.68 38.72 1.10% 3.90% 0.231445
3/1/2013 1569.19 40.44 3.54% 4.35% 0.253131
4/1/2013 1597.57 42.33 1.79% 4.57% 0.246716
5/1/2013 1630.74 39.99 2.06% -5.69% 0.23471
6/3/2013 1606.28 40.11 -1.51% 0.30% 0.127151
7/1/2013 1685.73 40.08 4.83% -0.07% 0.16966
8/1/2013 1632.97 38.18 -3.18% -4.86% 0.126648
9/3/2013 1681.55 37.88 2.93% -0.79% 0.094344
10/1/2013 1756.54 39.57 4.36% 4.36% 0.14698
11/1/2013 1805.81 40.19 2.77% 1.55% 0.100284
12/2/2013 1848.36 41.31 2.33% 2.75% 0.121798
1/2/2014 1782.59 37.82 -3.62% -8.83% 0.179705
Franklin_CocaColaOrginal2

More Related Content

What's hot

Introduction to business finance
Introduction to business financeIntroduction to business finance
Introduction to business finance
Slide Hub
 
Senior Project Analyst Report
Senior Project Analyst ReportSenior Project Analyst Report
Senior Project Analyst Report
Hubert Lo
 
I Bytes Automotive industry
I Bytes Automotive industryI Bytes Automotive industry
I Bytes Automotive industry
EGBG Services
 
anheuser-busch2005AR_MgmntDiscuss
anheuser-busch2005AR_MgmntDiscussanheuser-busch2005AR_MgmntDiscuss
anheuser-busch2005AR_MgmntDiscuss
finance15
 
anheuser-busch 2004AR_MgmntDiscuss
anheuser-busch 2004AR_MgmntDiscussanheuser-busch 2004AR_MgmntDiscuss
anheuser-busch 2004AR_MgmntDiscuss
finance15
 
Tim Hortons 2012 Q2 Presentation
Tim Hortons 2012 Q2 PresentationTim Hortons 2012 Q2 Presentation
Tim Hortons 2012 Q2 Presentation
Company Spotlight
 
anheuser-busch 2004AR_FinancialOverview
anheuser-busch 2004AR_FinancialOverviewanheuser-busch 2004AR_FinancialOverview
anheuser-busch 2004AR_FinancialOverview
finance15
 
2012 aug-usl
2012 aug-usl2012 aug-usl
2012 aug-usl
Manoj Pk
 
Vp of business dev press release
Vp of business dev press releaseVp of business dev press release
Vp of business dev press release
Boreal Water Collection Inc
 
Coca cola
Coca colaCoca cola
Coca cola
Abhishek Singh
 
molson coors brewing 2005_AR_ENG
molson coors brewing  2005_AR_ENGmolson coors brewing  2005_AR_ENG
molson coors brewing 2005_AR_ENG
finance46
 
Business Outlook coca cola enterprises
Business Outlook coca cola enterprises Business Outlook coca cola enterprises
Business Outlook coca cola enterprises
finance12
 

What's hot (12)

Introduction to business finance
Introduction to business financeIntroduction to business finance
Introduction to business finance
 
Senior Project Analyst Report
Senior Project Analyst ReportSenior Project Analyst Report
Senior Project Analyst Report
 
I Bytes Automotive industry
I Bytes Automotive industryI Bytes Automotive industry
I Bytes Automotive industry
 
anheuser-busch2005AR_MgmntDiscuss
anheuser-busch2005AR_MgmntDiscussanheuser-busch2005AR_MgmntDiscuss
anheuser-busch2005AR_MgmntDiscuss
 
anheuser-busch 2004AR_MgmntDiscuss
anheuser-busch 2004AR_MgmntDiscussanheuser-busch 2004AR_MgmntDiscuss
anheuser-busch 2004AR_MgmntDiscuss
 
Tim Hortons 2012 Q2 Presentation
Tim Hortons 2012 Q2 PresentationTim Hortons 2012 Q2 Presentation
Tim Hortons 2012 Q2 Presentation
 
anheuser-busch 2004AR_FinancialOverview
anheuser-busch 2004AR_FinancialOverviewanheuser-busch 2004AR_FinancialOverview
anheuser-busch 2004AR_FinancialOverview
 
2012 aug-usl
2012 aug-usl2012 aug-usl
2012 aug-usl
 
Vp of business dev press release
Vp of business dev press releaseVp of business dev press release
Vp of business dev press release
 
Coca cola
Coca colaCoca cola
Coca cola
 
molson coors brewing 2005_AR_ENG
molson coors brewing  2005_AR_ENGmolson coors brewing  2005_AR_ENG
molson coors brewing 2005_AR_ENG
 
Business Outlook coca cola enterprises
Business Outlook coca cola enterprises Business Outlook coca cola enterprises
Business Outlook coca cola enterprises
 

Viewers also liked

Bombeo mecánico
Bombeo mecánicoBombeo mecánico
Bombeo mecánico
Emiliano González
 
Raimundo calzada
Raimundo calzadaRaimundo calzada
Raimundo calzada
RaimundoCalsada
 
Risk Sensitive VDP Report Kallanchiya - Final Draft
Risk Sensitive VDP Report Kallanchiya - Final DraftRisk Sensitive VDP Report Kallanchiya - Final Draft
Risk Sensitive VDP Report Kallanchiya - Final Draft
Indu Abeyratne
 
Aggrigatemortor 170209141826
Aggrigatemortor 170209141826Aggrigatemortor 170209141826
Aggrigatemortor 170209141826
ram saran
 
Palabras agudas
Palabras agudasPalabras agudas
Report on wood and timber
Report on wood and timberReport on wood and timber
Report on wood and timber
Manisha Agarwal
 
Bootstrap tutorial
Bootstrap tutorialBootstrap tutorial
Bootstrap tutorial
Fajar Baskoro
 
Procesamiento de eventos complejos aplicado al ámbito de las smart cities
Procesamiento de eventos complejos aplicado al ámbito de las smart citiesProcesamiento de eventos complejos aplicado al ámbito de las smart cities
Procesamiento de eventos complejos aplicado al ámbito de las smart cities
Facultad de Informática UCM
 
Practica 5
Practica 5Practica 5
Practica 5
Aileen Hernandez
 
Thomas Hobbes
Thomas HobbesThomas Hobbes
Thomas Hobbes
obemrosalia
 
Film plan
Film plan Film plan
Film plan
benchaisty
 

Viewers also liked (11)

Bombeo mecánico
Bombeo mecánicoBombeo mecánico
Bombeo mecánico
 
Raimundo calzada
Raimundo calzadaRaimundo calzada
Raimundo calzada
 
Risk Sensitive VDP Report Kallanchiya - Final Draft
Risk Sensitive VDP Report Kallanchiya - Final DraftRisk Sensitive VDP Report Kallanchiya - Final Draft
Risk Sensitive VDP Report Kallanchiya - Final Draft
 
Aggrigatemortor 170209141826
Aggrigatemortor 170209141826Aggrigatemortor 170209141826
Aggrigatemortor 170209141826
 
Palabras agudas
Palabras agudasPalabras agudas
Palabras agudas
 
Report on wood and timber
Report on wood and timberReport on wood and timber
Report on wood and timber
 
Bootstrap tutorial
Bootstrap tutorialBootstrap tutorial
Bootstrap tutorial
 
Procesamiento de eventos complejos aplicado al ámbito de las smart cities
Procesamiento de eventos complejos aplicado al ámbito de las smart citiesProcesamiento de eventos complejos aplicado al ámbito de las smart cities
Procesamiento de eventos complejos aplicado al ámbito de las smart cities
 
Practica 5
Practica 5Practica 5
Practica 5
 
Thomas Hobbes
Thomas HobbesThomas Hobbes
Thomas Hobbes
 
Film plan
Film plan Film plan
Film plan
 

Similar to Franklin_CocaColaOrginal2

COKE
COKECOKE
a-ppt-on-coca-cola
a-ppt-on-coca-colaa-ppt-on-coca-cola
a-ppt-on-coca-cola
Mohammad Shoaib
 
review Coca cola company
 review Coca cola company review Coca cola company
review Coca cola company
Mahmudur Rahman
 
Ppt on coca cola
Ppt on coca colaPpt on coca cola
Ppt on coca cola
Naveen Ganesh
 
Marketing plan
Marketing planMarketing plan
Marketing plan
pankajx2x9
 
Cola Wars
Cola WarsCola Wars
Cola Wars
Amy Alexander
 
coka cola SLIDESHARE.pptx
coka cola SLIDESHARE.pptxcoka cola SLIDESHARE.pptx
coka cola SLIDESHARE.pptx
ChetanKumar137305
 
Account report
Account reportAccount report
Account report
wailoon323
 
Acc
Acc Acc
Acc
AccAcc
Acc
jygwen
 
Project on marketing strategies of coca cola
Project on marketing strategies of coca colaProject on marketing strategies of coca cola
Project on marketing strategies of coca cola
Projects Kart
 
Fils-Aime 13Valdirene Fils-AimeMichael Matvichuk C.docx
       Fils-Aime 13Valdirene Fils-AimeMichael Matvichuk C.docx       Fils-Aime 13Valdirene Fils-AimeMichael Matvichuk C.docx
Fils-Aime 13Valdirene Fils-AimeMichael Matvichuk C.docx
hallettfaustina
 
Presentation managment of coca cola
Presentation managment of coca colaPresentation managment of coca cola
Presentation managment of coca cola
Vaxo Mdivani
 
Coca Cola Vs. Pepsico
Coca Cola Vs. PepsicoCoca Cola Vs. Pepsico
again
againagain
again
gbk1992
 
Business proposal
Business proposalBusiness proposal
Business proposal
Rajesh Patel
 
Group
GroupGroup
Coco proj
Coco projCoco proj
Coco proj
Vinay S S
 
49045118 project-of-coca-cola-110406035123-phpapp01(4)
49045118 project-of-coca-cola-110406035123-phpapp01(4)49045118 project-of-coca-cola-110406035123-phpapp01(4)
49045118 project-of-coca-cola-110406035123-phpapp01(4)
ankitamamta
 
project-of-coca-cola
project-of-coca-colaproject-of-coca-cola
project-of-coca-cola
ReZo Begalashvili
 

Similar to Franklin_CocaColaOrginal2 (20)

COKE
COKECOKE
COKE
 
a-ppt-on-coca-cola
a-ppt-on-coca-colaa-ppt-on-coca-cola
a-ppt-on-coca-cola
 
review Coca cola company
 review Coca cola company review Coca cola company
review Coca cola company
 
Ppt on coca cola
Ppt on coca colaPpt on coca cola
Ppt on coca cola
 
Marketing plan
Marketing planMarketing plan
Marketing plan
 
Cola Wars
Cola WarsCola Wars
Cola Wars
 
coka cola SLIDESHARE.pptx
coka cola SLIDESHARE.pptxcoka cola SLIDESHARE.pptx
coka cola SLIDESHARE.pptx
 
Account report
Account reportAccount report
Account report
 
Acc
Acc Acc
Acc
 
Acc
AccAcc
Acc
 
Project on marketing strategies of coca cola
Project on marketing strategies of coca colaProject on marketing strategies of coca cola
Project on marketing strategies of coca cola
 
Fils-Aime 13Valdirene Fils-AimeMichael Matvichuk C.docx
       Fils-Aime 13Valdirene Fils-AimeMichael Matvichuk C.docx       Fils-Aime 13Valdirene Fils-AimeMichael Matvichuk C.docx
Fils-Aime 13Valdirene Fils-AimeMichael Matvichuk C.docx
 
Presentation managment of coca cola
Presentation managment of coca colaPresentation managment of coca cola
Presentation managment of coca cola
 
Coca Cola Vs. Pepsico
Coca Cola Vs. PepsicoCoca Cola Vs. Pepsico
Coca Cola Vs. Pepsico
 
again
againagain
again
 
Business proposal
Business proposalBusiness proposal
Business proposal
 
Group
GroupGroup
Group
 
Coco proj
Coco projCoco proj
Coco proj
 
49045118 project-of-coca-cola-110406035123-phpapp01(4)
49045118 project-of-coca-cola-110406035123-phpapp01(4)49045118 project-of-coca-cola-110406035123-phpapp01(4)
49045118 project-of-coca-cola-110406035123-phpapp01(4)
 
project-of-coca-cola
project-of-coca-colaproject-of-coca-cola
project-of-coca-cola
 

Franklin_CocaColaOrginal2

  • 2. Executive Summary Coca Cola was founded in 1886 in Atlanta, Georgia, and has become a leading soft drink producer worldwide. Besides manufacturing the Coca Cola drink, the company is responsible for introducing a variety of different products to the global market such as Fanta, Sprite, PowerAde, Dasani and Nestea. Coca-Cola experienced steady growth in sales revenues over the last ten years. Coca-Cola was able to increase its liquidity and its efficiency over the same time period. Coca-Cola managed to keep its COGS percentage of sales lower than its main rival, PepsiCo. Coca-Cola over the last ten years was able to keep its gross profit margin above 60% while rivals in the industry where unable to do the same. Based on the historical balance sheet and income statement, a series of ratios were calculated to produce pro formas. The pro forma balance sheet and income sheet display that Coca-Cola is able to continue keeping cost of goods sold at similar levels. The pro forma calculations illustrate the company continuing its 2012’s long term debt levels, while still producing positive cash flows in the future. A free cash flow statement was created in order to obtain a fair value of Coca-Cola per share. An in-depth examination of possible explanations for the difference between the fair value price of $62.27 and the market value price of $38.46 is analyzed at the end of this paper.
  • 3. History of Coca-Cola Coca-Cola was created in 1886 by an Atlanta pharmacist, Dr. John S. Pemberton. Dr. John S. Pemberton created a flavored syrup mixed with carbonated water and sold it in the pharmacy’s soda fountain. Frank M. Robinson, who was Dr. Pemberton’s bookkeeper was the one who thought up the name “Coca-Cola” for the beverage. In 1888, Dr. Pemberton sold portions of Coca-Cola to various parties. The largest portion was sold to Asa G. Candler. Candler sold Coca-Cola’s first bottling franchise in 1899. A challenge that overwhelmed early bottlers was imitations and counterfeits versions of the beverage by competitors. In 1916, the bottlers approved the unique bottle shape. The 6.5 ounce bottle had a unique skirt design that has become a renowned bottle shape. The remarkable Coca‑Cola bottle was trademarked in 1977. Today Coca-Cola has over 3,500 products available in over 200 countries. Coca-Cola is more than just a soda company, it sells a variety of different types of beverages. The beverages offered by Coca-Cola include enhanced waters, noncarbonated energy drinks, juices, ready-to- drink teas, coffees, and sport drinks. The company also provides flavoring ingredients, sweeteners, powders for purified water products, and fountain syrups. Brands that are a part of the Coca-Cola Company include DASANI, Fanta, Minute Maid, Odwalla, Sprite, and glacéau vitaminwater. Analysis of Coca-Cola Historical Data Coca-Cola over the last 10 years has experienced positive revenue growth rates except in 2009. In 2009, the company suffered a negative revenue growth rate. The year’s negative revenue growth could have been due to the volatile economic environment. The decrease in consumer spending in United States and across the world may have affected Coca-Cola sales for 2009. While 2009 sales growth was not impressive, Coca-Cola had large growth rates of 20% in
  • 4. 2007 and 33% in 2011. The company’s double digit revenue growth rate in 2007 was provided by the company’s strong sales overseas during that period. The company over the last 10 years has shown an increase in its long term debt to total assets. In 2012 Coca-Cola had a long-term debt ratio of 17% which was more than double the rate of 4% in 2006. It appears that Coca-Cola is becoming more reliant on debt in order to grow the company. The dependence on debt could be from the company’s expansion into new markets. Coca-Cola over a period from 2003 to 2012 acquired multiple companies. Some of the newly acquired companies likely needed substantial capital during their purchase. Long term debt was possibly used to finance these acquisitions. Coca-Cola’s other liabilities from 2003 to 2012 either stayed the same or experienced a decrease. The company’s accounts payable declined over a 10 year time period of 191 days outstanding in 2003 to 38 days outstanding in 2012. The past acquisitions could explain Coca-Cola’s motives for decreasing its accounts payable while increasing the cash they have on hand. Coca-Cola’s historical balance sheet displays that the company prefers to keep large amounts of cash on hand. One of the motives behind Coca-Cola possessing large amounts of cash could be a precautionary measure. Coca- Cola might prefer to have large amounts of cash on hand in case of another financial crisis like in 2009. Another possible reason could be that they expect a large expense associated with a new partnership such as Green Mountain that was announcement a few weeks ago. Coca-Cola could have been anticipating a large amount of cash needed for the new partnership. This cash hording move by Coca-Cola could be due to the company wanting additional cash on hand to cover potential mergers and acquisitions.
  • 5. How Coca-Cola Comparesto Industry Rivals In the Industry of Soft Drinks, Coca-Cola and PepsiCo are the two big gorillas. Coca- Cola and PepsiCo have been battling each other for more than a century. PepsiCo’s COGS percentage has been around 43% to 48% over the last ten years, whereas Coca-Cola has had a 34% to 39% of over the same time frame. The difference between Coca-Cola and PepsiCo’s COGS might seem small except when you consider that both companies have sales revenue in the billions each year. The small difference of 2-5% adds to tens of thousands of dollars each year. Coca-Cola had a slightly higher operating profit margin ranging from 22% to 27% over the ten year period than PepsiCo. PepsiCo endured an operating profit margin extending from 14% to 19% over the same period. This signifies that Coca-Cola has better control over its cost compared to PepsiCo. Overall, Coca-Cola and PepsiCo have similar margins and ratios. It appears that when Pepsi experiences a sharp decrease in revenue growth, Coca-Cola experiences that same effect on its growth revenue. The similarities in growth rates and COGS margin show that possible industry factors such as the price of sugar have the equivalent effects on the two companies. Pro Forma Income Sheet Analysis The assumed revenue growth for Coca-Cola’s pro forma income statement was based on the average growth rate from 2003 to 2012. One motive behind that assumption was due to the inconsistence of Coca-Cola’s sales growth. Coca-Cola had a sales growth ranging from -3% to 33%. Another motivation behind the assumed growth rate is caused by its recent announcement. Coca-Cola’s announced expanding operations into the at-home beverage system sector. The company will likely observe an increase in revenue as it begins to enter into a new market segment. Entering into a new market with large potential profits is a reason behind the
  • 6. assumption that Coca-Cola will have a sales growth rate of 10%. The suggested rate of 10% sales growth as opposed to a higher rate is due to an already present and successful competitor in the new market. Coca-Cola has strong brand recognition and a loyal customer base, so it’s not expected that Coca-Cola will experience negative sales growth in the next 10 years. The expectation that COGS will be 40% of sales for the next ten years, is based on trends from the past ten years. The COGS for the last two year were 39% of sales, so it’s expected that COGS will stay on the same trend. The dividend payout ratio is predicted to be 10% of sales. That assumption was based on the historical dividends payout ratio, which was around 9% to 12% over the last ten years. Pro Forma BalanceSheet Analysis The pro forma cash and equivalents is assumed to be 72 days of cash. That idea was made based on the average of the cash on hand that Coca-Cola had for the last ten years. The 72 days of cash on hand appears to be an appropriate notion when looking at the last four years. Coca-Cola for the last four years had a minimum of 64 days of cash on hand and a maximum of 100 days. The thought that short term investments will decrease from 16.9% of sales to 8.7% for the next ten years was based on the average rates from 2003-2012. That assumption was also based on Coca-Cola entering a new partnership with Green Mountain which is likely to require significant investments from Coca-Cola. That new partnership could cause Coca-Cola to scale back their short term investments while they focus their efforts on the Green Mountain partnership. The idea that long term debt will continue to be 17% of its assets, is based on Coca- Cola’s historical balance sheet ratios and financing needed for acquisition and partnerships. Coca-Cola’s long term debt for the last two years has stayed at 17% over assets. With Coca-Cola
  • 7. entering a new market segment of in home beverage system, the company is likely to encounter new obligations to be achieved in part by long term debt financing. Valuation of Coca-Cola It is calculated that Coca-Cola has a current fair value of $62.27 per share. The fair value price is higher than the last stock price of $38.64 on February 11, 2014. It appears that Coca- Cola’s stock is currently undervalued. A possible reason is its P/E ratio. Coca-Cola has a P/E ratio of 23. 81 for 2013. Some investors prefer a lower P/E ratio. The decrease of soda sales could also be contributing to the undervaluation of Coca-Cola. Americans have decreased their consumption of soda by 3.5 gallons per person compared to five years ago. Soda sales throughout industry the having been decreasing over the years. The decrease in consumption sales might have affected investors’ confidence in Coca-Cola stock. The investors’ confidence in Coca-Cola could also be low due to other factors such as the amount of cash Coca-Cola has on hand. Coca-Cola kept a large amount of cash on hand, which might worry some investors. Investors might have concern that Coca-Cola’s large holding of cash is a sign the company is taking precautionary effects, tempting investors to pass on investing. Investors and the market could have a lack of confidence in Coca-Cola’s ability to create double digit growth rates. Coca-Cola showed a revenue growth rate in double digits in only 3 of the last 10 years. Based on past sales, investors might expect Coca-Cola’s future revenue growth rate to be minimal. If investors and the stock market believe that Coca-Cola’s revenue growth is going to be less than the assumed 10% used in Exhibit 7, then it would cause the fair value per share to be closer to the current market price of the stock. An alternative reason that the fair value is higher than the stock price, could be due to the risk associated with the company. The market might view Coca-Cola’s stock at a higher risk than
  • 8. the risk used for the calculation of the fair value per share. The risk used for the fair value calculation was 7.4%. If a higher risk rate such as 13% was used it would make the fair value per share closer to the stock price. Also, the beta used to calculate the fair value per share of $62.27 was only .19 when the market used a beta of .34 to value Coca-Cola stock. Furthermore this impacted the difference between the market value and fair value price per share. The emerging threat of home beverage makers like Soda Stream, could also be contributing to Coca-Cola’s undervaluation. Coca-Cola and PepsiCo used to account for 70% of the soft drink beverage market. Coca-Cola underestimated the ability of Soda Stream to enter its competitive industry. Investors might have not have had the same thinking as Coca-Cola and viewed Soda Stream as a threat. The company’s impassive response to Soda Stream might have doubted investors trust in Coca-Cola. Coca-Cola just recently acknowledged Soda Stream as a threat and the actions it plans take to ensure it doesn’t lose additional market share. A combination of those factors potentially lead to the undervaluation of Coca-Cola stock. The company’s future actions and the way the market views those actions will only tell whether the company will continue to be undervalued or not.
  • 9. References: "Yahoo Finance - Business Finance, Stock Market, Quotes, News." Yahoo Finance. N.p., n.d. Web. 11 Feb. 2014. <http://finance.yahoo.com/>. Used to obtain Coca-Cola and S&P 500 monthly market prices Spending on Soft Drinks Dropped 3.3% between Late November, and A. Year Ago. "Soda Sales Are Losing Their Fizz." CNNMoney. Cable News Network, 10 Dec. 2013. Web. 12 Feb. 2014. <http://money.cnn.com/2013/12/10/news/companies/soda-sales-slump/>. "PepsiCo Inc." PEP XNYS:PEP Stock Quote Price News. N.p., n.d. Web. 14 Feb. 2014. <http://quotes.morningstar.com/stock/s?t=PEP®ion=usa&culture=en-US&ownerCo Kavilanz, Parija B. "Coca-Cola Posts Higher Profit, Sales." CNNMoney. Cable News Network, 17 Oct. 2007. Web. 14 Feb. 2014. <http://money.cnn.com/2007/10/17/news/companies/coke/>.untry=USA>. "Is the Coca-Cola Partnership With Green Mountain Truly a Game Changer?" DailyFinance.com. N.p., n.d. Web. 14 Feb. 2014. <http://www.dailyfinance.com/2014/02/10/is- the-coca-cola-partnership-with-green-mountain-t/>. "Coca-Cola History." World of Coca-Cola. N.p., n.d. Web. 11 Feb. 2014. <http://www.worldofcoca-cola.com/coca-cola-facts/coca-cola-history/>. "Coca-Cola Co." KO XNYS:KO Stock Quote Price News. N.p., n.d. Web. 14 Feb. 2014. <http://quotes.morningstar.com/stock/ko/s?t=ko>.
  • 10. ($ Millions) 2003-12 2004-12 2005-12 2006-12 2007-12 2008-12 2009-12 2010-12 2011-12 2012-12 Assets: Current assets: Cash: Cash and cash equivalents 3,362 6,707 4,701 2,440 4,093 4,701 7,021 8,517 12,803 8,442 Short-term investments 120 61 66 150 215 278 2,192 2,820 1,232 8,109 Total cash 3,482 6,768 4,767 2,590 4,308 4,979 9,213 11,337 14,035 16,551 Receivables 2,091 2,171 2,281 2,587 3,317 3,090 3,758 4,430 4,920 4,759 Inventories 1,252 1,420 1,424 1,641 2,220 2,187 2,354 2,650 3,092 3,264 Prepaid expenses 1,571 1,735 1,778 1,623 2,260 1,920 2,226 3,162 3,450 2,781 Other current assets - - - - - - - - - 2,973 Total current assets 8,396 12,094 10,250 8,441 12,105 12,176 17,551 21,579 25,497 30,328 Non-current assets: PPE Gross PPE 9,622 10,149 10,139 11,911 14,444 14,400 16,467 21,706 23,151 23,486 Accumulated Depreciation (3,525) (4,058) (4,353) (5,008) (5,951) (6,074) (6,906) (6,979) (8,212) (9,010) Net PPE 6,097 6,091 5,786 6,903 8,493 8,326 9,561 14,727 14,939 14,476 Equity and other investments - - - - - 5,779 6,755 7,585 8,374 10,448 Goodwill - - - 1,403 4,256 4,029 4,224 11,665 12,219 12,255 Intangible assets 3,989 3,836 3,821 3,732 7,963 8,476 8,604 15,244 15,450 15,082 Other long-term assets 8,860 9,306 9,570 9,484 10,452 1,733 1,976 2,121 3,495 3,585 Total non-current assets 18,946 19,233 19,177 21,522 31,164 28,343 31,120 51,342 54,477 55,846 Total assets 27,342 31,327 29,427 29,963 43,269 40,519 48,671 72,921 79,974 86,174 Liabilities and stockholders' equity Liabilities: Current liabilities: Short-term debt 2,906 6,021 4,546 3,268 6,052 6,531 6,800 9,376 14,912 17,874 Accounts payable 4,058 4,283 4,493 929 1,380 1,370 1,410 1,887 2,172 1,969 Taxes payable - - - - - 252 264 273 362 471 Accrued liabilities 922 667 797 4,693 5,793 4,835 5,247 6,972 6,837 6,711 Other current liabilities 796 Total current liabilities: 7,886 10,971 9,836 8,890 13,225 12,988 13,721 18,508 24,283 27,821 Non-current liabilities: Long-term debt 2,517 1,157 1,154 1,314 3,277 2,781 5,059 14,041 13,656 14,736 Deferred taxes liabilities 337 450 352 608 1,890 877 1,580 4,261 4,694 4,981 Minority interest - - - - - - 547 314 286 378 Other long-term liabilities 2,512 2,814 1,730 2,231 3,133 3,401 2,965 4,794 5,420 5,468 Total non-current liabilities 5,366 4,421 3,236 4,153 8,300 7,059 10,151 23,410 24,056 25,563 Total liabilities 13,252 15,392 13,072 13,043 21,525 20,047 23,872 41,918 48,339 53,384 Stockholders' equity Common stock 874 875 877 878 880 880 880 880 880 1,760 Additional paid-in capital 4,395 4,928 5,492 5,983 7,378 7,966 8,537 10,057 11,212 11,379 Retained earnings 26,687 29,105 31,299 33,468 36,235 38,513 41,537 49,278 53,550 58,045 Treasury stock (15,871) (17,625) (19,644) (22,118) (23,375) (24,213) (25,398) (27,762) (31,304) (35,009) Accumulated other comprehensive income (1,995) (1,348) (1,669) (1,291) 626 (2,674) (757) (1,450) (2,703) (3,385) Total stockholders' equity 14,090 15,935 16,355 16,920 21,744 20,472 24,799 31,003 31,635 32,790 Total liabilities and equity 27,342 31,327 29,427 29,963 43,269 40,519 48,671 72,921 79,974 86,174 Exhibit 1: COCA-COLA CO (KO) Historical Balance Sheet
  • 11. Growth Rate Y/Y 4% 5% 4% 20% 11% -3% 13% 33% 3% Fiscal year ends in December ($Millions) except per share data. 2003-12 2004-12 2005-12 2006-12 2007-12 2008-12 2009-12 2010-12 2011-12 2012-12 Revenue 21,044 21,962 23,104 24,088 28,857 31,944 30,990 35,119 46,542 48,017 Cost of revenue 7,762 7,638 8,195 8,164 10,406 11,374 11,088 12,693 18,216 19,053 Gross profit 13,282 14,324 14,909 15,924 18,451 20,570 19,902 22,426 28,326 28,964 Operating expenses: SGA 8,061 8,626 8,824 9,616 11,199 11,774 11,358 13,158 17,440 17,738 Other - - - - - 350 313 819 732 447 Total operating expenses 8,061 8,626 8,824 9,616 11,199 12,124 11,671 13,977 18,172 18,185 Operating income 5,221 5,698 6,085 6,308 7,252 8,446 8,231 8,449 10,154 10,779 Interest Expense 178 196 240 220 456 438 355 733 417 397 Other income (expense) 452 720 845 490 1,077 (569) 1,070 6,527 1,702 1,427 Income before taxes 5,495 6,222 6,690 6,578 7,873 7,439 8,946 14,243 11,439 11,809 Provision for income taxes 1,148 1,375 1,818 1,498 1,892 1,632 2,040 2,384 2,805 2,723 Net income from continuing operations 4,347 4,847 4,872 5,080 5,981 5,807 6,906 11,859 8,634 9,086 Other - - - - - - (82) (50) (62) (67) Net income 4,347 4,847 4,872 5,080 5,981 5,807 6,824 11,809 8,572 9,019 Net income available to common shareholders 4,347 4,847 4,872 5,080 5,981 5,807 6,824 11,809 8,572 9,019 Earnings per share ($) Basic 0.89 1 1.02 1.08 1.3 1.26 1.48 2.56 1.88 2 Diluted 0.89 1 1.02 1.08 1.29 1.25 1.47 2.53 1.85 1.97 Weighted average shares outstanding: Basic 4918 4852 4784 4696 4626 4630 4628 4616 4568 4504 Diluted 4924 4858 4786 4700 4662 4672 4658 4666 4646 4584 EBITDA 6523 7311 7862 7736 9492 9105 10537 16419 13810 14188 Book Value per Share ($) Basic 2.86 3.28 3.42 3.60 4.70 4.42 5.36 6.72 6.93 7.28 Diluted 2.86 3.28 3.42 3.60 4.66 4.38 5.32 6.64 6.81 7.15 Exhibit 2: COCA-COLA CO (KO) Historical Income Statement
  • 12. Fiscal year ends in December ($ Millions) 2011-06 2011-09 2011-12 2012-03 2012-06 2012-09 2012-12 2013-03 2013-06 2013-09 Revenue 12,737 12,248 11,040 11,137 13,085 12,340 11,455 11,035 12,749 12,030 Cost of revenue 4,989 4,875 4,403 4,348 5,224 4,853 4,628 4,324 4,989 4,793 Gross profit 7,748 7,373 6,637 6,789 7,861 7,487 6,827 6,711 7,760 7,237 Operating expenses: SGA 4,422 4,527 4,411 3,014 4,497 4,630 4,430 2,989 3,089 3,132 Other 152 96 275 1,266 70 64 214 1,314 1,428 1,633 Total operating expenses 4,574 4,623 4,686 4,280 4,567 4,694 4,644 4,303 4,517 4,765 Operating income 3,174 2,750 1,951 2,509 3,294 2,793 2,183 2,408 3,243 2,472 Interest Expense 84 116 104 88 112 102 95 102 122 90 Other income (expense) 704 289 364 304 441 393 289 38 404 998 Income before taxes 3,794 2,923 2,211 2,725 3,623 3,084 2,377 2,344 3,525 3,380 Provision for income taxes 990 680 537 658 823 755 487 575 831 925 Net income from continuing operations 2,804 2,243 1,674 2,067 2,800 2,329 1,890 1,769 2,694 2,455 Other (7) (22) (20) (13) (12) (18) (24) (18) (18) (8) Net income 2,797 2,221 1,654 2,054 2,788 2,311 1,866 1,751 2,676 2,447 Net income available to common shareholders 2,797 2,221 1,654 2,054 2,788 2,311 1,866 1,751 2,676 2,447 Earnings per share ($) Basic 0.61 0.49 0.36 0.46 0.62 0.51 0.42 0.39 0.6 0.55 Diluted 0.6 0.48 0.36 0.45 0.61 0.5 0.41 0.39 0.59 0.54 Weighted average shares outstanding Basic 4580 4572 4538 4526 4510 4502 4477 4455 4446 4426 Diluted 4660 4652 4610 4602 4592 4587 4557 4530 4527 4498 EBITDA 3174 2750 2846 3260 3294 2793 2985 2919 3243 2472 Exhibit 3: COCA-COLA CO (KO) Historical Quarterly Income Statement
  • 13.
  • 14. ($millions, except per share data) 2003-12 2004-12 2005-12 2006-12 2007-12 2008-12 2009-12 2010-12 2011-12 2012-12 Cash Flows From Operating Activities Net income 4,347 4,847 4,872 5,080 5,981 5,807 6,906 11,859 8,634 9,086 Depreciation & amortization 850 893 932 938 1,163 1,228 1,236 1,443 1,954 1,982 Deferred income taxes (188) 162 (88) (35) 109 (360) 353 617 1,028 632 Stock based compensation - - - - - 266 241 380 354 259 Accounts receivable - - - - - 148 (404) (41) (562) (33) Inventory 111 (57) (79) (150) (258) (165) (50) 182 (447) (286) Prepaid expenses (276) (397) 244 (152) (244) 63 (332) (148) (350) (29) Accrued liabilities - - - - - (121) 81 (266) (132) 770 Other working capital (3) (163) 265 (313) 508 (613) 141 643 (402) (1,502) Other non-cash items 615 683 277 589 (109) 1,318 14 (5,137) (603) (234) Net cash provided by operating activities 5,456 5,968 6,423 5,957 7,150 7,571 8,186 9,532 9,474 10,645 Cash Flows From Investing Activities: Investments in PPE (812) (755) (899) (1,407) (1,648) (1,968) (1,993) (2,215) (2,920) (2,780) PPE reductions 87 341 88 112 239 129 104 134 101 143 Acquisitions, net (359) (267) (637) (901) (5,653) (280) (60) (1,539) 562 2,189 Purchases of investments (177) (46) (53) (82) (99) (244) (2,200) (4,817) (5,821) (16,391) Sales/Maturities of investments 147 161 33 640 448 - - 4,032 5,647 5,622 Other investing activities 178 63 (28) (62) (6) - - - (93) (187) Net cash used for investing activities (936) (503) (1,496) (1,700) (6,719) (2,363) (4,149) (4,405) (2,524) (11,404) Cash Flows From Financing Activities: Debt issued - - - - - 4,337 14,689 15,251 27,495 42,791 Debt repayment - - - - - (4,308) (12,326) (13,403) (22,530) (38,573) Common stock issued 98 193 230 148 1,619 586 662 1,666 1,569 1,489 Common stock repurchased (1,440) (1,739) (2,055) (2,416) (1,838) (1,079) (1,518) (2,961) (4,513) (4,559) Dividend paid (2,166) (2,429) (2,678) (2,911) (3,149) (3,521) (3,800) (4,068) (4,300) (4,595) Other financing activities (93) 1,714 (2,282) (1,404) 4,341 - - 50 45 100 Net cash provided by financing activities (3,601) (2,261) (6,785) (6,583) 973 (3,985) (2,293) (3,465) (2,234) (3,347) Effect of exchange rate changes 183 141 (148) 65 249 (615) 576 (166) (430) (255) Net change in cash 1,102 3,345 (2,006) (2,261) 1,653 608 2,320 1,496 4,286 (4,361) Cash at beginning of period 2,260 3,362 6,707 4,701 2,440 4,093 4,701 7,021 8,517 12,803 Cash at end of period 3,362 6,707 4,701 2,440 4,093 4,701 7,021 8,517 12,803 8,442 Free Cash Flow Operating cash flow 5,456 5,968 6,423 5,957 7,150 7,571 8,186 9,532 9,474 10,645 Capital expenditure (812) (755) (899) (1,407) (1,648) (1,968) (1,993) (2,215) (2,920) (2,780) Free cash flow 4,644 5,213 5,524 4,550 5,502 5,603 6,193 7,317 6,554 7,865 Exhibit 4: COCA-COLA CO (KO) Historical Statement of Cash Flow
  • 15.
  • 16. 2003 2004 2005 2006 2007 2008 2009 2010 2011 2012 2013 2014 2015 2016 2017 2018 2019 2020 2021 2022 Revenue 100.0% 100.0% 100.0% 100.0% 100.0% 100.0% 100.0% 100.0% 100.0% 100.0% 100.0% 100.0% 100.0% 100.0% 100.0% 100.0% 100.0% 100.0% 100.0% 100.0% COGS 36.9% 34.8% 35.5% 33.9% 36.1% 35.6% 35.8% 36.1% 39.1% 39.7% 40.0% 40.0% 40.0% 40.0% 40.0% 40.0% 40.0% 40.0% 40.0% 40.0% Gross Profit 63.1% 65.2% 64.5% 66.1% 63.9% 64.4% 64.2% 63.9% 60.9% 60.3% 60.0% 60.0% 60.0% 60.0% 60.0% 60.0% 60.0% 60.0% 60.0% 60.0% SGA 38.3% 39.3% 38.2% 39.9% 38.8% 36.9% 36.7% 37.5% 37.5% 36.9% 36.9% 36.8% 36.7% 36.6% 36.5% 36.5% 36.4% 36.4% 36.4% 36.3% Other Operating Expenses 0.0% 0.0% 0.0% 0.0% 0.0% 1.1% 1.0% 2.3% 1.6% 0.9% 1.0% 1.0% 1.0% 1.0% 1.0% 1.0% 1.0% 1.0% 1.0% 1.0% Operating Income 24.8% 25.9% 26.3% 26.2% 25.1% 26.4% 26.6% 24.1% 21.8% 22.4% 22.1% 22.2% 22.3% 22.4% 22.5% 22.5% 22.6% 22.6% 22.6% 22.7% Interest Expense 0.8% 0.9% 1.0% 0.9% 1.6% 1.4% 1.1% 2.1% 0.9% 0.8% 1.0% 1.0% 1.0% 1.0% 1.0% 1.0% 1.0% 1.0% 1.0% 1.0% Other Income Expense 2.1% 3.3% 3.7% 2.0% 3.7% -1.8% 3.5% 18.6% 3.7% 3.0% 3.1% 3.1% 3.1% 3.1% 3.1% 3.1% 3.1% 3.1% 3.1% 3.1% Income pre-tax 26.1% 28.3% 29.0% 27.3% 27.3% 23.3% 28.9% 40.6% 24.6% 24.6% 18.0% 18.1% 18.2% 18.3% 18.4% 18.4% 18.4% 18.5% 18.5% 18.6% Income Taxes 5.5% 6.3% 7.9% 6.2% 6.6% 5.1% 6.6% 6.8% 6.0% 5.7% 4.1% 4.1% 4.1% 4.1% 4.1% 4.2% 4.2% 4.2% 4.2% 4.2% Income from con. Operations 20.7% 22.1% 21.1% 21.1% 20.7% 18.2% 22.3% 33.8% 18.6% 18.9% 13.9% 14.0% 14.1% 14.2% 14.2% 14.2% 14.3% 14.3% 14.3% 14.4% Other 0.0% 0.0% 0.0% 0.0% 0.0% 0.0% -0.3% -0.1% -0.1% -0.1% -0.1% -0.1% -0.1% -0.1% -0.1% -0.1% -0.1% -0.1% -0.1% -0.1% Net Income 20.7% 22.1% 21.1% 21.1% 20.7% 18.2% 22.0% 33.6% 18.4% 18.8% 13.8% 13.9% 14.0% 14.1% 14.1% 14.1% 14.2% 14.2% 14.2% 14.3% Dividends Payout -10% -11% -12% -12% -11% -11% -12% -12% -9% -10% 11.0% 11.0% 11.0% 11.0% 11.0% 11.0% 11.0% 11.0% 11.0% 11.0% Exhibit 5: Common Size Income Statement
  • 17. Exhibit 6A: Ratios Activity Rates 2003 2004 2005 2006 2007 2008 2009 2010 2011 2012 2013 2014 2015 2016 2017 2018 2019 2020 2021 2022 Sales per Day 58 60 63 66 79 88 85 96 128 132 145 159 173 186 196 206 216 227 238 250 COGS per Day 21 21 22 22 29 31 30 35 50 52 58 64 69 74 78 82 86 91 95 100 SGA per Day 22 24 24 26 31 32 31 36 48 49 53 58 64 68 71 75 79 83 87 91 Activity Ratios 2003 2004 2005 2006 2007 2008 2009 2010 2011 2012 2013 2014 2015 2016 2017 2018 2019 2020 2021 2022 Days of Cash (Cash/SPD) 58 111 74 37 52 54 83 89 100 64 72.22956 72.22956 72.22956 72.22956 72.22956 72.22956 72.22956 72.22956 72.22956 72.22956 Short Term Invest. (% of Sales) 0.6% 0.3% 0.3% 0.6% 0.7% 0.9% 7.1% 8.0% 2.6% 16.9% 8.7% 8.7% 8.7% 8.7% 8.7% 8.7% 8.7% 8.7% 8.7% 8.7% Days of Receivables (AR/SPD) 36 36 36 39 42 35 44 46 39 36 39 39 39 39 39 39 39 39 39 39 Days of Inventory (IN/DCPD) 59 68 63 73 78 70 77 76 62 63 69 69 69 69 69 69 69 69 69 69 Prepaid Expenses (% of Sales) 7% 8% 8% 7% 8% 6% 7% 9% 7% 6% 7% 7% 7% 7% 7% 7% 7% 7% 7% 7% Other CA (% of Sales) 0.0% 0.0% 0.0% 0.0% 0.0% 0.0% 0.0% 0.0% 0.0% 6.2% 6% 6% 6% 6% 6% 6% 6% 6% 6% 6% Gross PPETurns/Year (Sales/PPE) 2.2 2.2 2.3 2.0 2.0 2.2 1.9 1.6 2.0 2.0 2 2 2 2 2 2 2 2 2 2 Deprecation (% of Sales) -17% -18% -19% -21% -21% -19% -22% -20% -18% -19% -19% -19% -19% -19% -19% -19% -19% -19% -19% -19% Equity and other In. (% of Sales) 0% 0% 0% 0% 0% 18% 22% 22% 18% 22% 22% 22% 22% 22% 22% 22% 22% 22% 22% 22% Goodwill (% of Sales) 0% 0% 0% 6% 15% 13% 14% 33% 26% 26% 26% 26% 26% 26% 26% 26% 26% 26% 26% 26% Intangible Assets (% of Sales) 19% 17% 17% 15% 28% 27% 28% 43% 33% 31% 30% 30% 30% 30% 30% 30% 30% 30% 30% 30% Other LTAssets (% of Sales) 42% 42% 41% 39% 36% 5% 6% 6% 8% 7% 7% 7% 7% 7% 7% 7% 7% 7% 7% 7% Total Assets Turnover (Sales/TA) 0.77 0.70 0.79 0.80 0.67 0.79 0.64 0.48 0.58 0.56 0.53 0.53 0.54 0.54 0.54 0.53 0.53 0.53 0.52 0.52 Short Term Debt (% of Sales) 14% 27% 20% 14% 21% 20% 22% 27% 32% 37% 42% 42% 42% 42% 42% 42% 42% 42% 42% 42% Days of AP (AP/DCPD) 191 205 200 42 48 44 46 54 44 38 34 34 34 34 34 34 34 34 34 34 Taxes Payable (% of Sales) 0% 0% 0% 0% 0% 1% 1% 1% 1% 1% 1% 1% 1% 1% 1% 1% 1% 1% 1% 1% Accrued Liab. (% of Sales) 4% 3% 3% 19% 20% 15% 17% 20% 15% 14% 17% 17% 17% 17% 17% 17% 17% 17% 17% 17% Other CL(% of Sales) 0% 0% 0% 0% 0% 0% 0% 0% 0% 2% 2% 2% 2% 2% 2% 2% 2% 2% 2% 2% LTD/TA 9% 4% 4% 4% 8% 7% 10% 19% 17% 17% 17% 17% 17% 17% 17% 17% 17% 17% 17% 17% Deferred Tax Liab (% of Sales) 2% 2% 2% 3% 7% 3% 5% 12% 10% 10% 10% 10% 10% 10% 10% 10% 10% 10% 10% 10% Minority Interest (% of sales) 0% 0% 0% 0% 0% 0% 2% 1% 1% 1% 1% 1% 1% 1% 1% 1% 1% 1% 1% 1% Other Long term Liab (% of Sales) 12% 13% 7% 9% 11% 11% 10% 14% 12% 11% 11% 11% 11% 11% 11% 11% 11% 11% 11% 11% Addition In Capital (% of Sales) 21% 22% 24% 25% 26% 25% 28% 29% 24% 24% 25% 25% 25% 25% 25% 25% 25% 25% 25% 25% Acc. income( % of sales) -9% -6% -7% -5% 2% -8% -2% -4% -6% -7% -5% -5% -5% -5% -5% -5% -5% -5% -5% -5% Total Equity Turnover (Sales/TE) 1.5 1.4 1.4 1.4 1.3 1.6 1.2 1.1 1.5 1.5 1.4 1.5 1.5 1.5 1.5 1.5 1.5 1.4 1.4 1.4
  • 18. Exhibit 6B: Ratios Liquidity 2003 2004 2005 2006 2007 2008 2009 2010 2011 2012 2013 2014 2015 2016 2017 2018 2019 2020 2021 2022 CurrentRatio (CA/CL) 1.06 1.10 1.04 0.95 0.92 0.94 1.28 1.17 1.05 1.09 1.12 1.09 1.07 1.07 1.08 1.10 1.11 1.13 1.15 1.16 Quick Ratio ((CA-Inv)/CL) 0.91 0.97 0.90 0.76 0.75 0.77 1.11 1.02 0.92 0.97 1.00 0.98 0.96 0.96 0.97 0.98 1.00 1.02 1.03 1.05 Cash Ratio (Total Cash/CL) 0.44 0.62 0.48 0.29 0.33 0.38 0.67 0.61 0.58 0.59 0.64 0.61 0.59 0.59 0.60 0.62 0.63 0.65 0.66 0.68 Leverage Funded Debt/Equity (LTD/TE) 0.18 0.07 0.07 0.08 0.15 0.14 0.20 0.45 0.43 0.45 0.47 0.47 0.48 0.48 0.47 0.47 0.47 0.46 0.46 0.46 Total DebtRatio (TD/TA) 48% 49% 44% 44% 50% 49% 49% 57% 60% 62% 63% 64% 64% 64% 64% 64% 64% 63% 63% 63% Profitability ROIC (EBIT*(1-Tavg)/TIC) 24% 26% 27% 27% 22% 28% 21% 15% 17% 18% 17% 17% 18% 18% 18% 17% 17% 17% 17% 17% ROA (NI/TA) 16% 15% 17% 17% 14% 14% 14% 16% 11% 10% 7% 7% 8% 8% 8% 8% 8% 7% 7% 7% ROE(NI/CE) 31% 30% 30% 30% 28% 28% 28% 38% 27% 28% 20% 21% 21% 21% 21% 21% 21% 20% 20% 20% Gross ProfitMargin (GP/Revenue) 63% 65% 65% 66% 64% 64% 64% 64% 61% 60% 60% 60% 60% 60% 60% 60% 60% 60% 60% 60% OP Margin (OP/Revenue) 25% 26% 26% 26% 25% 26% 27% 24% 22% 22% 22% 22% 22% 22% 22% 23% 23% 23% 23% 23% NetProfitMargin (NI/Revenue) 21% 22% 21% 21% 21% 18% 22% 34% 18% 19% 14% 14% 14% 14% 14% 14% 14% 14% 14% 14% InvestmentValuationRatios Price to EarningRatio 43.42 38.64 37.88 35.78 29.72 30.67 26.11 15.09 20.55 19.32 23.81 21.53 19.64 18.27 17.27 16.39 15.57 14.79 14.06 13.36 P/S perShare Ratio(Basic) 9.03 8.54 8.00 7.53 6.19 5.60 5.77 5.08 3.79 3.62 3.29 3.00 2.75 2.57 2.44 2.32 2.21 2.10 2.00 1.91 P/S perShare Ratio (Diluted) 9.04 8.55 8.00 7.54 6.24 5.65 5.81 5.13 3.86 3.69 3.35 3.05 2.80 2.62 2.48 2.36 2.25 2.14 2.04 1.94 P/Eto growth ratio ((P/E)/(g*100) 8.86 7.29 8.40 1.50 2.87 (8.74) 1.13 0.63 6.10 2.38 2.19 2.17 2.60 3.14 3.22 3.10 2.96 2.81 2.67 Price/Book Value Ratio (Basic) 13.49 11.77 11.30 10.72 8.22 8.74 7.21 5.75 5.58 5.31 4.77 4.44 4.14 3.87 3.63 3.41 3.21 3.02 2.84 2.67 Price/Book Value Ratio (Diluted) 13.50 11.78 11.31 10.73 8.28 8.82 7.26 5.82 5.67 5.40 4.86 4.52 4.21 3.93 3.69 3.47 3.27 3.07 2.89 2.72
  • 19. mu 5 gs 10% gs = expected sales growth rate lam 10 gp 5% gp= perpetual growth rate 1 2 3 4 5 6 7 8 9 10 t Exhibit 7 99% 96% 80% 40% 10% 2% 0% 0% 0% 0% yt Pro Forma Income Statement ($ Millions) 10% 10% 9% 7% 6% 5% 5% 5% 5% 5% gt 2013 2014 2015 2016 2017 2018 2019 2020 2021 2022 Revenue 52,821 58,020 63,267 67,712 71,439 75,076 78,841 82,785 86,925 91,271 Cost of revenue 21,128 23,208 25,307 27,085 28,576 30,030 31,536 33,114 34,770 36,508 40% % of Sales Gross profit 31,693 34,812 37,960 40,627 42,863 45,045 47,305 49,671 52,155 54,763 Operating expenses: SGA 19,477 21,325 23,190 24,770 26,095 27,388 28,727 30,129 31,600 33,145 Trend Other 528 580 633 677 714 751 788 828 869 913 1% % of Sales Total operating expenses 20,005 21,905 23,823 25,448 26,810 28,139 29,515 30,956 32,469 34,058 Operating income 11,687 12,907 14,137 15,180 16,054 16,907 17,790 18,715 19,685 20,705 Interest Expense 528 580 633 677 714 751 788 828 869 913 1% % of Sales Other income (expense) 1,646 1,808 1,972 2,110 2,226 2,340 2,457 2,580 2,709 2,844 3% % of Sales Income before taxes 9,513 10,518 11,533 12,392 13,113 13,816 14,544 15,307 16,107 16,948 Provision for income taxes 2,150 2,377 2,607 2,801 2,964 3,123 3,287 3,460 3,641 3,831 23% Avg. Tax Net income from continuing operations 7,363 8,141 8,926 9,591 10,149 10,693 11,257 11,847 12,467 13,117 Other (53) (58) (63) (68) (71) (75) (79) (83) (87) (91) -0.1% % of Sales Net income 7,310 8,083 8,863 9,524 10,078 10,618 11,178 11,764 12,380 13,026 Dividends Paid 5,810 6,382 6,959 7,448 7,858 8,258 8,673 9,106 9,562 10,040 11% % of Sales Weighted average shares outstanding: Basic 4,504 4,504 4,504 4,504 4,504 4,504 4,504 4,504 4,504 4,504 No Change Diluted 4,584 4,584 4,584 4,584 4,584 4,584 4,584 4,584 4,584 4,584 No Change Earnings per share ($) Basic 1.62 1.79 1.97 2.11 2.24 2.36 2.48 2.61 2.75 2.89 Diluted 1.59 1.76 1.93 2.08 2.20 2.32 2.44 2.57 2.70 2.84 Dividend Per Share ($) Basic 1.29 1.42 1.55 1.65 1.74 1.83 1.93 2.02 2.12 2.23 Diluted 1.27 1.39 1.52 1.62 1.71 1.80 1.89 1.99 2.09 2.19 Book Value per Share ($) Basic 8.10 8.70 9.34 9.99 10.65 11.33 12.04 12.80 13.60 14.45 Diluted 7.96 8.54 9.18 9.82 10.46 11.13 11.83 12.58 13.37 14.20 Assumptions
  • 20.
  • 21.
  • 22. ($ Millions) 2013 2014 2015 2016 2017 2018 2019 2020 2021 2022 Beginning Balance 58,045 59,545 61,245 63,149 65,224 67,443 69,803 72,309 74,967 77,784 Plus: Net Income 7,310 8,083 8,863 9,524 10,078 10,618 11,178 11,764 12,380 13,026 Less: Dividends 5,810 6,382 6,959 7,448 7,858 8,258 8,673 9,106 9,562 10,040 Ending Balance 59,545 61,245 63,149 65,224 67,443 69,803 72,309 74,967 77,784 80,770 Exhibit 9: Schedule of Retained Earnings
  • 23. ($Million) 2013 2014 2015 2016 2017 2018 2019 2020 2021 2022 EBIT*(1-Tavg) 9,046 9,989 10,942 11,749 12,425 13,085 13,769 14,485 15,236 16,025 Share-based comp. expense - - - - - - - - - - Less (increases) in: Account's Receivable (884) (555) (561) (475) (398) (389) (402) (421) (442) (464) Inventory (729) (4,386) (4,782) (5,118) (5,400) (5,675) (5,960) (6,258) (6,571) (6,899) Current Tax Assets - - - - - - - - - - Prepayments (ST) 1,077 380 383 325 272 266 275 288 302 317 Other CA (302) (322) (325) (276) (231) (225) (233) (245) (257) (269) Net PPE (1,737) (1,596) (1,611) (1,364) (1,144) (1,116) (1,156) (1,211) (1,271) (1,334) Plus increases in: Accounts Payable (1) 194 196 166 139 136 140 147 154 162 Taxes Payable 57 52 52 44 37 36 38 39 41 43 Accrued Expenses 2,355 892 901 763 640 624 646 677 710 746 Other CL 260 104 105 89 75 73 75 79 83 87 Deferred Tax 301 520 525 444 373 364 377 394 414 435 Other Liabilities 303 568 573 486 407 397 411 431 452 475 FCF 9,747 5,840 6,398 6,832 7,194 7,575 7,980 8,406 8,853 9,323 Years to FCF - 1 2 3 4 5 6 7 8 9 PV(FCF) 9,747 5,438 5,548 5,518 5,411 5,306 5,205 5,106 5,008 4,911 Valuation PV(FCF(2013-2022)) 57,198 Tmrg 23% PV(CFCF)** 216,492 Net Debt (26,999) Plus excess assets: MktCap 174,035 Cash & Equiv. 8,442 Rd 6.1% ST Investments 8,109 mBeta 0.19 LT Investments 10,448 BBeta 0.46 Enterprise Value 300,690 Rf 3.6% Less liabilities: MRP 6.2% LTD 2012 (14,736) Re 6.5% Employee Stk Option Liab. - Wd (0.18) Other LT Liab. (5,468) We 1.18 Preferred stock - WACC 7.4% Common Equity Value 280,486 Shares Outstanding (mill)1 4,504.00 Fair value per share 62.27 Last Trade 2 38.64 1 Shares outstanding amount is the weighted average basic shares outstanding for 2012 2 Last trade price of shares was obtained from Morningstar.com on 2/11/2014. The last trade price was the KO stock close price on 2/11/14 Exhibit 11: Coca-Cola Free Cash Flows WACC Calculation
  • 24.
  • 25. Exhibit 12: Market Prices For S&P 500 and Coca-Cola (KO) Date S&P500 KO 1/4/2010 1073.87 54.25 LN(It/It-1) LN(Pt/Pt-1) 2/1/2010 1104.49 52.72 2.81% -2.86% 3/1/2010 1169.43 55 5.71% 4.23% 4/1/2010 1186.69 53.45 1.47% -2.86% 5/3/2010 1089.41 51.4 -8.55% -3.91% 6/1/2010 1030.71 50.12 -5.54% -2.52% 7/1/2010 1101.6 55.11 6.65% 9.49% 8/2/2010 1049.33 55.88 -4.86% 1.39% 9/1/2010 1141.2 58.52 8.39% 4.62% 10/1/2010 1183.26 61.32 3.62% 4.67% 11/1/2010 1180.55 63.17 -0.23% 2.97% 12/1/2010 1257.64 65.77 6.33% 4.03% 1/3/2011 1286.12 62.85 2.24% -4.54% 2/1/2011 1327.22 63.92 3.15% 1.69% 3/1/2011 1325.83 66.34 -0.10% 3.72% 4/1/2011 1363.61 67.46 2.81% 1.67% 5/2/2011 1345.2 66.81 -1.36% -0.97% 6/1/2011 1320.64 67.29 -1.84% 0.72% 7/1/2011 1292.28 68.01 -2.17% 1.06% 8/1/2011 1218.89 70.45 -5.85% 3.52% 9/1/2011 1131.42 67.56 -7.45% -4.19% 10/3/2011 1253.3 68.32 10.23% 1.12% 11/1/2011 1246.96 67.23 -0.51% -1.61% 12/1/2011 1257.6 69.97 0.85% 3.99% 1/3/2012 1312.41 67.53 4.27% -3.55% 2/1/2012 1365.68 69.86 3.98% 3.39% 3/1/2012 1408.47 74.01 3.09% 5.77% 4/2/2012 1397.91 76.32 -0.75% 3.07% 5/1/2012 1310.33 74.73 -6.47% -2.11% 6/1/2012 1362.16 78.19 3.88% 4.53% 7/2/2012 1379.32 80.8 1.25% 3.28% 8/1/2012 1406.58 37.4 1.96% -77.03% 9/4/2012 1440.67 37.93 2.39% 1.41% 10/1/2012 1412.16 37.18 -2.00% -2.00% Slope 11/1/2012 1416.18 37.92 0.28% 1.97% 0.235049 12/3/2012 1426.19 36.25 0.70% -4.50% 0.235601 1/2/2013 1498.11 37.24 4.92% 2.69% 0.259219 2/1/2013 1514.68 38.72 1.10% 3.90% 0.231445 3/1/2013 1569.19 40.44 3.54% 4.35% 0.253131 4/1/2013 1597.57 42.33 1.79% 4.57% 0.246716 5/1/2013 1630.74 39.99 2.06% -5.69% 0.23471 6/3/2013 1606.28 40.11 -1.51% 0.30% 0.127151 7/1/2013 1685.73 40.08 4.83% -0.07% 0.16966 8/1/2013 1632.97 38.18 -3.18% -4.86% 0.126648 9/3/2013 1681.55 37.88 2.93% -0.79% 0.094344 10/1/2013 1756.54 39.57 4.36% 4.36% 0.14698 11/1/2013 1805.81 40.19 2.77% 1.55% 0.100284 12/2/2013 1848.36 41.31 2.33% 2.75% 0.121798 1/2/2014 1782.59 37.82 -3.62% -8.83% 0.179705