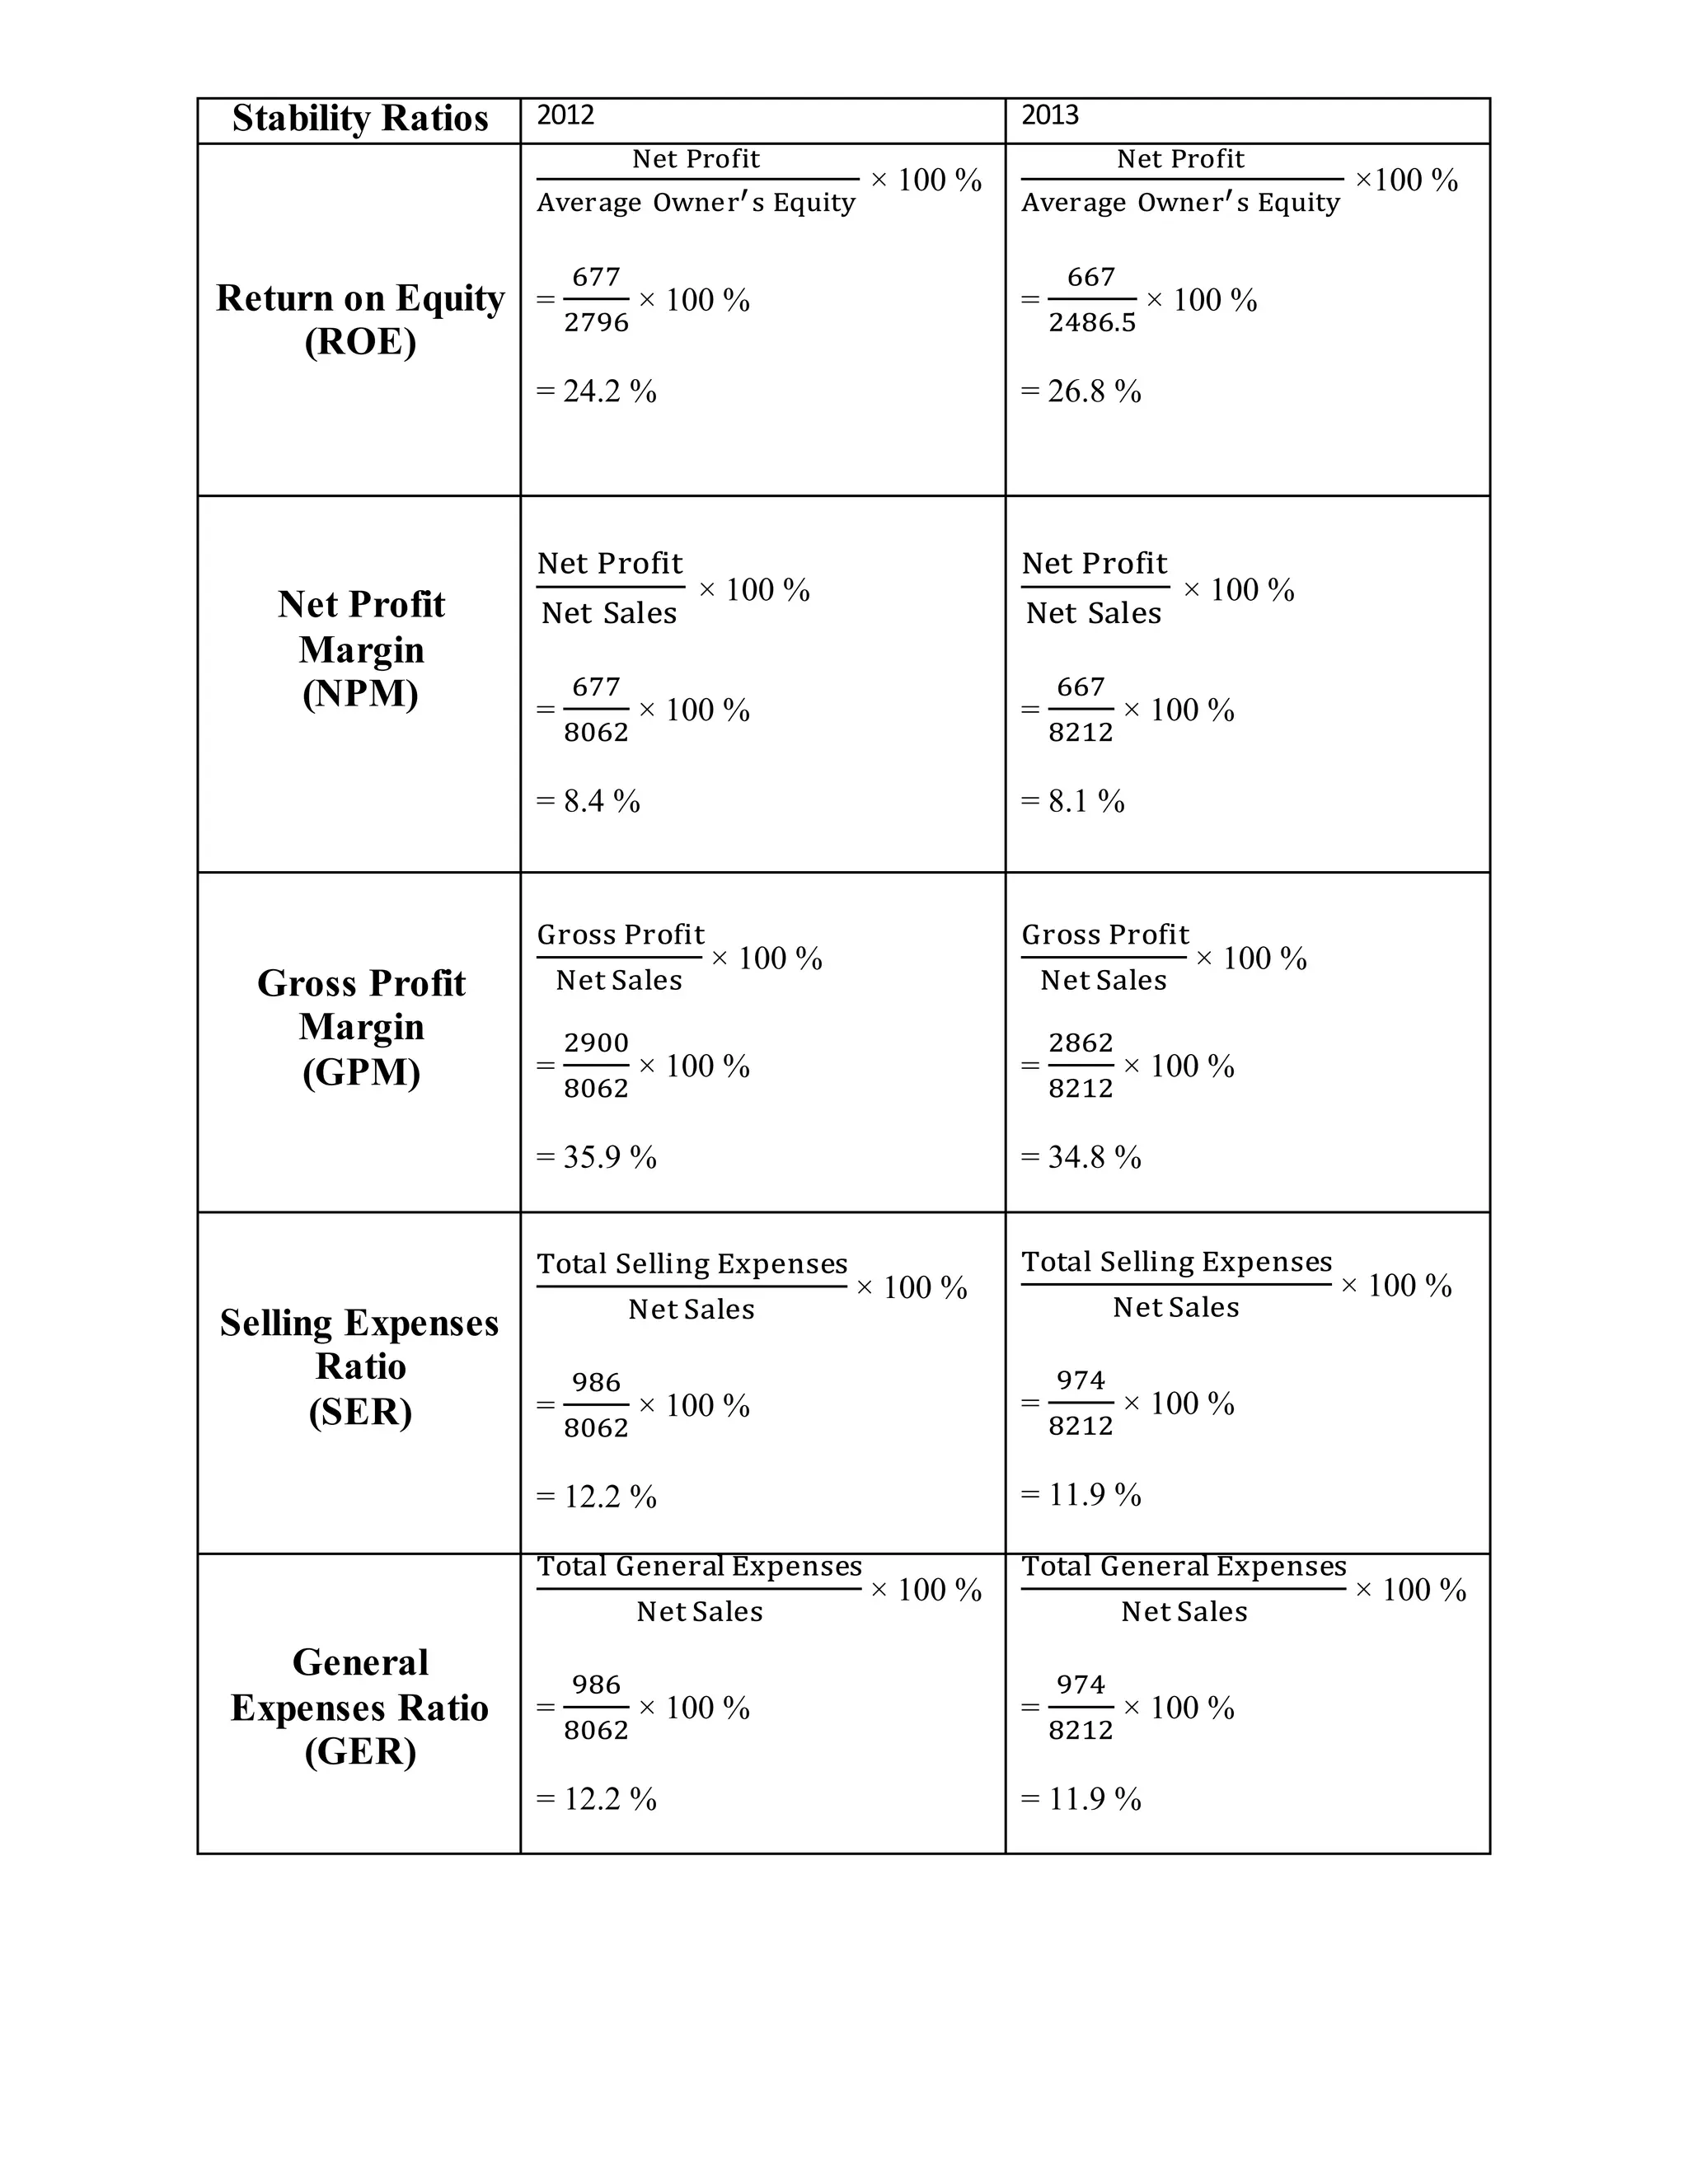
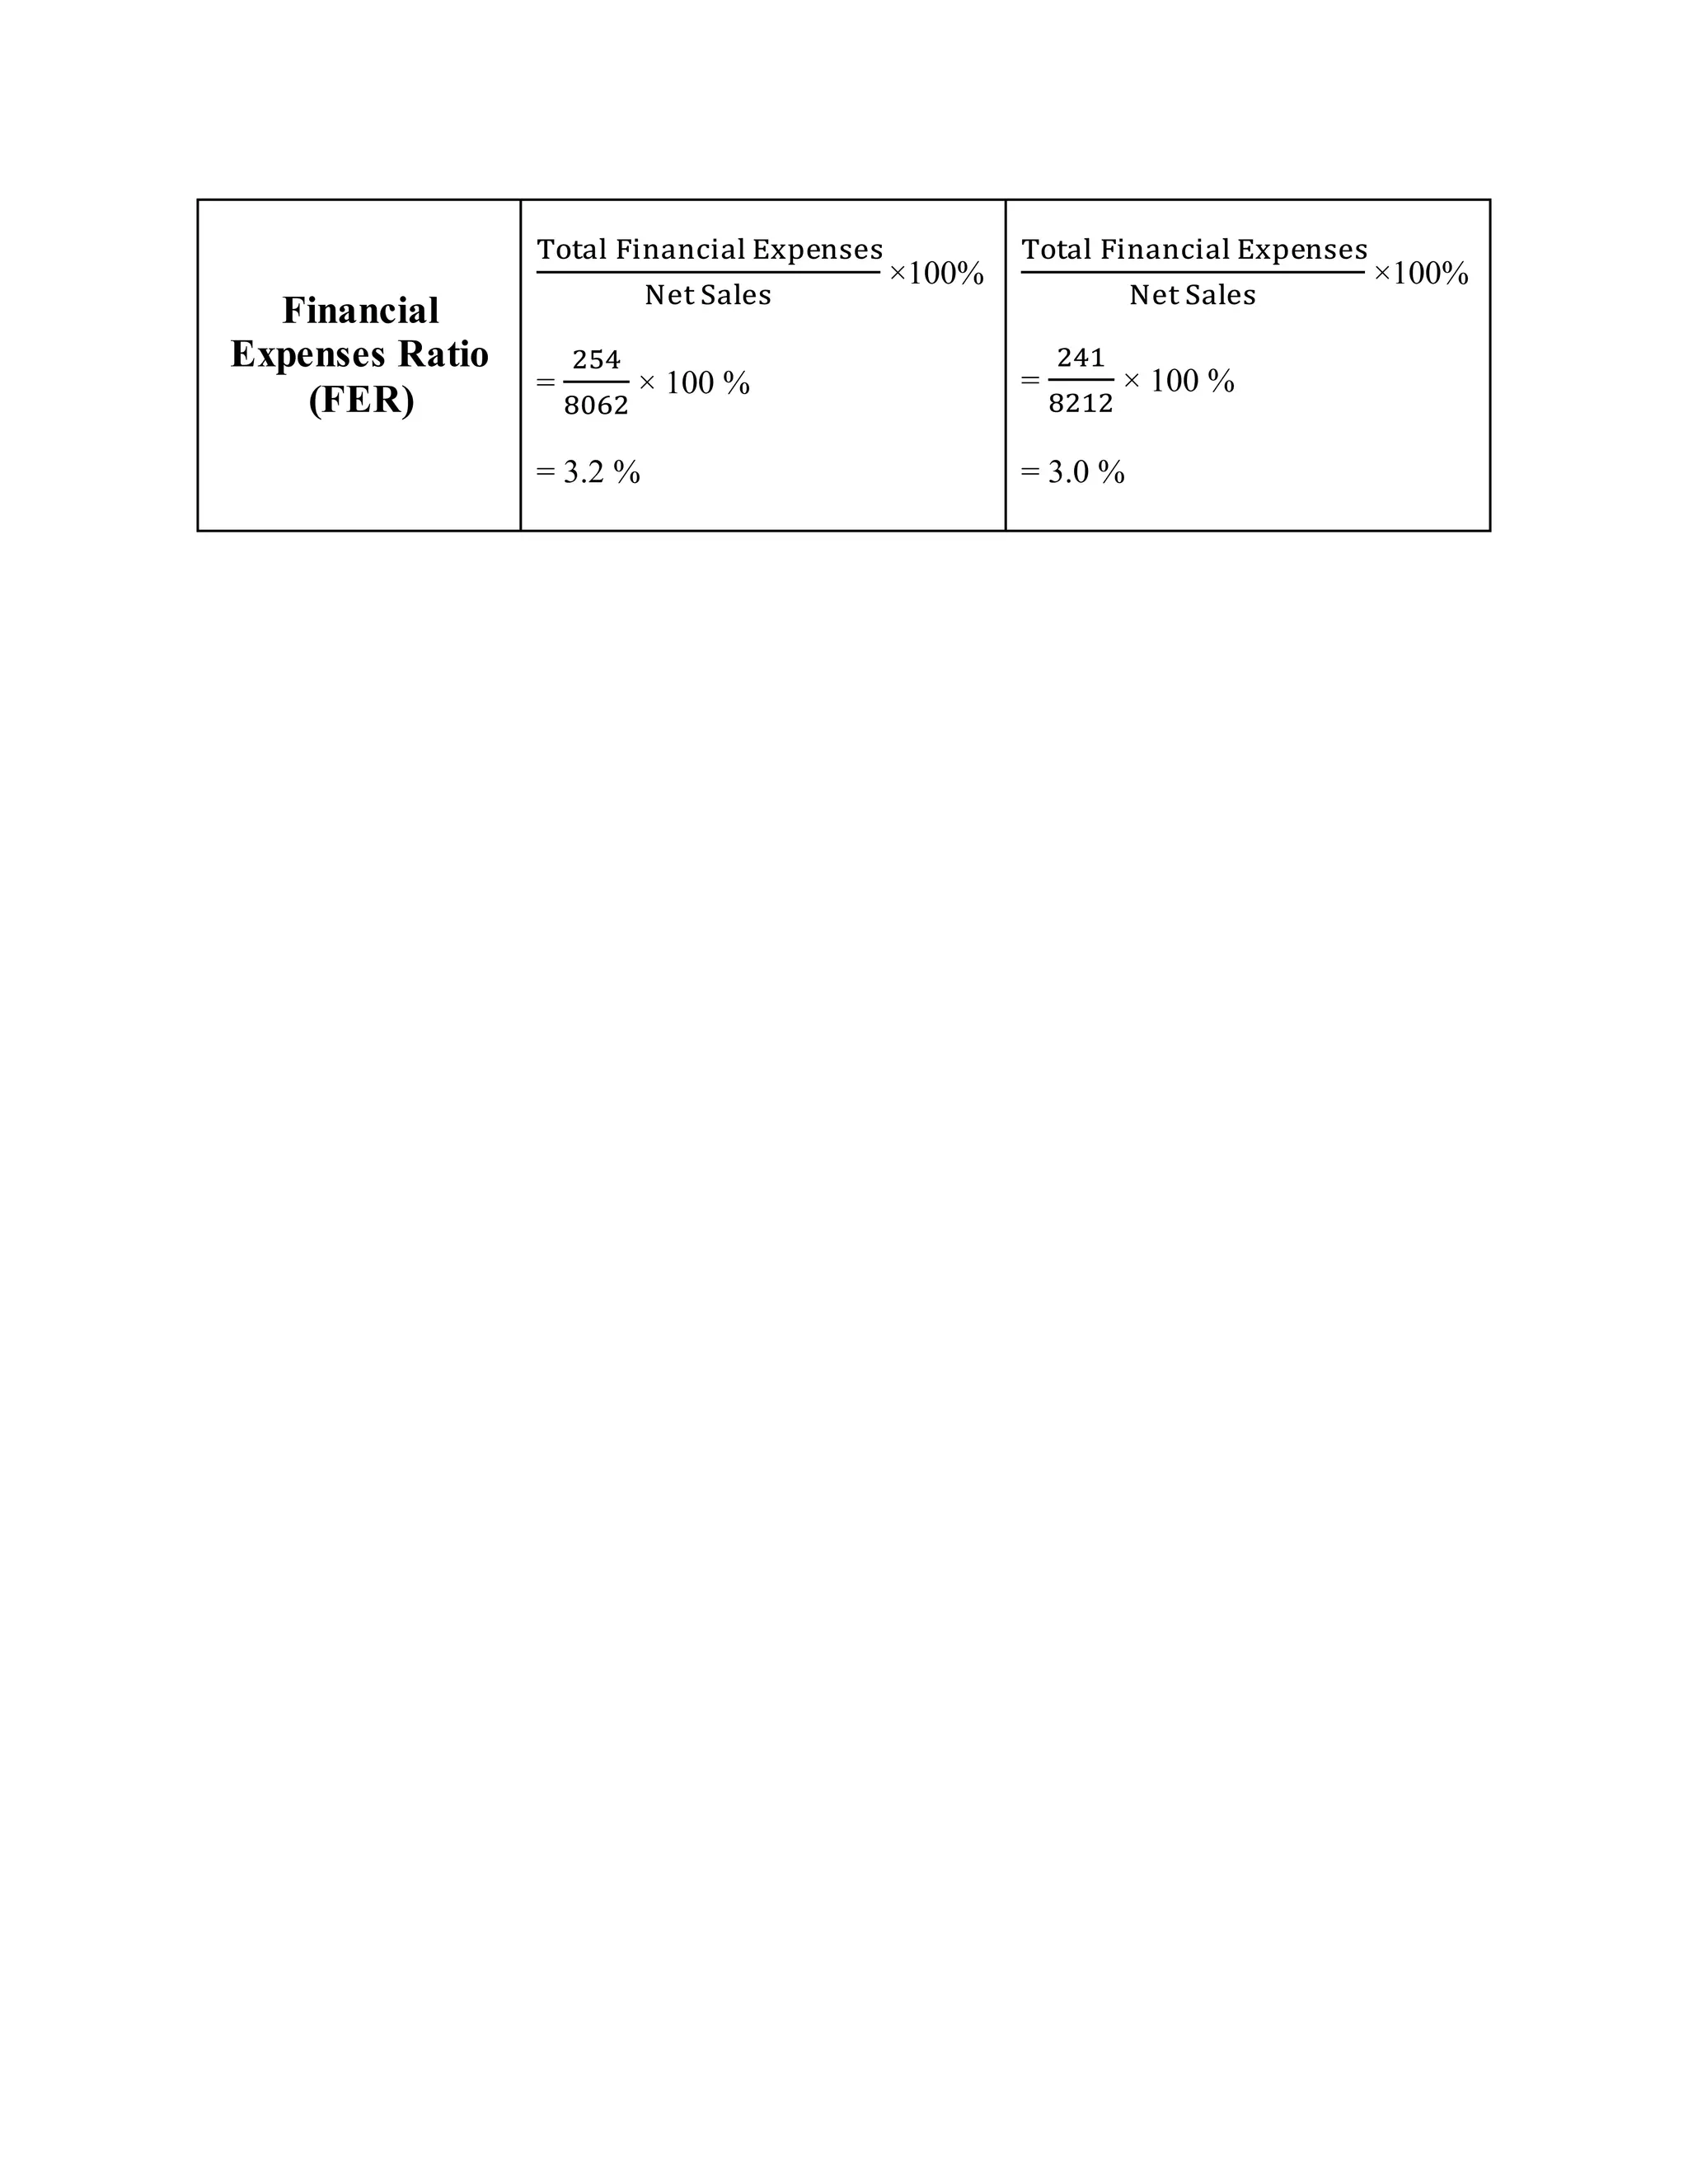
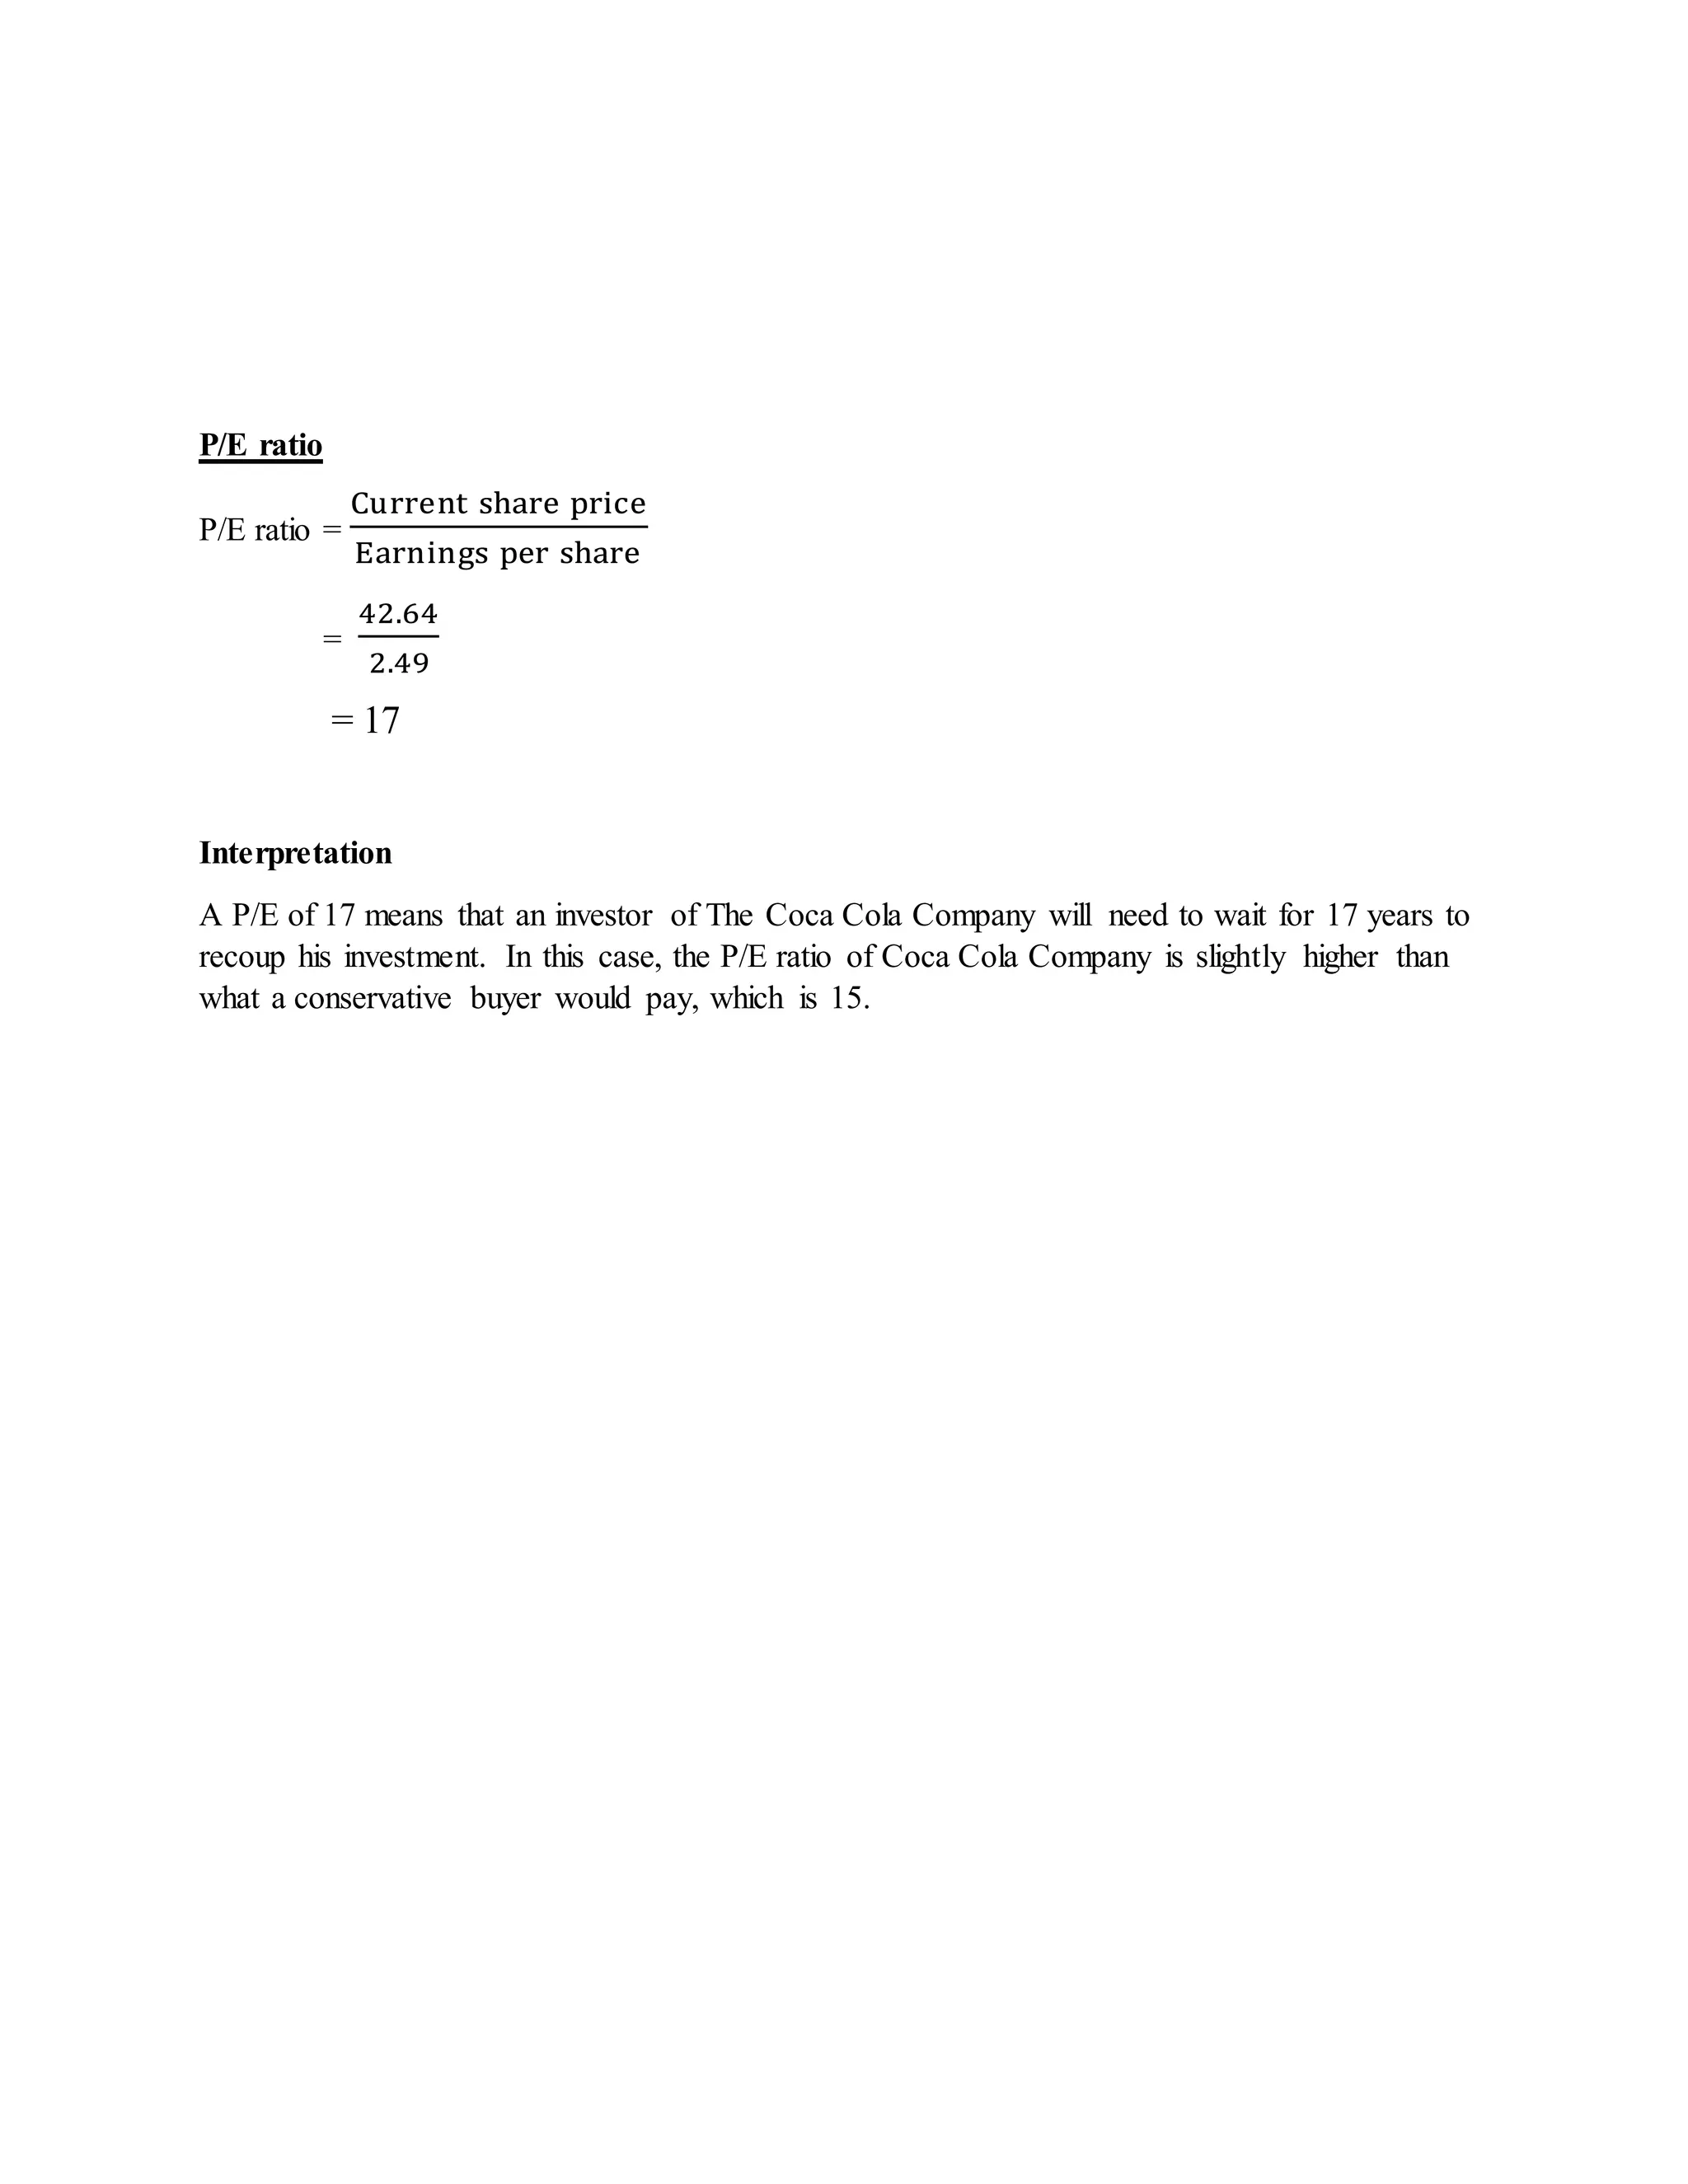
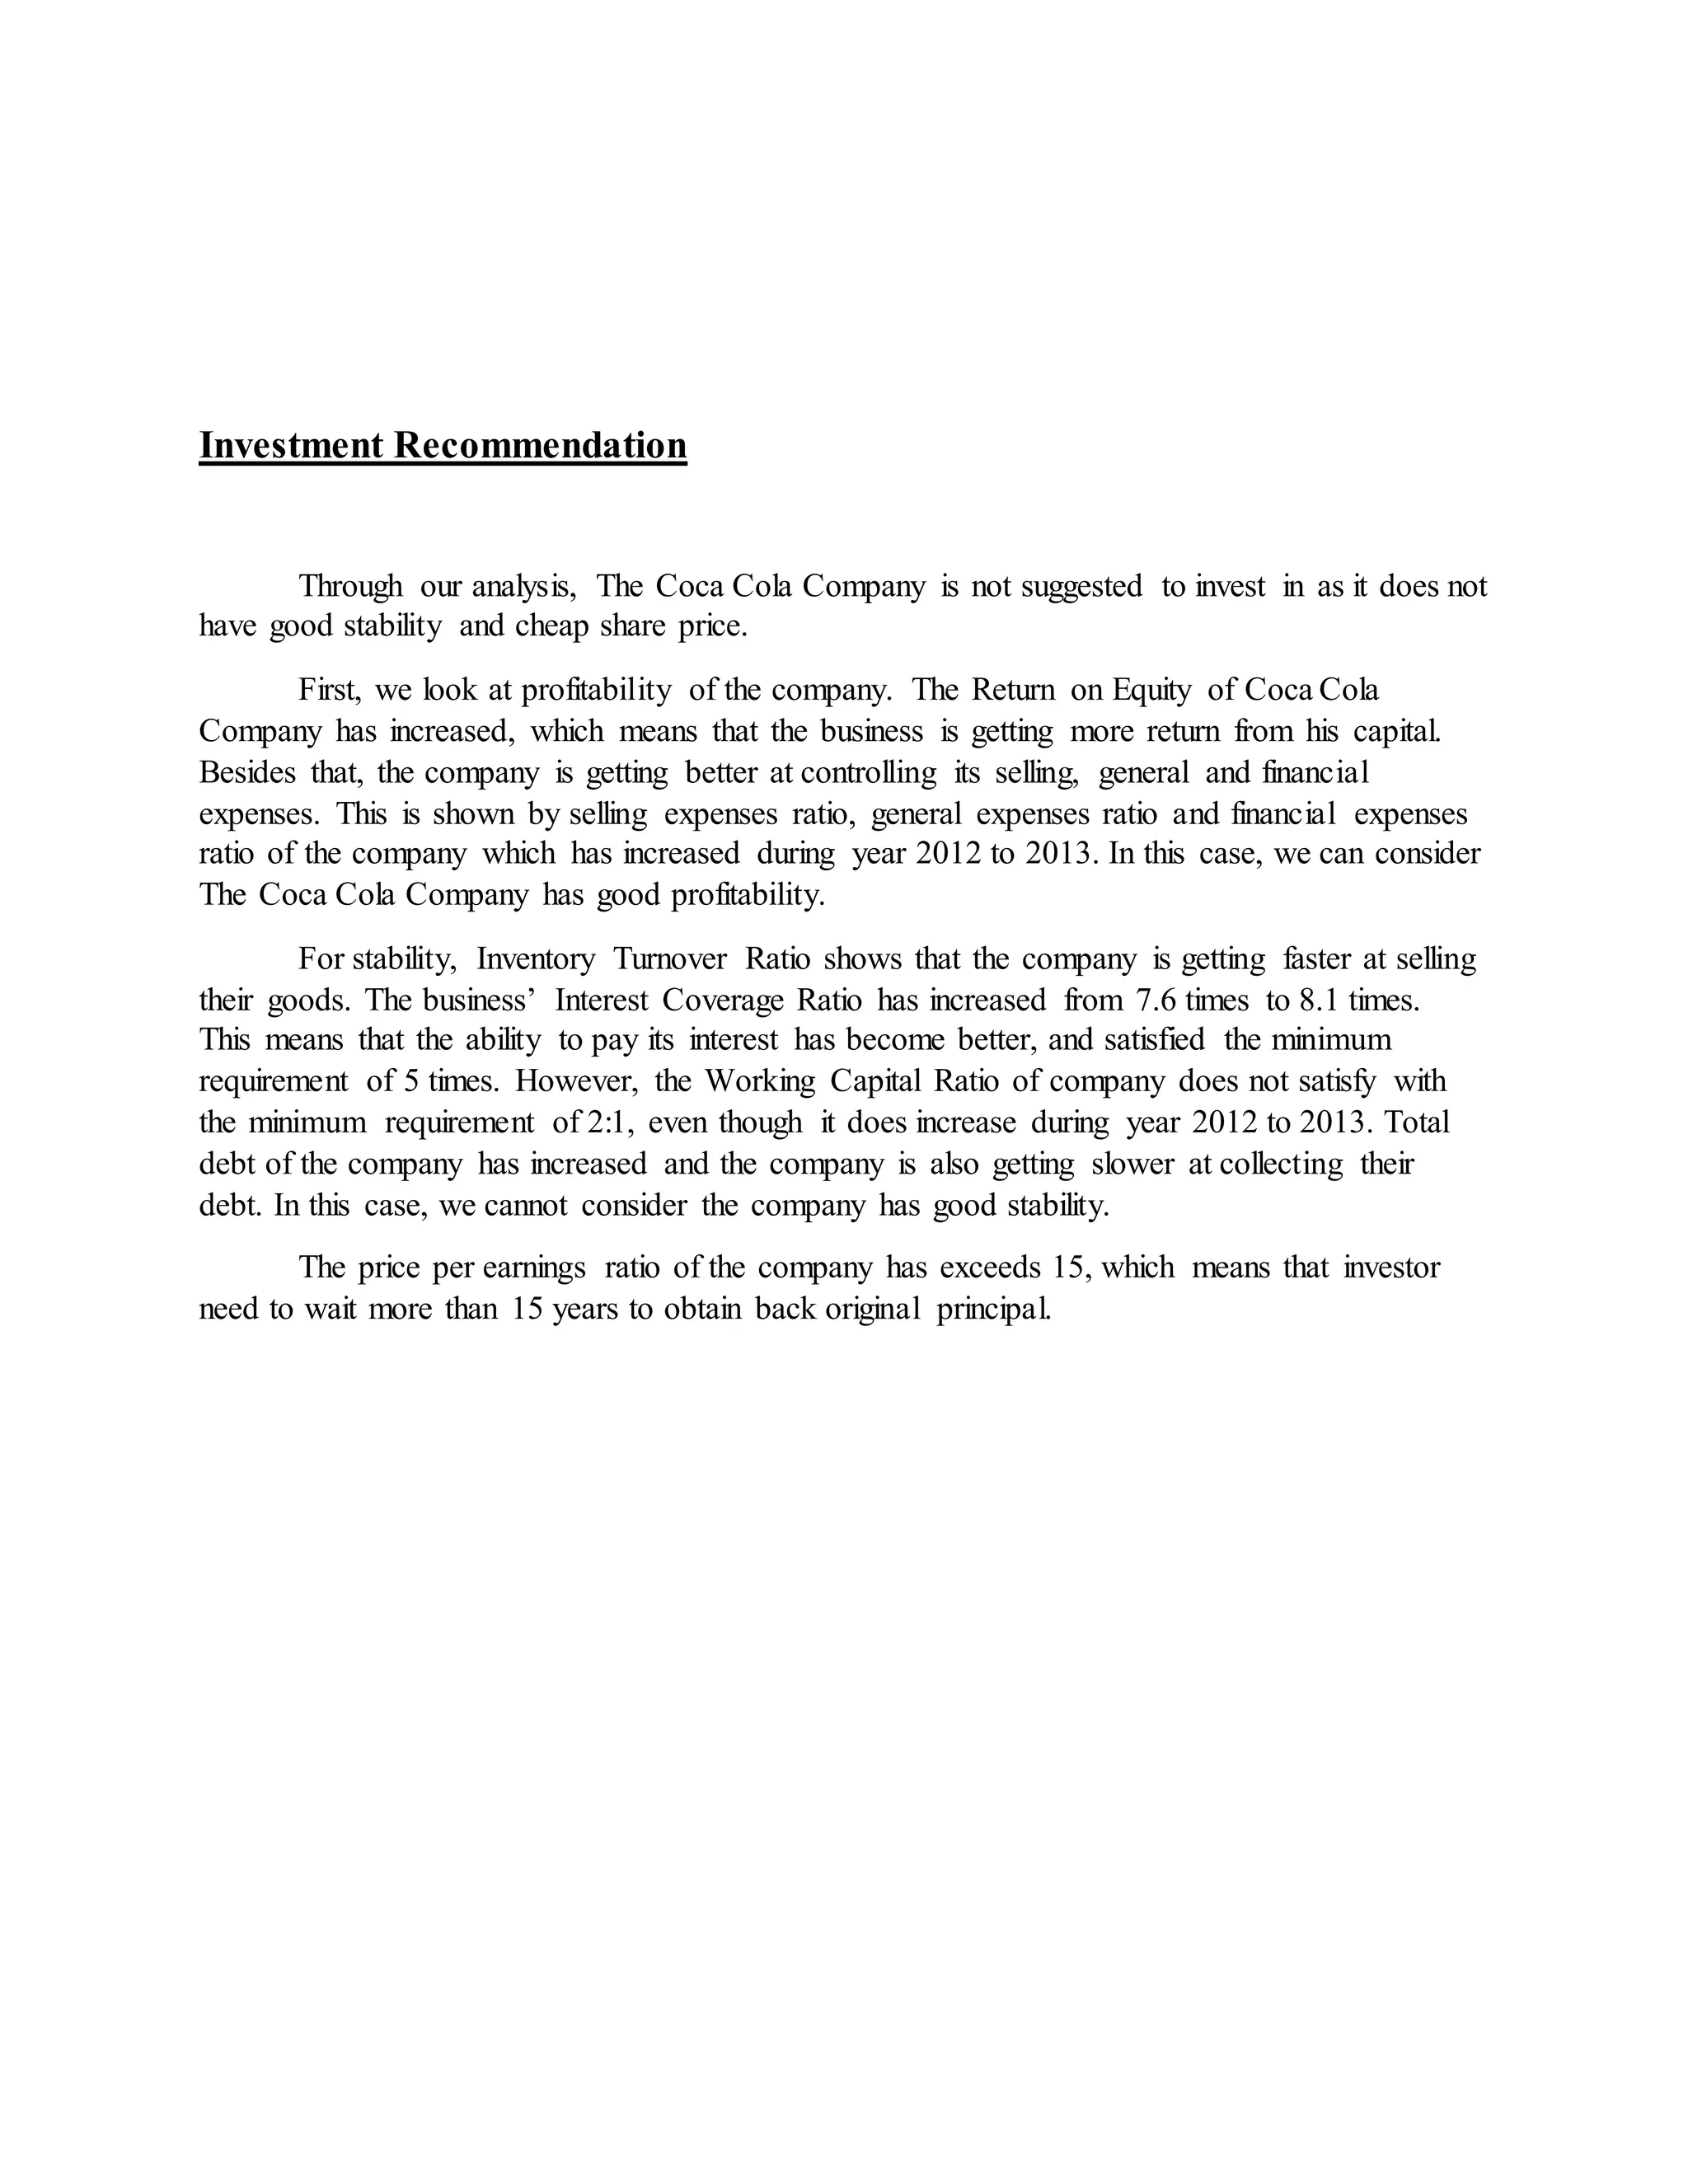
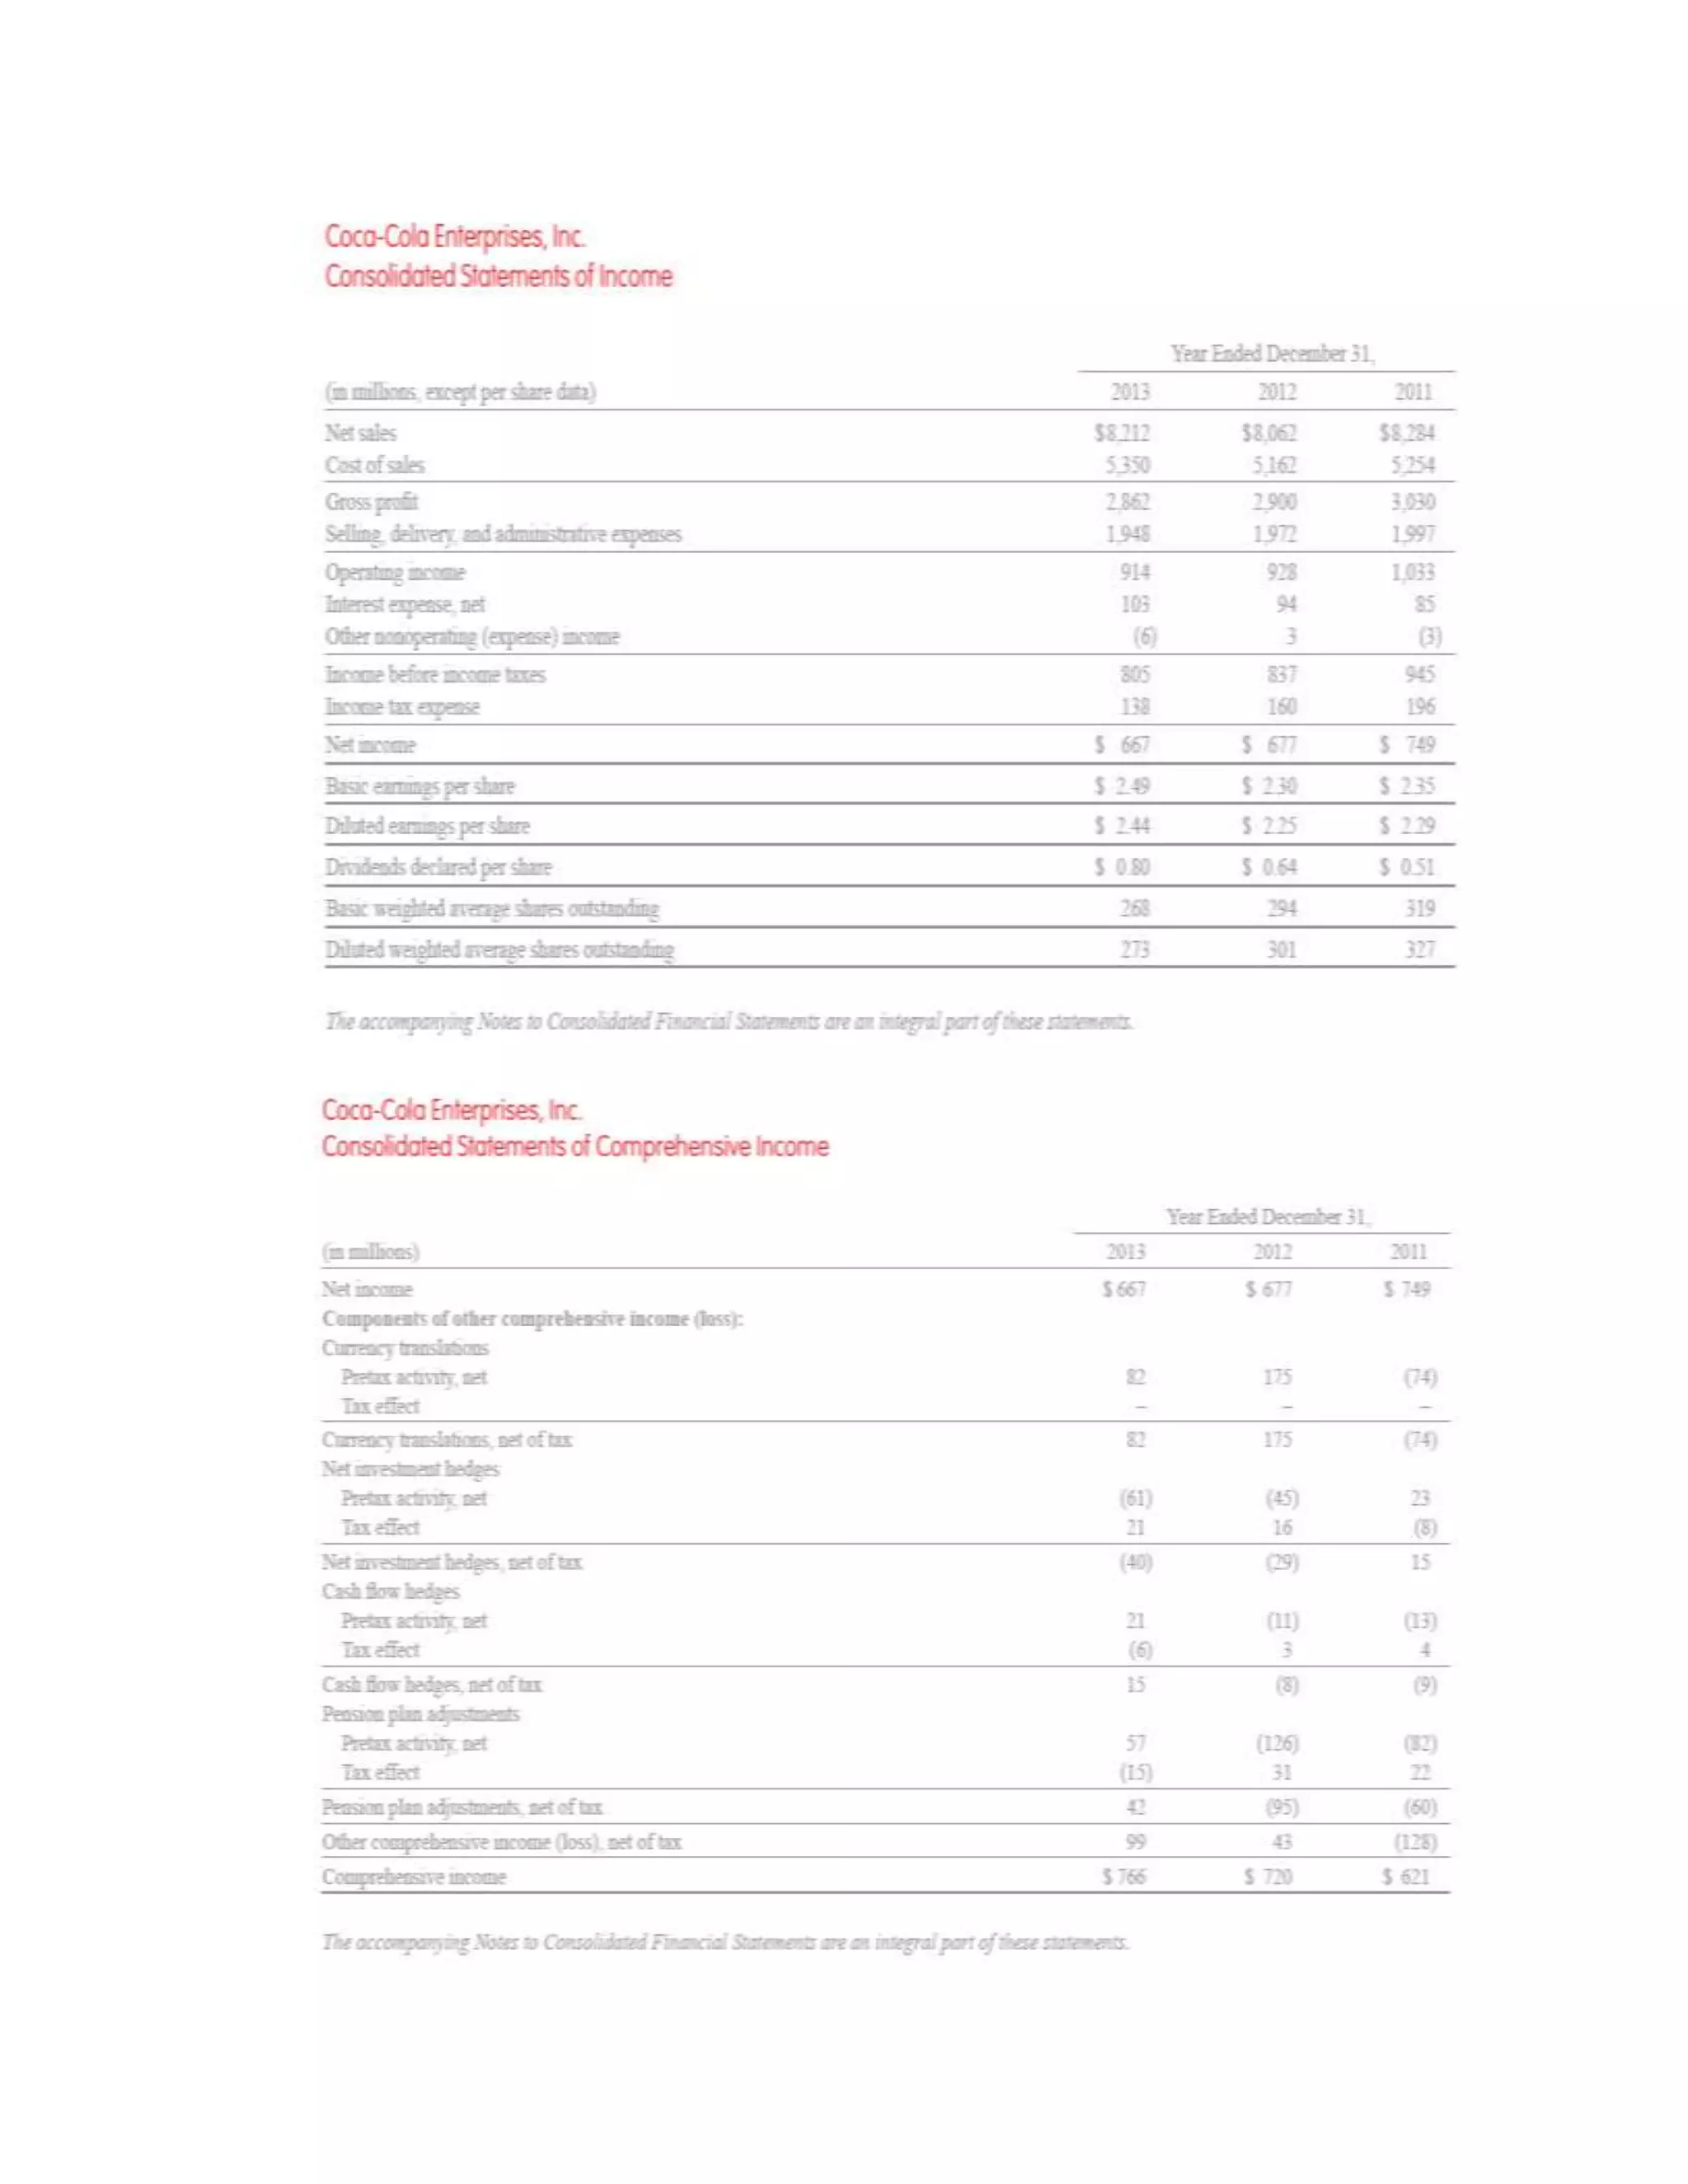
Group member: Tan Jia Yi 0319476
Siong Jia Yii 0318239
Chong Wai Loon 0319745
Subject: Basic Accounting [ACC30205]
Lecturer: Chang Jau Ho
Assignment: Financial Ratio Analysis
Brief background history of Coca Cola Company
Coca Cola was invented by pharmacist named John Pemberton who was once a morphine
addicted colonel in Civil War. At the end of the Civil War, he began to find a substitute for the
dangerous opiate and was also looking for a quick cure for headaches and tiredness. Therefore,
he formulated Coca Cola recipe at Pemberton’s Eagle Drug and Chemical House which
originally as a coca wine. He may have been inspired by the formidable success of Vin Mariani,
a European coca wine. He registered his French wine coca nerve tonic in 1885 and first sales
were at Jacob’s pharmacy in Atlanta, Georgia on 1886. It was initially sold as a patient medicine
that can cure many diseases claimed by Pemberton at soda fountain which were popular in
United States at the time due to the belief that carbonated drinks were good for health.
In 1888, there are three versions of coca cola sold by three different businesses on the
market after a co-partnership had been formed between Pemberton and four Atlanta business
men who named J.C. Mayfield, A.O. Murphey, C.O. Mullahy and E.H. Bloodworth without any
signed document. Asa Candler gave a verbal statement asserted under testimony that he had
acquired a stake in Pemberton’s company on 1887 but Pemberton declared that the name “Coca
Cola” belonged to his son, Charley and other two manufactures could continue to use the same
formula.
By 1889, the formula and brand bought by Asa Chandler who set out to incorporate a
second Coca Cola company as the current corporation in 1892. When Dr. John Pemberton
suddenly died on August 16, 1888, Asa Candler now sought to move swiftly forward to attain his
vision of taking full control of the whole Coca-Cola operation. The company began
manufacturing its famous bottle in 1916, which remains signature shape of Coca Cola today.
Recent Development
Recently, The Coca Cola Company has signed agreements with a few companies such as
Monster Beverage Corp and Green Mountain Coffee Roasters for long-term strategic
partnership. The Coca Cola Company will cooperate with these companies for the next few
years. Besides that, The Coca Cola Company has also upping its planned investment in Africa.
Between year 2010 and 2020, the company now expect to invest a total of $17 billion.
Last summer in year 2014, the company held a “Share a Coke” campaign. “Share a
Coke” is touring the nation with more than 500 stops where people can customize Coca-
Cola mini cans for themselves and a second mini can for someone special. In November, 2014,
the company releases new beverage, Coca-Cola Life. It is The Coca-Cola Company’s first
reduced-calorie beverage, sweetened with cane sugar which has 35 percent fewer calories than
other leading colas.
Over the years, The Coca Cola Company had total revenue of $ 46.854 billion, total
operating income of $ 10.228 billion, net income of $ 8.584 billion, total assets of $ 90.055
billion, and 130,600 of employees.
Stability Ratios 2012 2013
Return on Equity
(ROE)
Net Profit
Average Owner′s Equity
× 100 %
=
677
2796
× 100 %
= 24.2 %
Net Profit
Average Owner′s Equity
×100 %
=
667
2486.5
× 100 %
= 26.8 %
Net Profit
Margin
(NPM)
Net Profit
Net Sales
× 100 %
=
677
8062
× 100 %
= 8.4 %
Net Profit
Net Sales
× 100 %
=
667
8212
× 100 %
= 8.1 %
Gross Profit
Margin
(GPM)
Gross Profit
Net Sales
× 100 %
=
2900
8062
× 100 %
= 35.9 %
Gross Profit
Net Sales
× 100 %
=
2862
8212
× 100 %
= 34.8 %
Selling Expenses
Ratio
(SER)
Total Selling Expenses
Net Sales
× 100 %
=
986
8062
× 100 %
= 12.2 %
Total Selling Expenses
Net Sales
× 100 %
=
974
8212
× 100 %
= 11.9 %
General
Expenses Ratio
(GER)
Total General Expenses
Net Sales
× 100 %
=
986
8062
× 100 %
= 12.2 %
Total General Expenses
Net Sales
× 100 %
=
974
8212
× 100 %
= 11.9 %
Financial
Expenses Ratio
(FER)
Total Financial Expenses
Net Sales
×100%
=
254
8062
× 100 %
= 3.2 %
Total Financial Expenses
Net Sales
×100%
=
241
8212
× 100 %
= 3.0 %
ProfitabilityRatiosInterpretation
1) Return on Equity (ROE)
During the year 2012 to 2013, the business’ Return on Equity increased from 24.2% to
26.8%. This means that the business is getting more return from his capital.
2) Net Profit Margin (NPM)
During the year 2012 to 2013, the business’ Net Profit Margin decreased from 8.4% to
8.1%. This means that the business is getting worse at controlling its expenses.
3) Gross Profit Margin (GPM)
During the year 2012 to 2013, the business’ Gross Profit Margin decreased from 35.9%
to 34.8%. This means that the business is getting worse at controlling its cost of goods
sold expenses.
4) Selling Expenses Ratio (SER)
During the year 2012 to 2013, the business’ Selling Expenses Ratio has decreased from
12.2% to 11.9%. This means that the business is getting better at controlling its selling
expenses.
5) General Expenses Ratio (GER)
During the year 2012 to 2013, the business’ General Expenses Ratio has decreased from
12.2% to 11.9%. This means that the business is getting better at controlling its general
expenses.
6) Financial Expenses Ratio (FER)
During the year 2012 to 2013, the business’ Financial Expenses Ratio has decreased from
3.2% to 3.0 %. This means that the business is getting better at controlling its financial
expenses.
Stability Ratios 2012 2013
Working Capital
Ratio (WCR)
Total Liabilities
Total Assets
=
2762
2579
=1.07:1
Total Liabilities
Total Assets
=
2568
2195
=1.17:1
Total Debt Ratio
(TDR)
Total Liabilities
Total Assets
× 100 %
=
6817
9510
× 100 %
= 71.7 %
Total Liabilities
Total Assets
× 100 %
=
7245
9525
× 100 %
= 76.1 %
Inventory
Turnover Ratio
(ITR)
365 days ÷
Cost Of Good Sold
Average Inventory
= 365 days ÷
5162
(
452+386
2
)
= 29.6 days
365 days ÷
Cost Of Good Sold
Average Inventory
= 365 days ÷
5350
(
386+403
2
)
= 26.9 days
Debtor Turnover
Ratio (DTR)
365 days ÷
Credit Sales
Average Debtors
= 365 days ÷
4031
(
1498+1451
2
)
= 66.8 days
365 days ÷
Credit Sales
Average Debtors
= 365 days ÷
4106
(
1604+1498
2
)
= 68.9 days
Interest Coverage
Ratio (ICR)
Interest Expense+Net Profit
Interest Expense
=
103+677
103
Interest Expense+Net Profit
Interest Expense
=
94+667
94
=7.6 times =8.1 times
StabilityRatiosInterpretation
1) Working Capital Ratio (WCR)
During the year 2012 to 2013, the business’ Working Capital Ratio has increased from
1.07:1 to 1.17:1. This means that business’ ability to pay its current liabilities is getting
better, even though it does not satisfy with the minimum requirement of 2:1.
2) Total Debt Ratio (TDR)
During the 2012-2013 period, the business’ Total Debt Ratio has increased from 71.7%
to 76.1%. This means that the business’ total debt has increased. In addition, the business
exceeds the maximum limit of 50%.
3) Inventory Turnover Ratio (ITR)
During the 2012-2013 period, the business’ Inventory Turnover Ratio has decreased from
29.6 days to 26.9 days. This means that the business is getting faster at selling their
goods.
4) Debtor Turnover Ratio (DTR)
During the 2012-2013 period, the business’ Debtor Turnover Ratio has increased from
66.8 days to 68.9 days. This means that the business is getting slower at collecting its
debt.
5) Interest Coverage Ratio (ICR)
During the 2012-2013 period, the business’ Interest Coverage Ratio has increased from
7.6 times to 8.1 times. This means that the ability to pay its interest has become better.
Furthermore, it satisfied the minimum requirement of 5 times for both year.
P/E ratio
P/E ratio =
Current share price
Earnings per share
=
42.64
2.49
= 17
Interpretation
A P/E of 17 means that an investor of The Coca Cola Company will need to wait for 17 years to
recoup his investment. In this case, the P/E ratio of Coca Cola Company is slightly higher than
what a conservative buyer would pay, which is 15.
Investment Recommendation
Through our analysis, The Coca Cola Company is not suggested to invest in as it does not
have good stability and cheap share price.
First, we look at profitability of the company. The Return on Equity of Coca Cola
Company has increased, which means that the business is getting more return from his capital.
Besides that, the company is getting better at controlling its selling, general and financial
expenses. This is shown by selling expenses ratio, general expenses ratio and financial expenses
ratio of the company which has increased during year 2012 to 2013. In this case, we can consider
The Coca Cola Company has good profitability.
For stability, Inventory Turnover Ratio shows that the company is getting faster at selling
their goods. The business’ Interest Coverage Ratio has increased from 7.6 times to 8.1 times.
This means that the ability to pay its interest has become better, and satisfied the minimum
requirement of 5 times. However, the Working Capital Ratio of company does not satisfy with
the minimum requirement of 2:1, even though it does increase during year 2012 to 2013. Total
debt of the company has increased and the company is also getting slower at collecting their
debt. In this case, we cannot consider the company has good stability.
The price per earnings ratio of the company has exceeds 15, which means that investor
need to wait more than 15 years to obtain back original principal.
References
Cantwell,V.N.(n.d.). TheHistory of Coca-Cola.RetrievedfromOpen-source SportsWebsite:
http://iml.jou.ufl.edu/projects/spring08/Cantwell/invention.html
Deutch4macys.(2011, February7). Brief Company History.RetrievedfromBlogspot:
http://deutch4macys.blogspot.com/2011/02/brief-history.html
Finance.(n.d.).RetrievedJanuary13,2015, from Yahoo:
http://finance.yahoo.com/q;_ylc=X1MDMjE0MjQ3ODk0OARfcgMyBGZyA3VoM19maW5hbmNlX
3dlYgRmcjIDc2EtZ3AEZ3ByaWQDBG5fZ3BzAzUEb3JpZ2luA2ZpbmFuY2UueWFob28uY29tBHBvcw
MxBHBxc3RyAwRxdWVyeQNLTywEc2FjAzEEc2FvAzE-?p=http%3A%2F%2Ffinance.yahoo.com%2
Fq%3Fs%3DKO%26ql%3D0&fr=
FinancialReports. (n.d.).RetrievedfromCoca-colaEnterprises:
http://ir.cokecce.com/phoenix.zhtml?c=117435&p=irol-reportsannual
Kent,M. (2014, August5). Opinion:Why Cokeis Upping itsPlanned Investmentsin Africa.Retrieved
fromCoca-colacompany:http://www.coca-colacompany.com/stories/why-coke-is-upping-our-
planned-investments-in-africa
Staff,U. (2014, August4). IS YOURNAMEON A COKE BOTTLE? RetrievedfromCoca-colaCompany:
http://www.coca-colacompany.com/coca-cola-unbottled/is-your-name-on-a-coke-bottle-find-
out-here
Thomson.(2014, February5). The Coca-Cola Co and Green Mountain CoffeeRoasters,Inc.enterinto
long-termglobalstrategicpartnership.RetrievedfromReuters:
http://www.reuters.com/finance/stocks/KO/key-developments/article/2916648
Thomson.(2014, August14). The Coca-Cola Co and MonsterBeverageCorp enterinto long-term
strategicpartnership.RetrievedfromReuters:http://www.reuters.com/finance/stocks/KO/key-
developments/article/3050678
Appendix
Acc
Acc
Acc
Acc
Acc

Acc

  • 1.
    Group member: TanJia Yi 0319476 Siong Jia Yii 0318239 Chong Wai Loon 0319745 Subject: Basic Accounting [ACC30205] Lecturer: Chang Jau Ho Assignment: Financial Ratio Analysis
  • 2.
    Brief background historyof Coca Cola Company Coca Cola was invented by pharmacist named John Pemberton who was once a morphine addicted colonel in Civil War. At the end of the Civil War, he began to find a substitute for the dangerous opiate and was also looking for a quick cure for headaches and tiredness. Therefore, he formulated Coca Cola recipe at Pemberton’s Eagle Drug and Chemical House which originally as a coca wine. He may have been inspired by the formidable success of Vin Mariani, a European coca wine. He registered his French wine coca nerve tonic in 1885 and first sales were at Jacob’s pharmacy in Atlanta, Georgia on 1886. It was initially sold as a patient medicine that can cure many diseases claimed by Pemberton at soda fountain which were popular in United States at the time due to the belief that carbonated drinks were good for health. In 1888, there are three versions of coca cola sold by three different businesses on the market after a co-partnership had been formed between Pemberton and four Atlanta business men who named J.C. Mayfield, A.O. Murphey, C.O. Mullahy and E.H. Bloodworth without any signed document. Asa Candler gave a verbal statement asserted under testimony that he had acquired a stake in Pemberton’s company on 1887 but Pemberton declared that the name “Coca Cola” belonged to his son, Charley and other two manufactures could continue to use the same formula. By 1889, the formula and brand bought by Asa Chandler who set out to incorporate a second Coca Cola company as the current corporation in 1892. When Dr. John Pemberton suddenly died on August 16, 1888, Asa Candler now sought to move swiftly forward to attain his vision of taking full control of the whole Coca-Cola operation. The company began manufacturing its famous bottle in 1916, which remains signature shape of Coca Cola today.
  • 3.
    Recent Development Recently, TheCoca Cola Company has signed agreements with a few companies such as Monster Beverage Corp and Green Mountain Coffee Roasters for long-term strategic partnership. The Coca Cola Company will cooperate with these companies for the next few years. Besides that, The Coca Cola Company has also upping its planned investment in Africa. Between year 2010 and 2020, the company now expect to invest a total of $17 billion. Last summer in year 2014, the company held a “Share a Coke” campaign. “Share a Coke” is touring the nation with more than 500 stops where people can customize Coca- Cola mini cans for themselves and a second mini can for someone special. In November, 2014, the company releases new beverage, Coca-Cola Life. It is The Coca-Cola Company’s first reduced-calorie beverage, sweetened with cane sugar which has 35 percent fewer calories than other leading colas. Over the years, The Coca Cola Company had total revenue of $ 46.854 billion, total operating income of $ 10.228 billion, net income of $ 8.584 billion, total assets of $ 90.055 billion, and 130,600 of employees.
  • 4.
    Stability Ratios 20122013 Return on Equity (ROE) Net Profit Average Owner′s Equity × 100 % = 677 2796 × 100 % = 24.2 % Net Profit Average Owner′s Equity ×100 % = 667 2486.5 × 100 % = 26.8 % Net Profit Margin (NPM) Net Profit Net Sales × 100 % = 677 8062 × 100 % = 8.4 % Net Profit Net Sales × 100 % = 667 8212 × 100 % = 8.1 % Gross Profit Margin (GPM) Gross Profit Net Sales × 100 % = 2900 8062 × 100 % = 35.9 % Gross Profit Net Sales × 100 % = 2862 8212 × 100 % = 34.8 % Selling Expenses Ratio (SER) Total Selling Expenses Net Sales × 100 % = 986 8062 × 100 % = 12.2 % Total Selling Expenses Net Sales × 100 % = 974 8212 × 100 % = 11.9 % General Expenses Ratio (GER) Total General Expenses Net Sales × 100 % = 986 8062 × 100 % = 12.2 % Total General Expenses Net Sales × 100 % = 974 8212 × 100 % = 11.9 %
  • 5.
    Financial Expenses Ratio (FER) Total FinancialExpenses Net Sales ×100% = 254 8062 × 100 % = 3.2 % Total Financial Expenses Net Sales ×100% = 241 8212 × 100 % = 3.0 %
  • 6.
    ProfitabilityRatiosInterpretation 1) Return onEquity (ROE) During the year 2012 to 2013, the business’ Return on Equity increased from 24.2% to 26.8%. This means that the business is getting more return from his capital. 2) Net Profit Margin (NPM) During the year 2012 to 2013, the business’ Net Profit Margin decreased from 8.4% to 8.1%. This means that the business is getting worse at controlling its expenses. 3) Gross Profit Margin (GPM) During the year 2012 to 2013, the business’ Gross Profit Margin decreased from 35.9% to 34.8%. This means that the business is getting worse at controlling its cost of goods sold expenses. 4) Selling Expenses Ratio (SER) During the year 2012 to 2013, the business’ Selling Expenses Ratio has decreased from 12.2% to 11.9%. This means that the business is getting better at controlling its selling expenses. 5) General Expenses Ratio (GER) During the year 2012 to 2013, the business’ General Expenses Ratio has decreased from 12.2% to 11.9%. This means that the business is getting better at controlling its general expenses. 6) Financial Expenses Ratio (FER) During the year 2012 to 2013, the business’ Financial Expenses Ratio has decreased from 3.2% to 3.0 %. This means that the business is getting better at controlling its financial expenses.
  • 7.
    Stability Ratios 20122013 Working Capital Ratio (WCR) Total Liabilities Total Assets = 2762 2579 =1.07:1 Total Liabilities Total Assets = 2568 2195 =1.17:1 Total Debt Ratio (TDR) Total Liabilities Total Assets × 100 % = 6817 9510 × 100 % = 71.7 % Total Liabilities Total Assets × 100 % = 7245 9525 × 100 % = 76.1 % Inventory Turnover Ratio (ITR) 365 days ÷ Cost Of Good Sold Average Inventory = 365 days ÷ 5162 ( 452+386 2 ) = 29.6 days 365 days ÷ Cost Of Good Sold Average Inventory = 365 days ÷ 5350 ( 386+403 2 ) = 26.9 days Debtor Turnover Ratio (DTR) 365 days ÷ Credit Sales Average Debtors = 365 days ÷ 4031 ( 1498+1451 2 ) = 66.8 days 365 days ÷ Credit Sales Average Debtors = 365 days ÷ 4106 ( 1604+1498 2 ) = 68.9 days Interest Coverage Ratio (ICR) Interest Expense+Net Profit Interest Expense = 103+677 103 Interest Expense+Net Profit Interest Expense = 94+667 94
  • 8.
    =7.6 times =8.1times StabilityRatiosInterpretation 1) Working Capital Ratio (WCR) During the year 2012 to 2013, the business’ Working Capital Ratio has increased from 1.07:1 to 1.17:1. This means that business’ ability to pay its current liabilities is getting better, even though it does not satisfy with the minimum requirement of 2:1. 2) Total Debt Ratio (TDR) During the 2012-2013 period, the business’ Total Debt Ratio has increased from 71.7% to 76.1%. This means that the business’ total debt has increased. In addition, the business exceeds the maximum limit of 50%. 3) Inventory Turnover Ratio (ITR) During the 2012-2013 period, the business’ Inventory Turnover Ratio has decreased from 29.6 days to 26.9 days. This means that the business is getting faster at selling their goods. 4) Debtor Turnover Ratio (DTR) During the 2012-2013 period, the business’ Debtor Turnover Ratio has increased from 66.8 days to 68.9 days. This means that the business is getting slower at collecting its debt. 5) Interest Coverage Ratio (ICR) During the 2012-2013 period, the business’ Interest Coverage Ratio has increased from 7.6 times to 8.1 times. This means that the ability to pay its interest has become better. Furthermore, it satisfied the minimum requirement of 5 times for both year.
  • 9.
    P/E ratio P/E ratio= Current share price Earnings per share = 42.64 2.49 = 17 Interpretation A P/E of 17 means that an investor of The Coca Cola Company will need to wait for 17 years to recoup his investment. In this case, the P/E ratio of Coca Cola Company is slightly higher than what a conservative buyer would pay, which is 15.
  • 10.
    Investment Recommendation Through ouranalysis, The Coca Cola Company is not suggested to invest in as it does not have good stability and cheap share price. First, we look at profitability of the company. The Return on Equity of Coca Cola Company has increased, which means that the business is getting more return from his capital. Besides that, the company is getting better at controlling its selling, general and financial expenses. This is shown by selling expenses ratio, general expenses ratio and financial expenses ratio of the company which has increased during year 2012 to 2013. In this case, we can consider The Coca Cola Company has good profitability. For stability, Inventory Turnover Ratio shows that the company is getting faster at selling their goods. The business’ Interest Coverage Ratio has increased from 7.6 times to 8.1 times. This means that the ability to pay its interest has become better, and satisfied the minimum requirement of 5 times. However, the Working Capital Ratio of company does not satisfy with the minimum requirement of 2:1, even though it does increase during year 2012 to 2013. Total debt of the company has increased and the company is also getting slower at collecting their debt. In this case, we cannot consider the company has good stability. The price per earnings ratio of the company has exceeds 15, which means that investor need to wait more than 15 years to obtain back original principal.
  • 11.
    References Cantwell,V.N.(n.d.). TheHistory ofCoca-Cola.RetrievedfromOpen-source SportsWebsite: http://iml.jou.ufl.edu/projects/spring08/Cantwell/invention.html Deutch4macys.(2011, February7). Brief Company History.RetrievedfromBlogspot: http://deutch4macys.blogspot.com/2011/02/brief-history.html Finance.(n.d.).RetrievedJanuary13,2015, from Yahoo: http://finance.yahoo.com/q;_ylc=X1MDMjE0MjQ3ODk0OARfcgMyBGZyA3VoM19maW5hbmNlX 3dlYgRmcjIDc2EtZ3AEZ3ByaWQDBG5fZ3BzAzUEb3JpZ2luA2ZpbmFuY2UueWFob28uY29tBHBvcw MxBHBxc3RyAwRxdWVyeQNLTywEc2FjAzEEc2FvAzE-?p=http%3A%2F%2Ffinance.yahoo.com%2 Fq%3Fs%3DKO%26ql%3D0&fr= FinancialReports. (n.d.).RetrievedfromCoca-colaEnterprises: http://ir.cokecce.com/phoenix.zhtml?c=117435&p=irol-reportsannual Kent,M. (2014, August5). Opinion:Why Cokeis Upping itsPlanned Investmentsin Africa.Retrieved fromCoca-colacompany:http://www.coca-colacompany.com/stories/why-coke-is-upping-our- planned-investments-in-africa Staff,U. (2014, August4). IS YOURNAMEON A COKE BOTTLE? RetrievedfromCoca-colaCompany: http://www.coca-colacompany.com/coca-cola-unbottled/is-your-name-on-a-coke-bottle-find- out-here Thomson.(2014, February5). The Coca-Cola Co and Green Mountain CoffeeRoasters,Inc.enterinto long-termglobalstrategicpartnership.RetrievedfromReuters: http://www.reuters.com/finance/stocks/KO/key-developments/article/2916648 Thomson.(2014, August14). The Coca-Cola Co and MonsterBeverageCorp enterinto long-term strategicpartnership.RetrievedfromReuters:http://www.reuters.com/finance/stocks/KO/key- developments/article/3050678
  • 12.