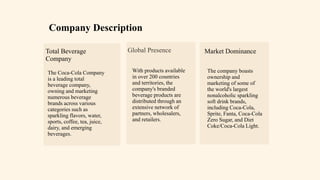
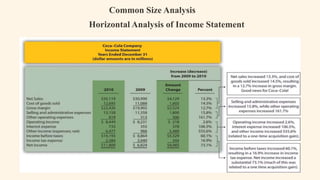
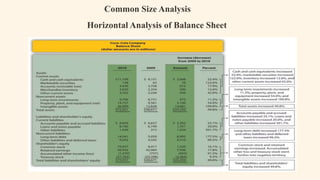
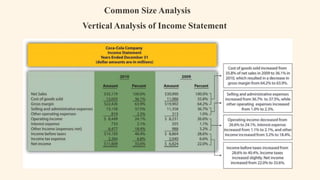
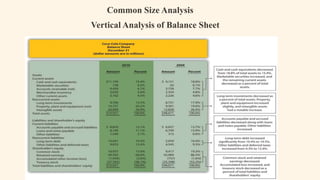
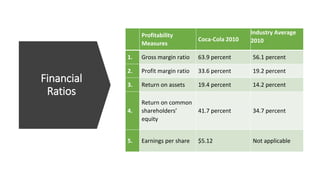
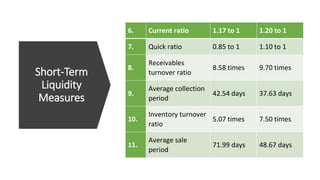
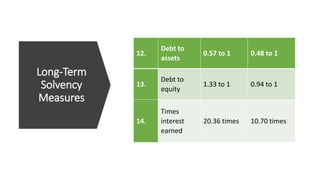
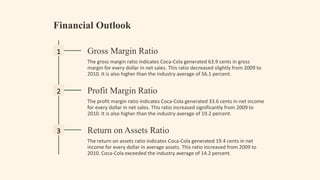
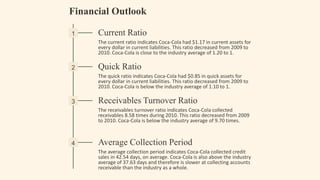
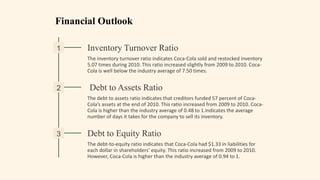
Financial Statement
Analysis of Coca-cola
Company
Saniya Imamuddin (20BBA007)
Analysis of Financial Statements
Assigned by: Dr. Ghazala Tunio
Company Description
Total Beverage
Company
The Coca-Cola Company
is a leading total
beverage company,
owning and marketing
numerous beverage
brands across various
categories such as
sparkling flavors, water,
sports, coffee, tea, juice,
dairy, and emerging
beverages.
Global Presence
With products available
in over 200 countries
and territories, the
company's branded
beverage products are
distributed through an
extensive network of
partners, wholesalers,
and retailers.
Market Dominance
The company boasts
ownership and
marketing of some of
the world's largest
nonalcoholic sparkling
soft drink brands,
including Coca-Cola,
Sprite, Fanta, Coca-Cola
Zero Sugar, and Diet
Coke/Coca-Cola Light.
Common Size Analysis
Horizontal Analysis of Income Statement
Common Size Analysis
Horizontal Analysis of Balance Sheet
Common Size Analysis
Vertical Analysis of Income Statement
Common Size Analysis
Vertical Analysis of Balance Sheet
Financial
Ratios
Profitability
Measures
Coca-Cola 2010
Industry Average
2010
1. Gross margin ratio 63.9 percent 56.1 percent
2. Profit margin ratio 33.6 percent 19.2 percent
3. Return on assets 19.4 percent 14.2 percent
4.
Return on common
shareholders’
equity
41.7 percent 34.7 percent
5. Earnings per share $5.12 Not applicable
Short-Term
Liquidity
Measures
6. Current ratio 1.17 to 1 1.20 to 1
7. Quick ratio 0.85 to 1 1.10 to 1
8.
Receivables
turnover ratio
8.58 times 9.70 times
9.
Average collection
period
42.54 days 37.63 days
10.
Inventory turnover
ratio
5.07 times 7.50 times
11.
Average sale
period
71.99 days 48.67 days
Long-Term
Solvency
Measures
12.
Debt to
assets
0.57 to 1 0.48 to 1
13.
Debt to
equity
1.33 to 1 0.94 to 1
14.
Times
interest
earned
20.36 times 10.70 times
Financial Outlook
1 Gross Margin Ratio
The gross margin ratio indicates Coca-Cola generated 63.9 cents in gross
margin for every dollar in net sales. This ratio decreased slightly from 2009 to
2010. It is also higher than the industry average of 56.1 percent.
2 Profit Margin Ratio
The profit margin ratio indicates Coca-Cola generated 33.6 cents in net income
for every dollar in net sales. This ratio increased significantly from 2009 to
2010. It is also higher than the industry average of 19.2 percent.
3 Return on Assets Ratio
The return on assets ratio indicates Coca-Cola generated 19.4 cents in net
income for every dollar in average assets. This ratio increased from 2009 to
2010. Coca-Cola exceeded the industry average of 14.2 percent.
Financial Outlook
1 Current Ratio
The current ratio indicates Coca-Cola had $1.17 in current assets for
every dollar in current liabilities. This ratio decreased from 2009 to
2010. Coca-Cola is close to the industry average of 1.20 to 1.
2 Quick Ratio
The quick ratio indicates Coca-Cola had $0.85 in quick assets for
every dollar in current liabilities. This ratio decreased from 2009 to
2010. Coca-Cola is below the industry average of 1.10 to 1.
3 Receivables Turnover Ratio
The receivables turnover ratio indicates Coca-Cola collected
receivables 8.58 times during 2010. This ratio decreased from 2009
to 2010. Coca-Cola is below the industry average of 9.70 times.
4 Average Collection Period
The average collection period indicates Coca-Cola collected credit
sales in 42.54 days, on average. Coca-Cola is also above the industry
average of 37.63 days and therefore is slower at collecting accounts
receivable than the industry as a whole.
Financial Outlook
1 Inventory Turnover Ratio
The inventory turnover ratio indicates Coca-Cola sold and restocked inventory
5.07 times during 2010. This ratio increased slightly from 2009 to 2010. Coca-
Cola is well below the industry average of 7.50 times.
2 Debt to Assets Ratio
The debt to assets ratio indicates that creditors funded 57 percent of Coca-
Cola’s assets at the end of 2010. This ratio increased from 2009 to 2010. Coca-
Cola is higher than the industry average of 0.48 to 1.Indicates the average
number of days it takes for the company to sell its inventory.
3 Debt to Equity Ratio
The debt-to-equity ratio indicates that Coca-Cola had $1.33 in liabilities for
each dollar in shareholders’ equity. This ratio increased from 2009 to 2010.
However, Coca-Cola is higher than the industry average of 0.94 to 1.
Thank You!
The room is now open for
any queries and discussions.

Financial-Statement-Analysis-of-Coca-cola-Company.pptx

  • 1.
    Financial Statement Analysis ofCoca-cola Company Saniya Imamuddin (20BBA007) Analysis of Financial Statements Assigned by: Dr. Ghazala Tunio
  • 2.
    Company Description Total Beverage Company TheCoca-Cola Company is a leading total beverage company, owning and marketing numerous beverage brands across various categories such as sparkling flavors, water, sports, coffee, tea, juice, dairy, and emerging beverages. Global Presence With products available in over 200 countries and territories, the company's branded beverage products are distributed through an extensive network of partners, wholesalers, and retailers. Market Dominance The company boasts ownership and marketing of some of the world's largest nonalcoholic sparkling soft drink brands, including Coca-Cola, Sprite, Fanta, Coca-Cola Zero Sugar, and Diet Coke/Coca-Cola Light.
  • 3.
    Common Size Analysis HorizontalAnalysis of Income Statement
  • 4.
    Common Size Analysis HorizontalAnalysis of Balance Sheet
  • 5.
    Common Size Analysis VerticalAnalysis of Income Statement
  • 6.
    Common Size Analysis VerticalAnalysis of Balance Sheet
  • 7.
    Financial Ratios Profitability Measures Coca-Cola 2010 Industry Average 2010 1.Gross margin ratio 63.9 percent 56.1 percent 2. Profit margin ratio 33.6 percent 19.2 percent 3. Return on assets 19.4 percent 14.2 percent 4. Return on common shareholders’ equity 41.7 percent 34.7 percent 5. Earnings per share $5.12 Not applicable
  • 8.
    Short-Term Liquidity Measures 6. Current ratio1.17 to 1 1.20 to 1 7. Quick ratio 0.85 to 1 1.10 to 1 8. Receivables turnover ratio 8.58 times 9.70 times 9. Average collection period 42.54 days 37.63 days 10. Inventory turnover ratio 5.07 times 7.50 times 11. Average sale period 71.99 days 48.67 days
  • 9.
    Long-Term Solvency Measures 12. Debt to assets 0.57 to1 0.48 to 1 13. Debt to equity 1.33 to 1 0.94 to 1 14. Times interest earned 20.36 times 10.70 times
  • 10.
    Financial Outlook 1 GrossMargin Ratio The gross margin ratio indicates Coca-Cola generated 63.9 cents in gross margin for every dollar in net sales. This ratio decreased slightly from 2009 to 2010. It is also higher than the industry average of 56.1 percent. 2 Profit Margin Ratio The profit margin ratio indicates Coca-Cola generated 33.6 cents in net income for every dollar in net sales. This ratio increased significantly from 2009 to 2010. It is also higher than the industry average of 19.2 percent. 3 Return on Assets Ratio The return on assets ratio indicates Coca-Cola generated 19.4 cents in net income for every dollar in average assets. This ratio increased from 2009 to 2010. Coca-Cola exceeded the industry average of 14.2 percent.
  • 11.
    Financial Outlook 1 CurrentRatio The current ratio indicates Coca-Cola had $1.17 in current assets for every dollar in current liabilities. This ratio decreased from 2009 to 2010. Coca-Cola is close to the industry average of 1.20 to 1. 2 Quick Ratio The quick ratio indicates Coca-Cola had $0.85 in quick assets for every dollar in current liabilities. This ratio decreased from 2009 to 2010. Coca-Cola is below the industry average of 1.10 to 1. 3 Receivables Turnover Ratio The receivables turnover ratio indicates Coca-Cola collected receivables 8.58 times during 2010. This ratio decreased from 2009 to 2010. Coca-Cola is below the industry average of 9.70 times. 4 Average Collection Period The average collection period indicates Coca-Cola collected credit sales in 42.54 days, on average. Coca-Cola is also above the industry average of 37.63 days and therefore is slower at collecting accounts receivable than the industry as a whole.
  • 12.
    Financial Outlook 1 InventoryTurnover Ratio The inventory turnover ratio indicates Coca-Cola sold and restocked inventory 5.07 times during 2010. This ratio increased slightly from 2009 to 2010. Coca- Cola is well below the industry average of 7.50 times. 2 Debt to Assets Ratio The debt to assets ratio indicates that creditors funded 57 percent of Coca- Cola’s assets at the end of 2010. This ratio increased from 2009 to 2010. Coca- Cola is higher than the industry average of 0.48 to 1.Indicates the average number of days it takes for the company to sell its inventory. 3 Debt to Equity Ratio The debt-to-equity ratio indicates that Coca-Cola had $1.33 in liabilities for each dollar in shareholders’ equity. This ratio increased from 2009 to 2010. However, Coca-Cola is higher than the industry average of 0.94 to 1.
  • 13.
    Thank You! The roomis now open for any queries and discussions.