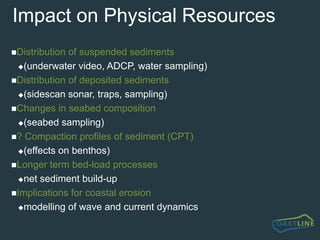
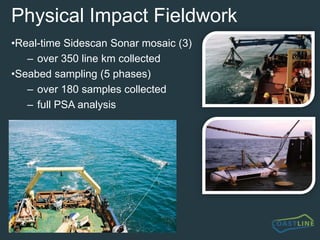
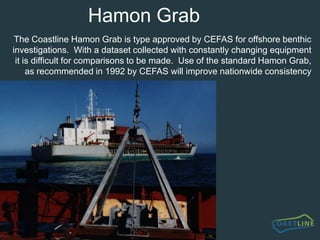
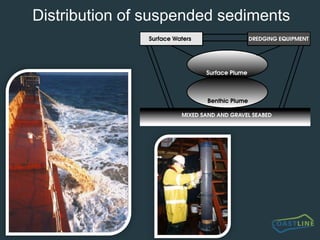
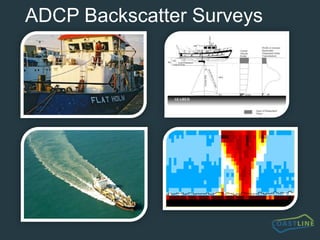
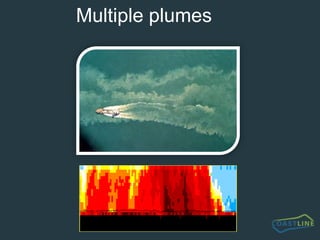
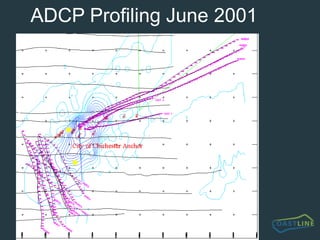
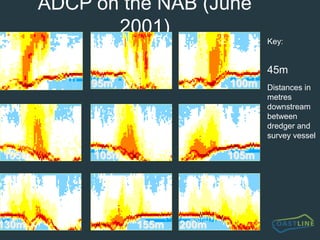
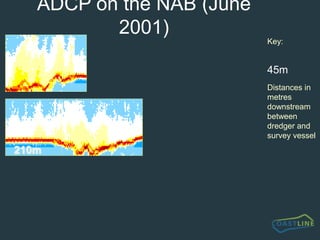
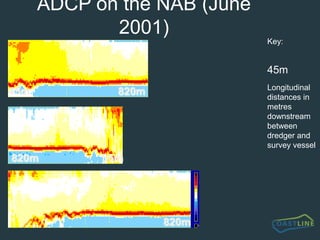
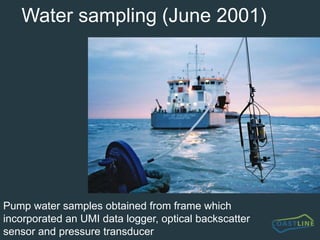
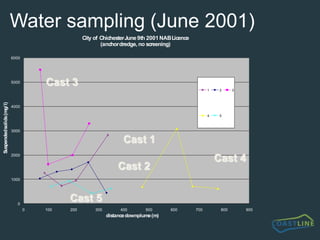
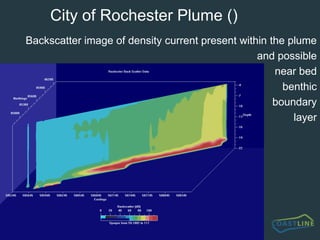
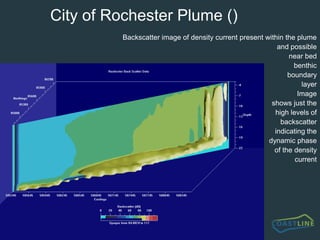
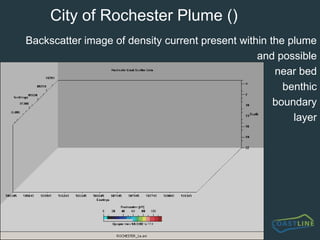
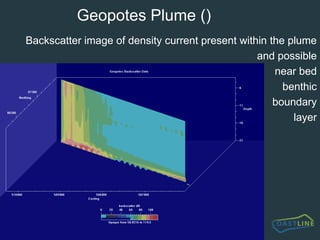
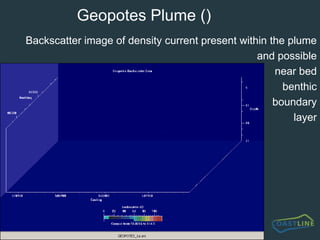
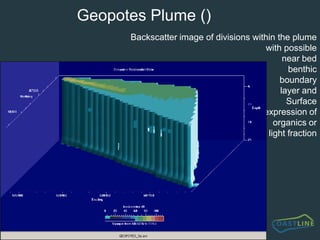
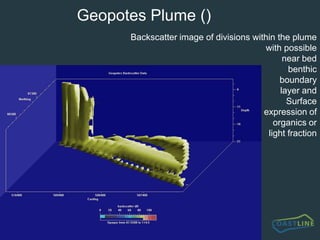
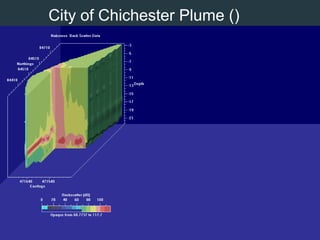
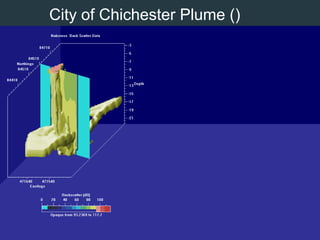
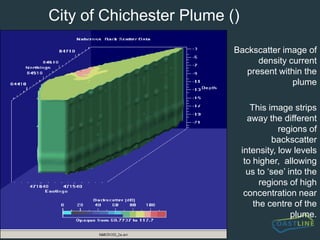
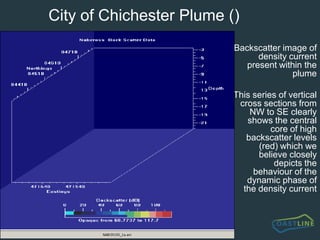
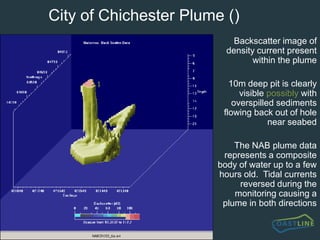
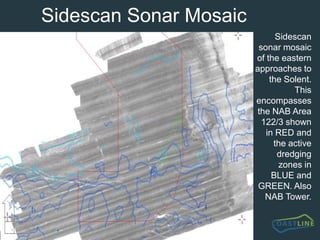
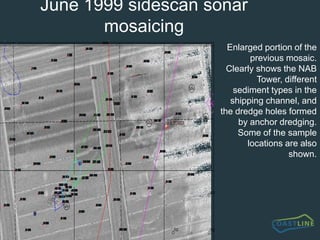
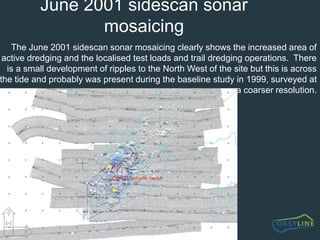
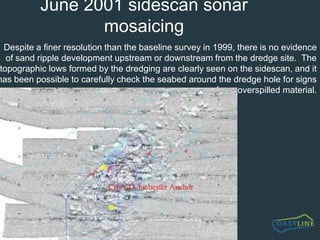
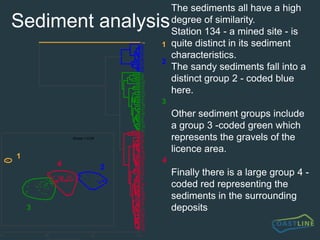
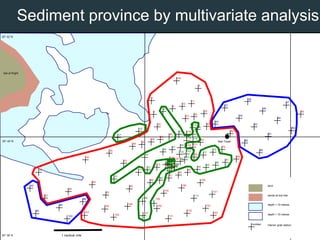
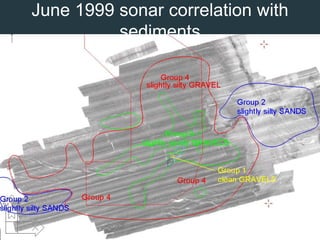
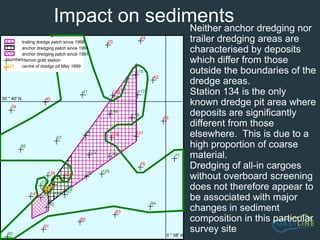
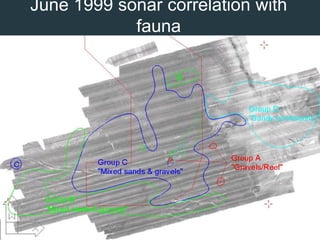
***********INTERMAR****************************************          INTERNATIONAL ACTIVITIES AND MARINE                                            MINERALS DIVISIONPhysical Impacts of Marine Aggregate MiningDavid R. Hitchcock Ph.D., M.R.I.C.S.Integrated Study on the Impact of Marine Aggregates Mining on the Physical and Biological Resources on the Seabed
OverviewThis presentation reviews the work carried out forthe Minerals Management Service over the past threeyears under contract 1435-01-99-CT 30980Principal Contractor is Coastline Surveys Limited, aUK based survey contractor and dredging researchConsultancyBiological and statistical analysis has been carried outby Marine Ecological Surveys Limited, also based inthe UK, specialising in benthic identification,ecological assessments and impact analysis
Coastline Surveys LtdCoastline operates the MV FlatHolm, a 22m research vessel equipped for full hydrographic, oceanographic, geophysical and sampling investigations and diving operationsCoastline undertake
Prospecting
Bathymetry
Sampling
Geophysics
SonarMarine aggregatedredging forconstruction andcoastal defencesTSHD Geopotes
TSHD ARCO Humber
What is aggregates dredging?Terrestrial sources of aggregate (sand and gravel) are increasingly limited in the UK as other pressures for land use increase.  Hence marine dredged aggregates are an increasingly important asset to the economy, currently providing around 21 percent of UK national aggregate needs.  Some 2500 mariners are employed on the UK vessels alone.  A total of 23 Million tonnes was removed from the seabed within the UK zone (out of a licensed 38 million tonnes)  7.3 million tonnes was exported to the near continent and a further 4 million tonnes used for beach replenishment.There are currently 72 licences in the UK with a further 30 applications in the pipeline.  Current licences cover only 0.12% of the UK jurisdiction seabed, with only 15% of that being actively dredged in any one year (BMAPA 2001).
UK StatisticsSummary Information (Crown Estate 2002:A total of 23.05 million tonnes of sand and gravel were dredged from Crown Estate licences in England & Wales during 2000.(1999 – 23.67 million tonnes dredged) The total area of seabed licensed in 2000 increased by 10%, to 1506km2. (1999 – 1371km2) The area of seabed dredged during 2000 reduced by 25%, to 179km2. (1999 – 238km2) Over 90% of dredging from licences in England & Wales took place from an area of 11.89km2. (1999 – 21.5km2) The reduction in the area of seabed dredged is primarily a result of improved resource and operational management by    the marine aggregates industry.
Project ComponentsKeyword INTEGRATEDImpact on Physical ResourcesImpact on Biological ResourcesAlthough types of impact are largely generic and similar the world over, scales of impact are generally site specific, certainly regionally specificIn UK impacts can be broadly categorised into geographical regions of extraction e.g. North Sea, English Channel, Bristol Channel
But Why?What are the underlying forcing functions?Extraction methodology?Geological conditions?Oceanographic conditions?Natural Disturbance?TSHD Arco Severn
How?In its most simple terms, the potential impacts on sea bed resources depend on the type of deposit on the sea bed and the amount of sorting which is required to obtain a cargo suitable for the needs of particular end-usersWhere deposits are of a high quality, a cargo can be obtained with little or no requirement for rejection of unwanted material.  However, where deposits are mixed sand and gravels (more normal), significant quantities - often amounting to up to 1.5 x the normal cargo load of 5,000 tonnes - may be returned to the sea bed through overboard screening chutesIt is reasonable to consider that the severity or significance of the impact will be largely determined by the comparative relationship between disturbances by the dredging activity and natural disturbances by storms etc i.e. consider whether shallow deposits are better adapted to short term recovery than deeper, less disturbed deposits?
Methods of MiningThe type of mining operation is dictated by a number of factors. Where the geological deposits are extremely restricted, mining is commonly from a dredger at anchor.  This leads to relatively deep dredge pits on the sea bed, and is consequently restricted in many areas for environmental reasons.A more efficient and widespread operation is for a trailer dredger to remove sea bed deposits whilst underway.  This leads to shallow dredge furrows of up to nominal 0.5 metre depth formed by each pass of the drag head, the worked area spread over a wider expanse of the seabed.  Sometimes these furrows will impinge on each other forming ‘sweet spots’ or areas of increased deepening.This form of dredging is sometimes carried out by several vessels operating close to one another in intensively worked production licence sites.One of the objectives of our work has been to compare the impact of anchor dredging with that of trailer dredging on benthic biological resources.
OperationsTrailer suction dredgerAnchor suction dredger
Intensive activity, Southern North Sea
Common featuresAll dredging operations result in a "plume" of dispersing material which may extend for up to 3 km downstream from the dredger on normal tidal streams (up to 2 knots) in UK waters.  The plume will comprise entrained air bubbles, sediments and importantly organic materialThe impact of the dispersing plume depends to a large extent on whether screening or ‘all-in’ loading is taking place, and for how long the dredge site has been exploitedThe geographical impact on the sea bed depends on whether the vessel is at anchor or trailing over a site of 1-3km long and whether screened material is rejected overboard in the vicinity of the dredge siteAnchor dredging results in pits on the sea bed which may be as much as 5-10 metres depth whilst only a few hundred metres in diameter, and which may take a significant time to infillTrailer dredging results in shallow furrows in the sea bed which may be rapidly infilled especially if large quantities of screened material are                     discharged from the dredger during the mining process
Impact on Biological ResourcesCommunity StructureDiversityAbundanceDetermination of biological footprintDispersion of Organic LoadZones of EnrichmentFOR MORE INFO...Marine Ecological Surveys ‘Biological Impacts of Marine Aggregate Dredging’ to follow…...
Impact on Physical ResourcesDistribution of suspended sediments
(underwater video, ADCP, water sampling)
Distribution of deposited sediments
(sidescan sonar, traps, sampling)
Changes in seabed composition
(seabed sampling)
? Compaction profiles of sediment (CPT)
(effects on benthos)
Longer term bed-load processes
net sediment build-up
Implications for coastal erosion
modelling of wave and current dynamicsNorth NAB Project Site – why? Area 122/3 is located to the east of the Isle of Wight, on the south coast of the UK in the English Channel.  Although the amount of aggregates removed from this area is quite low (150,000 tonnes per year), its is probably one of the most intensively dredged sites per unit area.The area had been exploited for almost 10 years prior to our survey, so any impact of intensive dredging at this site should be apparent in our surveysThe material is not significantly screened, but of the 11 licence areas on the south coast of UK, 9 involve non-screened cargoes.
North NABThe NAB area is therefore representative of the majority of the licence areas on the south coast of UK in contrast with those of the southern North Sea which are generally heavily screened  Importantly this was also more representative of the US situation (although maybe not now?)The North Nab site has a further advantage in that part of the area is mined by anchor dredging whilst another part is mined by trailer dredging.  This allows direct comparisons of the impact of the 2 types of dredging in adjacent areas.
LimitationsBecause cargoes are non-screened (all-in), our study shows the impact of the dredging process itself but does not address the potential impacts of discharge of relatively large quantities of screened material which occurs in many production licence areas, especially in the North Sea
LimitationsIn common with many other production licence sites, the impact of dredging at North Nab may interact with other activities that affect sea bed resources.  Other licences and a spoil dumping site are nearby, although not strictly downstream.  Far-field impacts are therefore increasingly likely to reflect other uses of the marine environment including spoils disposal as one moves away from the immediate site of aggregate dredgingDespite these limitations, the results of our survey for near-site impacts are unlikely to be significantly affected by activities outside the dredge site, and are probably applicable to other production licence areas where discharge of material by overboard screening is minimal
Physical Impact FieldworkReal-time Sidescan Sonar mosaic (3)over 350 line km collectedSeabed sampling (5 phases)over 180 samples collectedfull PSA analysis
Hamon GrabThe Coastline Hamon Grab is type approved by CEFAS for offshore benthic investigations.  With a dataset collected with constantly changing equipment it is difficult for comparisons to be made.  Use of the standard Hamon Grab, as recommended in 1992 by CEFAS will improve nationwide consistency
Distribution of suspended sediments
ADCP Backscatter Surveys
Multiple plumes
ADCP Profiling June 2001
ADCP on the NAB (June 2001)Key:Distances in metres downstream between dredger and survey vessel45m45m95m100m105m105m105m130m155m200m
ADCP on the NAB (June 2001)Key:Distances in metres downstream between dredger and survey vessel45m200m210m
ADCP on the NAB (June 2001)Key:Longitudinal distances in metres downstream between dredger and survey vessel45m45m820m820m35m25m820m
Water sampling (June 2001)Pump water samples obtained from frame which incorporated an UMI data logger, optical backscatter sensor and pressure transducer
Water sampling (June 2001)Cast 3Cast 1Cast 4Cast 2Cast 5
City of Rochester Plume ()Backscatter image of density current present within the plumeand possiblenear bedbenthicboundarylayer
City of Rochester Plume ()Backscatter image of density current present within the plumeand possiblenear bedbenthicboundarylayerImageshows just thehigh levels ofbackscatterindicating thedynamic phaseof the densitycurrent
City of Rochester Plume ()Backscatter image of density current present within the plumeand possiblenear bedbenthicboundarylayer
Geopotes Plume ()Backscatter image of density current present within the plumeand possiblenear bedbenthicboundarylayer
Geopotes Plume ()Backscatter image of divisions within the plumewith possiblenear bedbenthicboundarylayer andSurfaceexpression oforganics orlight fraction
City of Chichester
City of Chichester Plume ()Backscatter image of density current present within the plumeCut away of the core of the plume
City of Chichester Plume ()Backscatter image of density current present within the plumeSection across the higher concentrations of the plume , tidal excursion is to the NE (top right) and SW (bottom left)
City of Chichester Plume ()Backscatter image of density current present within the plumeThis image strips away the different regions of backscatter intensity, low levels to higher,  allowing us to ‘see’ into the regions of high concentration near the centre of the plume.
City of Chichester Plume ()Backscatter image of density current present within the plumeThis series of vertical cross sections from NW to SE clearly shows the central core of high backscatter levels (red) which we believe closely depicts the behaviour of the dynamic phase of the density current
City of Chichester Plume ()Backscatter image of density current present within the plume10m deep pit is clearly visible possibly with overspilled sediments flowing back out of hole near seabedThe NAB plume data represents a composite body of water up to a few hours old.  Tidal currents reversed during the monitoring causing a plume in both directions
Sidescan Sonar MosaicSidescan sonar mosaic of the eastern approaches to the Solent.  This encompasses the NAB Area 122/3 shown in RED and the active dredging zones in BLUE and GREEN. Also NAB Tower.
June 1999 sidescan sonar mosaicingEnlarged portion of the previous mosaic.  Clearly shows the NAB Tower, different sediment types in the shipping channel, and the dredge holes formed by anchor dredging.  Some of the sample locations are also shown.
June 2001 sidescan sonar mosaicingThe June 2001 sidescan sonar mosaicing clearly shows the increased area of active dredging and the localised test loads and trail dredging operations.  There is a small development of ripples to the North West of the site but this is across the tide and probably was present during the baseline study in 1999, surveyed at a coarser resolution.

Coastline

  • 1.
    ***********INTERMAR**************************************** INTERNATIONAL ACTIVITIES AND MARINE MINERALS DIVISIONPhysical Impacts of Marine Aggregate MiningDavid R. Hitchcock Ph.D., M.R.I.C.S.Integrated Study on the Impact of Marine Aggregates Mining on the Physical and Biological Resources on the Seabed
  • 2.
    OverviewThis presentation reviewsthe work carried out forthe Minerals Management Service over the past threeyears under contract 1435-01-99-CT 30980Principal Contractor is Coastline Surveys Limited, aUK based survey contractor and dredging researchConsultancyBiological and statistical analysis has been carried outby Marine Ecological Surveys Limited, also based inthe UK, specialising in benthic identification,ecological assessments and impact analysis
  • 3.
    Coastline Surveys LtdCoastlineoperates the MV FlatHolm, a 22m research vessel equipped for full hydrographic, oceanographic, geophysical and sampling investigations and diving operationsCoastline undertake
  • 4.
  • 5.
  • 6.
  • 7.
  • 8.
    SonarMarine aggregatedredging forconstructionandcoastal defencesTSHD Geopotes
  • 9.
  • 10.
    What is aggregatesdredging?Terrestrial sources of aggregate (sand and gravel) are increasingly limited in the UK as other pressures for land use increase. Hence marine dredged aggregates are an increasingly important asset to the economy, currently providing around 21 percent of UK national aggregate needs. Some 2500 mariners are employed on the UK vessels alone. A total of 23 Million tonnes was removed from the seabed within the UK zone (out of a licensed 38 million tonnes) 7.3 million tonnes was exported to the near continent and a further 4 million tonnes used for beach replenishment.There are currently 72 licences in the UK with a further 30 applications in the pipeline. Current licences cover only 0.12% of the UK jurisdiction seabed, with only 15% of that being actively dredged in any one year (BMAPA 2001).
  • 11.
    UK StatisticsSummary Information(Crown Estate 2002:A total of 23.05 million tonnes of sand and gravel were dredged from Crown Estate licences in England & Wales during 2000.(1999 – 23.67 million tonnes dredged) The total area of seabed licensed in 2000 increased by 10%, to 1506km2. (1999 – 1371km2) The area of seabed dredged during 2000 reduced by 25%, to 179km2. (1999 – 238km2) Over 90% of dredging from licences in England & Wales took place from an area of 11.89km2. (1999 – 21.5km2) The reduction in the area of seabed dredged is primarily a result of improved resource and operational management by the marine aggregates industry.
  • 12.
    Project ComponentsKeyword INTEGRATEDImpacton Physical ResourcesImpact on Biological ResourcesAlthough types of impact are largely generic and similar the world over, scales of impact are generally site specific, certainly regionally specificIn UK impacts can be broadly categorised into geographical regions of extraction e.g. North Sea, English Channel, Bristol Channel
  • 13.
    But Why?What arethe underlying forcing functions?Extraction methodology?Geological conditions?Oceanographic conditions?Natural Disturbance?TSHD Arco Severn
  • 14.
    How?In its mostsimple terms, the potential impacts on sea bed resources depend on the type of deposit on the sea bed and the amount of sorting which is required to obtain a cargo suitable for the needs of particular end-usersWhere deposits are of a high quality, a cargo can be obtained with little or no requirement for rejection of unwanted material. However, where deposits are mixed sand and gravels (more normal), significant quantities - often amounting to up to 1.5 x the normal cargo load of 5,000 tonnes - may be returned to the sea bed through overboard screening chutesIt is reasonable to consider that the severity or significance of the impact will be largely determined by the comparative relationship between disturbances by the dredging activity and natural disturbances by storms etc i.e. consider whether shallow deposits are better adapted to short term recovery than deeper, less disturbed deposits?
  • 15.
    Methods of MiningThetype of mining operation is dictated by a number of factors. Where the geological deposits are extremely restricted, mining is commonly from a dredger at anchor. This leads to relatively deep dredge pits on the sea bed, and is consequently restricted in many areas for environmental reasons.A more efficient and widespread operation is for a trailer dredger to remove sea bed deposits whilst underway. This leads to shallow dredge furrows of up to nominal 0.5 metre depth formed by each pass of the drag head, the worked area spread over a wider expanse of the seabed. Sometimes these furrows will impinge on each other forming ‘sweet spots’ or areas of increased deepening.This form of dredging is sometimes carried out by several vessels operating close to one another in intensively worked production licence sites.One of the objectives of our work has been to compare the impact of anchor dredging with that of trailer dredging on benthic biological resources.
  • 16.
  • 17.
  • 18.
    Common featuresAll dredgingoperations result in a "plume" of dispersing material which may extend for up to 3 km downstream from the dredger on normal tidal streams (up to 2 knots) in UK waters. The plume will comprise entrained air bubbles, sediments and importantly organic materialThe impact of the dispersing plume depends to a large extent on whether screening or ‘all-in’ loading is taking place, and for how long the dredge site has been exploitedThe geographical impact on the sea bed depends on whether the vessel is at anchor or trailing over a site of 1-3km long and whether screened material is rejected overboard in the vicinity of the dredge siteAnchor dredging results in pits on the sea bed which may be as much as 5-10 metres depth whilst only a few hundred metres in diameter, and which may take a significant time to infillTrailer dredging results in shallow furrows in the sea bed which may be rapidly infilled especially if large quantities of screened material are discharged from the dredger during the mining process
  • 19.
    Impact on BiologicalResourcesCommunity StructureDiversityAbundanceDetermination of biological footprintDispersion of Organic LoadZones of EnrichmentFOR MORE INFO...Marine Ecological Surveys ‘Biological Impacts of Marine Aggregate Dredging’ to follow…...
  • 20.
    Impact on PhysicalResourcesDistribution of suspended sediments
  • 21.
    (underwater video, ADCP,water sampling)
  • 22.
  • 23.
  • 24.
    Changes in seabedcomposition
  • 25.
  • 26.
    ? Compaction profilesof sediment (CPT)
  • 27.
  • 28.
  • 29.
  • 30.
  • 31.
    modelling of waveand current dynamicsNorth NAB Project Site – why? Area 122/3 is located to the east of the Isle of Wight, on the south coast of the UK in the English Channel. Although the amount of aggregates removed from this area is quite low (150,000 tonnes per year), its is probably one of the most intensively dredged sites per unit area.The area had been exploited for almost 10 years prior to our survey, so any impact of intensive dredging at this site should be apparent in our surveysThe material is not significantly screened, but of the 11 licence areas on the south coast of UK, 9 involve non-screened cargoes.
  • 32.
    North NABThe NABarea is therefore representative of the majority of the licence areas on the south coast of UK in contrast with those of the southern North Sea which are generally heavily screened Importantly this was also more representative of the US situation (although maybe not now?)The North Nab site has a further advantage in that part of the area is mined by anchor dredging whilst another part is mined by trailer dredging. This allows direct comparisons of the impact of the 2 types of dredging in adjacent areas.
  • 33.
    LimitationsBecause cargoes arenon-screened (all-in), our study shows the impact of the dredging process itself but does not address the potential impacts of discharge of relatively large quantities of screened material which occurs in many production licence areas, especially in the North Sea
  • 34.
    LimitationsIn common withmany other production licence sites, the impact of dredging at North Nab may interact with other activities that affect sea bed resources. Other licences and a spoil dumping site are nearby, although not strictly downstream. Far-field impacts are therefore increasingly likely to reflect other uses of the marine environment including spoils disposal as one moves away from the immediate site of aggregate dredgingDespite these limitations, the results of our survey for near-site impacts are unlikely to be significantly affected by activities outside the dredge site, and are probably applicable to other production licence areas where discharge of material by overboard screening is minimal
  • 35.
    Physical Impact FieldworkReal-timeSidescan Sonar mosaic (3)over 350 line km collectedSeabed sampling (5 phases)over 180 samples collectedfull PSA analysis
  • 36.
    Hamon GrabThe CoastlineHamon Grab is type approved by CEFAS for offshore benthic investigations. With a dataset collected with constantly changing equipment it is difficult for comparisons to be made. Use of the standard Hamon Grab, as recommended in 1992 by CEFAS will improve nationwide consistency
  • 37.
  • 38.
  • 39.
  • 40.
  • 41.
    ADCP on theNAB (June 2001)Key:Distances in metres downstream between dredger and survey vessel45m45m95m100m105m105m105m130m155m200m
  • 42.
    ADCP on theNAB (June 2001)Key:Distances in metres downstream between dredger and survey vessel45m200m210m
  • 43.
    ADCP on theNAB (June 2001)Key:Longitudinal distances in metres downstream between dredger and survey vessel45m45m820m820m35m25m820m
  • 44.
    Water sampling (June2001)Pump water samples obtained from frame which incorporated an UMI data logger, optical backscatter sensor and pressure transducer
  • 45.
    Water sampling (June2001)Cast 3Cast 1Cast 4Cast 2Cast 5
  • 46.
    City of RochesterPlume ()Backscatter image of density current present within the plumeand possiblenear bedbenthicboundarylayer
  • 47.
    City of RochesterPlume ()Backscatter image of density current present within the plumeand possiblenear bedbenthicboundarylayerImageshows just thehigh levels ofbackscatterindicating thedynamic phaseof the densitycurrent
  • 48.
    City of RochesterPlume ()Backscatter image of density current present within the plumeand possiblenear bedbenthicboundarylayer
  • 49.
    Geopotes Plume ()Backscatterimage of density current present within the plumeand possiblenear bedbenthicboundarylayer
  • 50.
    Geopotes Plume ()Backscatterimage of density current present within the plumeand possiblenear bedbenthicboundarylayer
  • 51.
    Geopotes Plume ()Backscatterimage of divisions within the plumewith possiblenear bedbenthicboundarylayer andSurfaceexpression oforganics orlight fraction
  • 52.
    Geopotes Plume ()Backscatterimage of divisions within the plumewith possiblenear bedbenthicboundarylayer andSurfaceexpression oforganics orlight fraction
  • 53.
  • 54.
    City of ChichesterPlume ()Backscatter image of density current present within the plumeCut away of the core of the plume
  • 55.
    City of ChichesterPlume ()Backscatter image of density current present within the plumeSection across the higher concentrations of the plume , tidal excursion is to the NE (top right) and SW (bottom left)
  • 56.
    City of ChichesterPlume ()Backscatter image of density current present within the plumeThis image strips away the different regions of backscatter intensity, low levels to higher, allowing us to ‘see’ into the regions of high concentration near the centre of the plume.
  • 57.
    City of ChichesterPlume ()Backscatter image of density current present within the plumeThis series of vertical cross sections from NW to SE clearly shows the central core of high backscatter levels (red) which we believe closely depicts the behaviour of the dynamic phase of the density current
  • 58.
    City of ChichesterPlume ()Backscatter image of density current present within the plume10m deep pit is clearly visible possibly with overspilled sediments flowing back out of hole near seabedThe NAB plume data represents a composite body of water up to a few hours old. Tidal currents reversed during the monitoring causing a plume in both directions
  • 59.
    Sidescan Sonar MosaicSidescansonar mosaic of the eastern approaches to the Solent. This encompasses the NAB Area 122/3 shown in RED and the active dredging zones in BLUE and GREEN. Also NAB Tower.
  • 60.
    June 1999 sidescansonar mosaicingEnlarged portion of the previous mosaic. Clearly shows the NAB Tower, different sediment types in the shipping channel, and the dredge holes formed by anchor dredging. Some of the sample locations are also shown.
  • 61.
    June 2001 sidescansonar mosaicingThe June 2001 sidescan sonar mosaicing clearly shows the increased area of active dredging and the localised test loads and trail dredging operations. There is a small development of ripples to the North West of the site but this is across the tide and probably was present during the baseline study in 1999, surveyed at a coarser resolution.