SlideShare a Scribd company logo
1 of 1
Download to read offline
 
•  Oregon	
  Department	
  of	
  Fish	
  and	
  Wildlife:	
  Fish	
  habitat	
  
distribution-­‐all	
  anadromous	
  salmonids	
  
•  National	
  Hydrography	
  Dataset	
  for	
  HUC	
  8	
  
Watersheds,	
  with	
  coastal	
  influence.	
  Identified	
  14	
  
•  National	
  Land	
  Cover	
  Database	
  2011	
  
•  Census	
  Data	
  2010	
  Oregon	
  Population	
  by	
  Census	
  
Block	
  
•  Intergovernmental	
  Panel	
  on	
  Climate	
  Change	
  (2007),	
  
Climate	
  Change	
  2007:	
  The	
  Scientific	
  Basis.	
  Edited	
  by	
  
S.	
  Solomon	
  et	
  al.,	
  Cambridge	
  Univeristy	
  
10m	
  DEM	
  of	
  
Oregon	
  
Watersheds	
  
Reclassify	
  DEM	
   Raster-­‐to-­‐Polygon	
  
Dissolve	
  by	
  
Gridcode	
  
Result:	
  	
  
Target	
  Watershed	
  
Shapefile	
  
Wetlands:	
  	
  
NLCD	
  2011	
  
Dataset	


  Reclassify	
  
Raster-­‐to-­‐
Polygon	
  
Clipped	
  to	
  
Target	
  Area	
  
Sea	
  Level	
  Rise	
  Scenarios:	
  	
  
Lower	
  Columbia	
  Watershed	
  
Nehalem	
  Watershed	
  
Umpqua	
  Watershed	
  
High	
  SLR	
  Prediction	
  Mid	
  SLR	
  Prediction	
  Low	
  SLR	
  Prediction	
  
Target	
  Area:	
  	
  
10	
  m	
  DEM	
  
Raster	
  
Calculator	
  
Reclassify	
  
Raster-­‐to-­‐
Polygon	
  
Dissolve	
  by	
  
Gridcode	
  
Export	
  
above	
  0	
  m	
  
Clip	
  Wetlands	
  
to	
  above	
  0	
  m	
  
Recalculate	
  
by	
  Geometry	
  
Spatial	
  Join	
  
all	
  Scenarios	
  
Calculate	
  
Percent	
  Loss	
  
Percent	
  Wetland	
  Loss	
  for	
  SLR	
  Scenarios:	
  
NHD	
  Surface	
  
Stream	
  
Shapefile	
  
Clip	
  and	
  
Dissolve	
  by	
  
Watershed	
  
Calculate	
  
Geometry	
  
ODFW	
  
Salmonid	
  
Stream	
  Runs	
  
Dissolve	
  by	
  
Watershed	
  
Calculate	
  
Percent	
  Salmon	
  
per	
  River	
  
Salmonid	
  Index:	
  
Oregon	
  Coastal	
  Wetland	
  and	
  Habitat	
  Loss	
  as	
  a	
  Result	
  of	
  Sea	
  Level	
  Rise	
  
Amy	
  Hemingway,	
  Morgan	
  Josef,	
  Inez	
  Lawson	
  
Portland	
  State	
  University	
  
	
  GIS	
  2	
  Spring	
  2015	
  
Analysis	
  Methods:	
  
Introduction:	
   Conclusions	
  and	
  Implications	
  for	
  
Management:	
  
Datasets	
  &	
  References:	
  
Acknowledgments:	
  
Special	
  thanks	
  to	
  Dirk	
  Kinsey	
  for	
  your	
  guidance	
  and	
  to	
  
Bandit	
  the	
  dog	
  for	
  your	
  unconditional	
  support.	
  
Coastal	
  wetlands	
  are	
  areas	
  of	
  land	
  from	
  which	
  water	
  drains	
  
directly	
  to	
  the	
  ocean	
  by	
  way	
  of	
  estuary	
  or	
  bay.	
  These	
  areas	
  are	
  
of	
  great	
  importance	
  as	
  some	
  of	
  the	
  most	
  productive	
  
ecosystems	
  on	
  Earth.	
  More	
  than	
  half	
  of	
  commercially	
  harvested	
  
Pacific	
  Ocean	
  fish	
  depend	
  on	
  coastal	
  wetlands	
  for	
  spawning	
  
grounds,	
  nursery	
  habitat,	
  shelter,	
  and	
  food	
  at	
  some	
  stage	
  of	
  
their	
  lives.	
  Despite	
  their	
  economic	
  and	
  ecologic	
  importance,	
  
these	
  wetlands	
  have	
  suffered	
  degradation	
  and	
  loss	
  due	
  to	
  land	
  
use	
  changes.	
  As	
  climate	
  change	
  continues,	
  the	
  resulting	
  sea	
  
level	
  rise	
  (SLR)	
  is	
  likely	
  to	
  further	
  negatively	
  impact	
  these	
  areas.	


For	
  our	
  analysis,	
  we	
  selected	
  14	
  Oregon	
  watersheds	
  (HUC-­‐8)	
  
that	
  have	
  either	
  large	
  estuarine	
  or	
  coastal	
  influence.	
  The	
  
Intergovernmental	
  Panel	
  on	
  Climate	
  Change	
  has	
  recently	
  (2007)	
  
published	
  several	
  sea	
  level	
  rise	
  scenarios	
  that	
  most	
  literature	
  
considers	
  to	
  be	
  conservative	
  estimates.	
  For	
  our	
  project,	
  we	
  
utilized	
  these	
  sea	
  level	
  rise	
  scenarios,	
  0.28	
  meter	
  (low	
  SLR),	
  
0.69	
  meter	
  (mid	
  SLR)	
  and	
  1.5	
  meter	
  (high	
  SLR)	
  to	
  estimate	
  the	
  
potential	
  loss	
  to	
  wetland	
  area	
  in	
  Oregon’s	
  coastal	
  watersheds.	
  
In	
  order	
  to	
  focus	
  our	
  analysis	
  on	
  the	
  areas	
  within	
  the	
  
watersheds	
  that	
  are	
  likely	
  to	
  be	
  the	
  most	
  impacted	
  by	
  sea	
  
water	
  inundation,	
  we	
  were	
  concerned	
  only	
  with	
  areas	
  within	
  
each	
  coastal	
  watershed	
  that	
  were	
  below	
  10	
  meters	
  in	
  elevation.	


The	
  goal	
  of	
  this	
  project	
  is	
  to	
  map	
  the	
  potential	
  wetland	
  losses	
  
across	
  the	
  sea	
  level	
  rise	
  scenarios	
  to	
  provide	
  coastal	
  land	
  
managers	
  a	
  suggested	
  priority	
  ranking	
  for	
  restoration	
  and	
  
mitigation	
  activities.	
  We	
  included	
  the	
  current	
  salmonid	
  river	
  
length	
  density	
  for	
  each	
  portion	
  of	
  the	
  14	
  watersheds	
  below	
  10	
  
meters,	
  as	
  several	
  salmon	
  are	
  currently	
  endangered	
  and	
  
management	
  is	
  actively	
  selecting	
  areas	
  for	
  targeted	
  
restoration.	


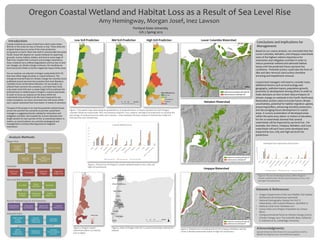
Figure	
  1.	
  Choropleth	
  maps	
  illustrating	
  the	
  potential	
  loss	
  of	
  wetlands	
  below	
  10	
  meters	
  elevation	
  for	
  each	
  Oregon	
  
coastally	
  influenced	
  watersheds.	
  Risk	
  was	
  assessed	
  using	
  IPCC	
  low,	
  medium,	
  and	
  high	
  SLR	
  predictions	
  to	
  calculate	
  the	
  
percentage	
  of	
  wetland	
  area	
  lost	
  under	
  each	
  scenario.	
  	
  Green	
  indicates	
  the	
  least	
  amount	
  of	
  wetland	
  loss	
  while	
  red	
  
indicates	
  the	
  most	
  wetland	
  loss.	
  
Figure	
  5.	
  Wetland	
  area	
  remaining	
  and	
  lost	
  for	
  Umpqua,	
  Nehalem,	
  and	
  the	
  
Lower	
  Columbia	
  watersheds	
  based	
  on	
  high	
  SLR	
  predictions.	


Figure	
  2.	
  Percent	
  loss	
  of	
  Oregon‘s	
  coastal	
  wetlands	
  based	
  on	
  low,	
  mid,	
  and	
  
high	
  SLR	
  predictions.	


Figure	
  3.	
  Oregon	
  coastal	
  
watershed	
  salmon	
  run	
  density	
  
(low	
  to	
  high).	
  
Based	
  on	
  our	
  coarse	
  analysis,	
  we	
  concluded	
  that	
  the	
  
Lower	
  Columbia,	
  Nehalem,	
  and	
  Umpqua	
  watersheds	
  
were	
  of	
  the	
  highest	
  relative	
  importance	
  for	
  
restoration	
  and	
  mitigation	
  activities	
  in	
  order	
  to	
  
reduce	
  potential	
  wetland	
  and	
  salmonid	
  habitat	
  
losses	
  with	
  the	
  predicted	
  future	
  sea	
  level	
  rise	
  
conditions.	
  	
  Potential	
  actions	
  could	
  take	
  the	
  form	
  of	
  
dike	
  and	
  dam	
  removal,	
  hard	
  surface	
  shoreline	
  
armoring	
  and	
  impediment	
  removal.	


Coastal	
  land	
  managers	
  will	
  need	
  to	
  consider	
  many	
  
additional	
  factors	
  such	
  as	
  local	
  ecology	
  and	
  
geography,	
  pollution	
  inputs,	
  population	
  growth,	
  
proximity	
  to	
  development	
  among	
  others	
  in	
  order	
  to	
  
make	
  decisions	
  on	
  how	
  to	
  best	
  reduce	
  impacts	
  of	
  
climate	
  change	
  on	
  wetlands	
  in	
  the	
  Pacific	
  Northwest.	
  	
  
Restoration	
  actions	
  need	
  to	
  include	
  future	
  climate	
  
uncertainties,	
  potential	
  for	
  habitat	
  migration	
  upland,	
  
preserving	
  buffers,	
  enhancing	
  shoreline	
  protection,	
  
and	
  discouraging	
  future	
  development	
  in	
  coastal	
  
areas.	
  A	
  cursory	
  examination	
  of	
  developed	
  areas	
  
within	
  the	
  same	
  area,	
  below	
  10	
  meters	
  of	
  elevation,	
  
for	
  the	
  14	
  watersheds	
  showed	
  that	
  several	
  
watersheds	
  will	
  be	
  impacted	
  by	
  sea	
  level	
  rise	
  .	
  For	
  
example,	
  the	
  Chetco,	
  Umpqua,	
  Nehalem,	
  and	
  Coos	
  
watersheds	
  will	
  each	
  have	
  some	
  developed	
  land	
  
impacted	
  by	
  low,	
  mid,	
  and	
  high	
  sea	
  level	
  rise	
  
predictions.	
  	
  
Figure	
  4.	
  State	
  of	
  Oregon	
  with	
  the	
  14	
  coastal	
  watersheds	
  selected	
  for	
  
analysis.	
  
0"
2"
4"
6"
8"
10"
12"
14"
16"
Alsea"
Chetco"
Coos"Coquille"
Lower"Colum
bia"
Lower"Rogue"Necanicum
"Nehalem
"
Siletz@Yaquina"
Siltcoos"
Siuslaw"
Sixes"Um
pqua"
W
ilson@Trusk@
"Developed"Area"Impacted"by"SLR"Scenarios"
%"impact"with"low" %"impact"with"mid" %"impact"with"high"
Figure	
  6.	
  Percent	
  of	
  developed	
  areas	
  within	
  Oregon’s	
  
coastal	
  wetlands	
  that	
  will	
  be	
  impacted	
  based	
  on	
  low,	
  mid,	
  
and	
  high	
  SLR	
  predictions	
  

More Related Content

What's hot

Identify saltwater intrusion in coastal aquifer
Identify saltwater intrusion in coastal aquiferIdentify saltwater intrusion in coastal aquifer
Identify saltwater intrusion in coastal aquiferPutika Ashfar Khoiri
 
Clad agm intro_dave_gilvear
Clad agm intro_dave_gilvearClad agm intro_dave_gilvear
Clad agm intro_dave_gilvearCarbonLandscapes
 
Hydrology presentation
Hydrology presentationHydrology presentation
Hydrology presentationHamid_98
 
Clad agm forest research_nadeem
Clad agm forest research_nadeemClad agm forest research_nadeem
Clad agm forest research_nadeemCarbonLandscapes
 
Lecture 7 ce1005 Irrigation and Flood control by Rabindra Ranjan Saha,PENG, WUB
Lecture 7 ce1005 Irrigation and Flood control by Rabindra Ranjan Saha,PENG, WUBLecture 7 ce1005 Irrigation and Flood control by Rabindra Ranjan Saha,PENG, WUB
Lecture 7 ce1005 Irrigation and Flood control by Rabindra Ranjan Saha,PENG, WUBWorld University of Bangladesh
 
concept of Hydrology
concept of Hydrologyconcept of Hydrology
concept of HydrologyParimal Jha
 
Surface Water and Groundwater Interaction
Surface Water and Groundwater InteractionSurface Water and Groundwater Interaction
Surface Water and Groundwater InteractionC. P. Kumar
 
Interaction of saltwater freshwater in coastal aquifiers
Interaction of saltwater freshwater in coastal aquifiersInteraction of saltwater freshwater in coastal aquifiers
Interaction of saltwater freshwater in coastal aquifiersPutika Ashfar Khoiri
 
Modelling of a Coastal Aquifer using FEFLOW
Modelling of a Coastal Aquifer using FEFLOWModelling of a Coastal Aquifer using FEFLOW
Modelling of a Coastal Aquifer using FEFLOWC. P. Kumar
 
Chapter 2 hydrologic cycle
Chapter 2 hydrologic cycleChapter 2 hydrologic cycle
Chapter 2 hydrologic cycleMohammed Salahat
 
Ch2 occurrence-of-groundwater
Ch2 occurrence-of-groundwaterCh2 occurrence-of-groundwater
Ch2 occurrence-of-groundwaterUsama Waly
 

What's hot (19)

Identify saltwater intrusion in coastal aquifer
Identify saltwater intrusion in coastal aquiferIdentify saltwater intrusion in coastal aquifer
Identify saltwater intrusion in coastal aquifer
 
Clad agm intro_dave_gilvear
Clad agm intro_dave_gilvearClad agm intro_dave_gilvear
Clad agm intro_dave_gilvear
 
Sea water intrusion
Sea water intrusion Sea water intrusion
Sea water intrusion
 
Hydrology presentation
Hydrology presentationHydrology presentation
Hydrology presentation
 
Clad agm forest research_nadeem
Clad agm forest research_nadeemClad agm forest research_nadeem
Clad agm forest research_nadeem
 
Lecture 7 ce1005 Irrigation and Flood control by Rabindra Ranjan Saha,PENG, WUB
Lecture 7 ce1005 Irrigation and Flood control by Rabindra Ranjan Saha,PENG, WUBLecture 7 ce1005 Irrigation and Flood control by Rabindra Ranjan Saha,PENG, WUB
Lecture 7 ce1005 Irrigation and Flood control by Rabindra Ranjan Saha,PENG, WUB
 
concept of Hydrology
concept of Hydrologyconcept of Hydrology
concept of Hydrology
 
Surface Water and Groundwater Interaction
Surface Water and Groundwater InteractionSurface Water and Groundwater Interaction
Surface Water and Groundwater Interaction
 
Interaction of saltwater freshwater in coastal aquifiers
Interaction of saltwater freshwater in coastal aquifiersInteraction of saltwater freshwater in coastal aquifiers
Interaction of saltwater freshwater in coastal aquifiers
 
Chapter 8 Fetter Geology of Groundwater Occurrence-Gaza Strip
Chapter 8 Fetter Geology  of Groundwater Occurrence-Gaza StripChapter 8 Fetter Geology  of Groundwater Occurrence-Gaza Strip
Chapter 8 Fetter Geology of Groundwater Occurrence-Gaza Strip
 
2018 Leadership Training_Groundwater Hydrology 101
2018 Leadership Training_Groundwater Hydrology 1012018 Leadership Training_Groundwater Hydrology 101
2018 Leadership Training_Groundwater Hydrology 101
 
Modelling of a Coastal Aquifer using FEFLOW
Modelling of a Coastal Aquifer using FEFLOWModelling of a Coastal Aquifer using FEFLOW
Modelling of a Coastal Aquifer using FEFLOW
 
Hydrology
HydrologyHydrology
Hydrology
 
Saltwater intrusion
Saltwater intrusionSaltwater intrusion
Saltwater intrusion
 
Sea Water Intrusion
Sea Water IntrusionSea Water Intrusion
Sea Water Intrusion
 
Chapter 2 hydrologic cycle
Chapter 2 hydrologic cycleChapter 2 hydrologic cycle
Chapter 2 hydrologic cycle
 
Ch2 occurrence-of-groundwater
Ch2 occurrence-of-groundwaterCh2 occurrence-of-groundwater
Ch2 occurrence-of-groundwater
 
Hydrocycle
HydrocycleHydrocycle
Hydrocycle
 
Salinity Prevention
Salinity PreventionSalinity Prevention
Salinity Prevention
 

Viewers also liked

Highrise buildings....
Highrise buildings....Highrise buildings....
Highrise buildings....MSulmanSarwar
 
Earthquake resistant low rise building
Earthquake resistant low rise buildingEarthquake resistant low rise building
Earthquake resistant low rise buildingRakesh Samaddar
 
Mumbai High Rise Buildings Case studies of Kohinoor Square, Aquaria Grande, K...
Mumbai High Rise Buildings Case studies of Kohinoor Square, Aquaria Grande, K...Mumbai High Rise Buildings Case studies of Kohinoor Square, Aquaria Grande, K...
Mumbai High Rise Buildings Case studies of Kohinoor Square, Aquaria Grande, K...Prateek Srivastava
 

Viewers also liked (6)

Highrise buildings....
Highrise buildings....Highrise buildings....
Highrise buildings....
 
Aranya housing
Aranya housingAranya housing
Aranya housing
 
Earthquake resistant low rise building
Earthquake resistant low rise buildingEarthquake resistant low rise building
Earthquake resistant low rise building
 
Hamlet
HamletHamlet
Hamlet
 
HOUSING CASE STUDY
HOUSING CASE STUDYHOUSING CASE STUDY
HOUSING CASE STUDY
 
Mumbai High Rise Buildings Case studies of Kohinoor Square, Aquaria Grande, K...
Mumbai High Rise Buildings Case studies of Kohinoor Square, Aquaria Grande, K...Mumbai High Rise Buildings Case studies of Kohinoor Square, Aquaria Grande, K...
Mumbai High Rise Buildings Case studies of Kohinoor Square, Aquaria Grande, K...
 

Similar to Oregon Coastal Wetland Loss from Sea Level Rise

Accounting for Wetlands Loss in a Changing Climate in the Estimation of Long...
Accounting for Wetlands Loss in a  Changing Climate in the Estimation of Long...Accounting for Wetlands Loss in a  Changing Climate in the Estimation of Long...
Accounting for Wetlands Loss in a Changing Climate in the Estimation of Long...Sergey Gulbin
 
Keynote athens andrea merla
Keynote athens andrea merlaKeynote athens andrea merla
Keynote athens andrea merlagroundwatercop
 
DSD-INT 2021 Impact of Desalination and Climate Change on Salinity levels in ...
DSD-INT 2021 Impact of Desalination and Climate Change on Salinity levels in ...DSD-INT 2021 Impact of Desalination and Climate Change on Salinity levels in ...
DSD-INT 2021 Impact of Desalination and Climate Change on Salinity levels in ...Deltares
 
Lessons Learned From The Everglades Sjr Summit 2010 09 15 Esterson+Landers
Lessons Learned From The Everglades Sjr Summit 2010 09 15 Esterson+LandersLessons Learned From The Everglades Sjr Summit 2010 09 15 Esterson+Landers
Lessons Learned From The Everglades Sjr Summit 2010 09 15 Esterson+LandersKris Esterson
 
Water Matters , Episode II 1-29-2016 Prof Sarah Meyland on Managing Long Isl...
Water Matters , Episode II  1-29-2016 Prof Sarah Meyland on Managing Long Isl...Water Matters , Episode II  1-29-2016 Prof Sarah Meyland on Managing Long Isl...
Water Matters , Episode II 1-29-2016 Prof Sarah Meyland on Managing Long Isl...Save The Great South Bay
 
Current Status of CRZ It’s implementation. by-Vasudev P. Mahale
Current Status of CRZ It’s implementation. by-Vasudev P. Mahale Current Status of CRZ It’s implementation. by-Vasudev P. Mahale
Current Status of CRZ It’s implementation. by-Vasudev P. Mahale Ecotist
 
Watershed charecteristics
Watershed charecteristicsWatershed charecteristics
Watershed charecteristicsVipin Mishra
 
Climate changes impact on coastal regions
Climate changes impact on coastal regionsClimate changes impact on coastal regions
Climate changes impact on coastal regionsMakeOil Green
 
Land Conservation for the Protection of Water Quality
Land Conservation for the Protection of Water QualityLand Conservation for the Protection of Water Quality
Land Conservation for the Protection of Water QualityHannah Kiesler
 

Similar to Oregon Coastal Wetland Loss from Sea Level Rise (20)

Accounting for Wetlands Loss in a Changing Climate in the Estimation of Long...
Accounting for Wetlands Loss in a  Changing Climate in the Estimation of Long...Accounting for Wetlands Loss in a  Changing Climate in the Estimation of Long...
Accounting for Wetlands Loss in a Changing Climate in the Estimation of Long...
 
Keynote athens andrea merla
Keynote athens andrea merlaKeynote athens andrea merla
Keynote athens andrea merla
 
DSD-INT 2021 Impact of Desalination and Climate Change on Salinity levels in ...
DSD-INT 2021 Impact of Desalination and Climate Change on Salinity levels in ...DSD-INT 2021 Impact of Desalination and Climate Change on Salinity levels in ...
DSD-INT 2021 Impact of Desalination and Climate Change on Salinity levels in ...
 
Clarisse_Betancourt_Poster_Presentation
Clarisse_Betancourt_Poster_PresentationClarisse_Betancourt_Poster_Presentation
Clarisse_Betancourt_Poster_Presentation
 
Lessons Learned From The Everglades Sjr Summit 2010 09 15 Esterson+Landers
Lessons Learned From The Everglades Sjr Summit 2010 09 15 Esterson+LandersLessons Learned From The Everglades Sjr Summit 2010 09 15 Esterson+Landers
Lessons Learned From The Everglades Sjr Summit 2010 09 15 Esterson+Landers
 
Mapping human impacts to Papahanaumokuakea
Mapping human impacts to PapahanaumokuakeaMapping human impacts to Papahanaumokuakea
Mapping human impacts to Papahanaumokuakea
 
310B Disertation
310B Disertation310B Disertation
310B Disertation
 
Water Matters , Episode II 1-29-2016 Prof Sarah Meyland on Managing Long Isl...
Water Matters , Episode II  1-29-2016 Prof Sarah Meyland on Managing Long Isl...Water Matters , Episode II  1-29-2016 Prof Sarah Meyland on Managing Long Isl...
Water Matters , Episode II 1-29-2016 Prof Sarah Meyland on Managing Long Isl...
 
Merri Creek Case Study
Merri Creek Case StudyMerri Creek Case Study
Merri Creek Case Study
 
Ugum River Project
Ugum River ProjectUgum River Project
Ugum River Project
 
Energy and Materials Exchange between Terrestrial and Aquatic Ecosystems
Energy and Materials Exchange between Terrestrial and Aquatic EcosystemsEnergy and Materials Exchange between Terrestrial and Aquatic Ecosystems
Energy and Materials Exchange between Terrestrial and Aquatic Ecosystems
 
Current Status of CRZ It’s implementation. by-Vasudev P. Mahale
Current Status of CRZ It’s implementation. by-Vasudev P. Mahale Current Status of CRZ It’s implementation. by-Vasudev P. Mahale
Current Status of CRZ It’s implementation. by-Vasudev P. Mahale
 
Watershed charecteristics
Watershed charecteristicsWatershed charecteristics
Watershed charecteristics
 
ARTICLE
ARTICLEARTICLE
ARTICLE
 
Climate changes impact on coastal regions
Climate changes impact on coastal regionsClimate changes impact on coastal regions
Climate changes impact on coastal regions
 
Lancang-Mekong Development Plan Environmental Study - Findings and Conclusions
Lancang-Mekong Development Plan Environmental Study - Findings and Conclusions Lancang-Mekong Development Plan Environmental Study - Findings and Conclusions
Lancang-Mekong Development Plan Environmental Study - Findings and Conclusions
 
East Cornwall CFMP
East Cornwall CFMPEast Cornwall CFMP
East Cornwall CFMP
 
Land Conservation for the Protection of Water Quality
Land Conservation for the Protection of Water QualityLand Conservation for the Protection of Water Quality
Land Conservation for the Protection of Water Quality
 
0837-Petty-WV
0837-Petty-WV0837-Petty-WV
0837-Petty-WV
 
Climate, carbon and coral reefs
Climate, carbon and coral reefsClimate, carbon and coral reefs
Climate, carbon and coral reefs
 

Oregon Coastal Wetland Loss from Sea Level Rise

  • 1.   •  Oregon  Department  of  Fish  and  Wildlife:  Fish  habitat   distribution-­‐all  anadromous  salmonids   •  National  Hydrography  Dataset  for  HUC  8   Watersheds,  with  coastal  influence.  Identified  14   •  National  Land  Cover  Database  2011   •  Census  Data  2010  Oregon  Population  by  Census   Block   •  Intergovernmental  Panel  on  Climate  Change  (2007),   Climate  Change  2007:  The  Scientific  Basis.  Edited  by   S.  Solomon  et  al.,  Cambridge  Univeristy   10m  DEM  of   Oregon   Watersheds   Reclassify  DEM   Raster-­‐to-­‐Polygon   Dissolve  by   Gridcode   Result:     Target  Watershed   Shapefile   Wetlands:     NLCD  2011   Dataset        Reclassify   Raster-­‐to-­‐ Polygon   Clipped  to   Target  Area   Sea  Level  Rise  Scenarios:     Lower  Columbia  Watershed   Nehalem  Watershed   Umpqua  Watershed   High  SLR  Prediction  Mid  SLR  Prediction  Low  SLR  Prediction   Target  Area:     10  m  DEM   Raster   Calculator   Reclassify   Raster-­‐to-­‐ Polygon   Dissolve  by   Gridcode   Export   above  0  m   Clip  Wetlands   to  above  0  m   Recalculate   by  Geometry   Spatial  Join   all  Scenarios   Calculate   Percent  Loss   Percent  Wetland  Loss  for  SLR  Scenarios:   NHD  Surface   Stream   Shapefile   Clip  and   Dissolve  by   Watershed   Calculate   Geometry   ODFW   Salmonid   Stream  Runs   Dissolve  by   Watershed   Calculate   Percent  Salmon   per  River   Salmonid  Index:   Oregon  Coastal  Wetland  and  Habitat  Loss  as  a  Result  of  Sea  Level  Rise   Amy  Hemingway,  Morgan  Josef,  Inez  Lawson   Portland  State  University    GIS  2  Spring  2015   Analysis  Methods:   Introduction:   Conclusions  and  Implications  for   Management:   Datasets  &  References:   Acknowledgments:   Special  thanks  to  Dirk  Kinsey  for  your  guidance  and  to   Bandit  the  dog  for  your  unconditional  support.   Coastal  wetlands  are  areas  of  land  from  which  water  drains   directly  to  the  ocean  by  way  of  estuary  or  bay.  These  areas  are   of  great  importance  as  some  of  the  most  productive   ecosystems  on  Earth.  More  than  half  of  commercially  harvested   Pacific  Ocean  fish  depend  on  coastal  wetlands  for  spawning   grounds,  nursery  habitat,  shelter,  and  food  at  some  stage  of   their  lives.  Despite  their  economic  and  ecologic  importance,   these  wetlands  have  suffered  degradation  and  loss  due  to  land   use  changes.  As  climate  change  continues,  the  resulting  sea   level  rise  (SLR)  is  likely  to  further  negatively  impact  these  areas.       For  our  analysis,  we  selected  14  Oregon  watersheds  (HUC-­‐8)   that  have  either  large  estuarine  or  coastal  influence.  The   Intergovernmental  Panel  on  Climate  Change  has  recently  (2007)   published  several  sea  level  rise  scenarios  that  most  literature   considers  to  be  conservative  estimates.  For  our  project,  we   utilized  these  sea  level  rise  scenarios,  0.28  meter  (low  SLR),   0.69  meter  (mid  SLR)  and  1.5  meter  (high  SLR)  to  estimate  the   potential  loss  to  wetland  area  in  Oregon’s  coastal  watersheds.   In  order  to  focus  our  analysis  on  the  areas  within  the   watersheds  that  are  likely  to  be  the  most  impacted  by  sea   water  inundation,  we  were  concerned  only  with  areas  within   each  coastal  watershed  that  were  below  10  meters  in  elevation.     The  goal  of  this  project  is  to  map  the  potential  wetland  losses   across  the  sea  level  rise  scenarios  to  provide  coastal  land   managers  a  suggested  priority  ranking  for  restoration  and   mitigation  activities.  We  included  the  current  salmonid  river   length  density  for  each  portion  of  the  14  watersheds  below  10   meters,  as  several  salmon  are  currently  endangered  and   management  is  actively  selecting  areas  for  targeted   restoration.       Figure  1.  Choropleth  maps  illustrating  the  potential  loss  of  wetlands  below  10  meters  elevation  for  each  Oregon   coastally  influenced  watersheds.  Risk  was  assessed  using  IPCC  low,  medium,  and  high  SLR  predictions  to  calculate  the   percentage  of  wetland  area  lost  under  each  scenario.    Green  indicates  the  least  amount  of  wetland  loss  while  red   indicates  the  most  wetland  loss.   Figure  5.  Wetland  area  remaining  and  lost  for  Umpqua,  Nehalem,  and  the   Lower  Columbia  watersheds  based  on  high  SLR  predictions.       Figure  2.  Percent  loss  of  Oregon‘s  coastal  wetlands  based  on  low,  mid,  and   high  SLR  predictions.     Figure  3.  Oregon  coastal   watershed  salmon  run  density   (low  to  high).   Based  on  our  coarse  analysis,  we  concluded  that  the   Lower  Columbia,  Nehalem,  and  Umpqua  watersheds   were  of  the  highest  relative  importance  for   restoration  and  mitigation  activities  in  order  to   reduce  potential  wetland  and  salmonid  habitat   losses  with  the  predicted  future  sea  level  rise   conditions.    Potential  actions  could  take  the  form  of   dike  and  dam  removal,  hard  surface  shoreline   armoring  and  impediment  removal.     Coastal  land  managers  will  need  to  consider  many   additional  factors  such  as  local  ecology  and   geography,  pollution  inputs,  population  growth,   proximity  to  development  among  others  in  order  to   make  decisions  on  how  to  best  reduce  impacts  of   climate  change  on  wetlands  in  the  Pacific  Northwest.     Restoration  actions  need  to  include  future  climate   uncertainties,  potential  for  habitat  migration  upland,   preserving  buffers,  enhancing  shoreline  protection,   and  discouraging  future  development  in  coastal   areas.  A  cursory  examination  of  developed  areas   within  the  same  area,  below  10  meters  of  elevation,   for  the  14  watersheds  showed  that  several   watersheds  will  be  impacted  by  sea  level  rise  .  For   example,  the  Chetco,  Umpqua,  Nehalem,  and  Coos   watersheds  will  each  have  some  developed  land   impacted  by  low,  mid,  and  high  sea  level  rise   predictions.     Figure  4.  State  of  Oregon  with  the  14  coastal  watersheds  selected  for   analysis.   0" 2" 4" 6" 8" 10" 12" 14" 16" Alsea" Chetco" Coos"Coquille" Lower"Colum bia" Lower"Rogue"Necanicum "Nehalem " Siletz@Yaquina" Siltcoos" Siuslaw" Sixes"Um pqua" W ilson@Trusk@ "Developed"Area"Impacted"by"SLR"Scenarios" %"impact"with"low" %"impact"with"mid" %"impact"with"high" Figure  6.  Percent  of  developed  areas  within  Oregon’s   coastal  wetlands  that  will  be  impacted  based  on  low,  mid,   and  high  SLR  predictions