Download to read offline
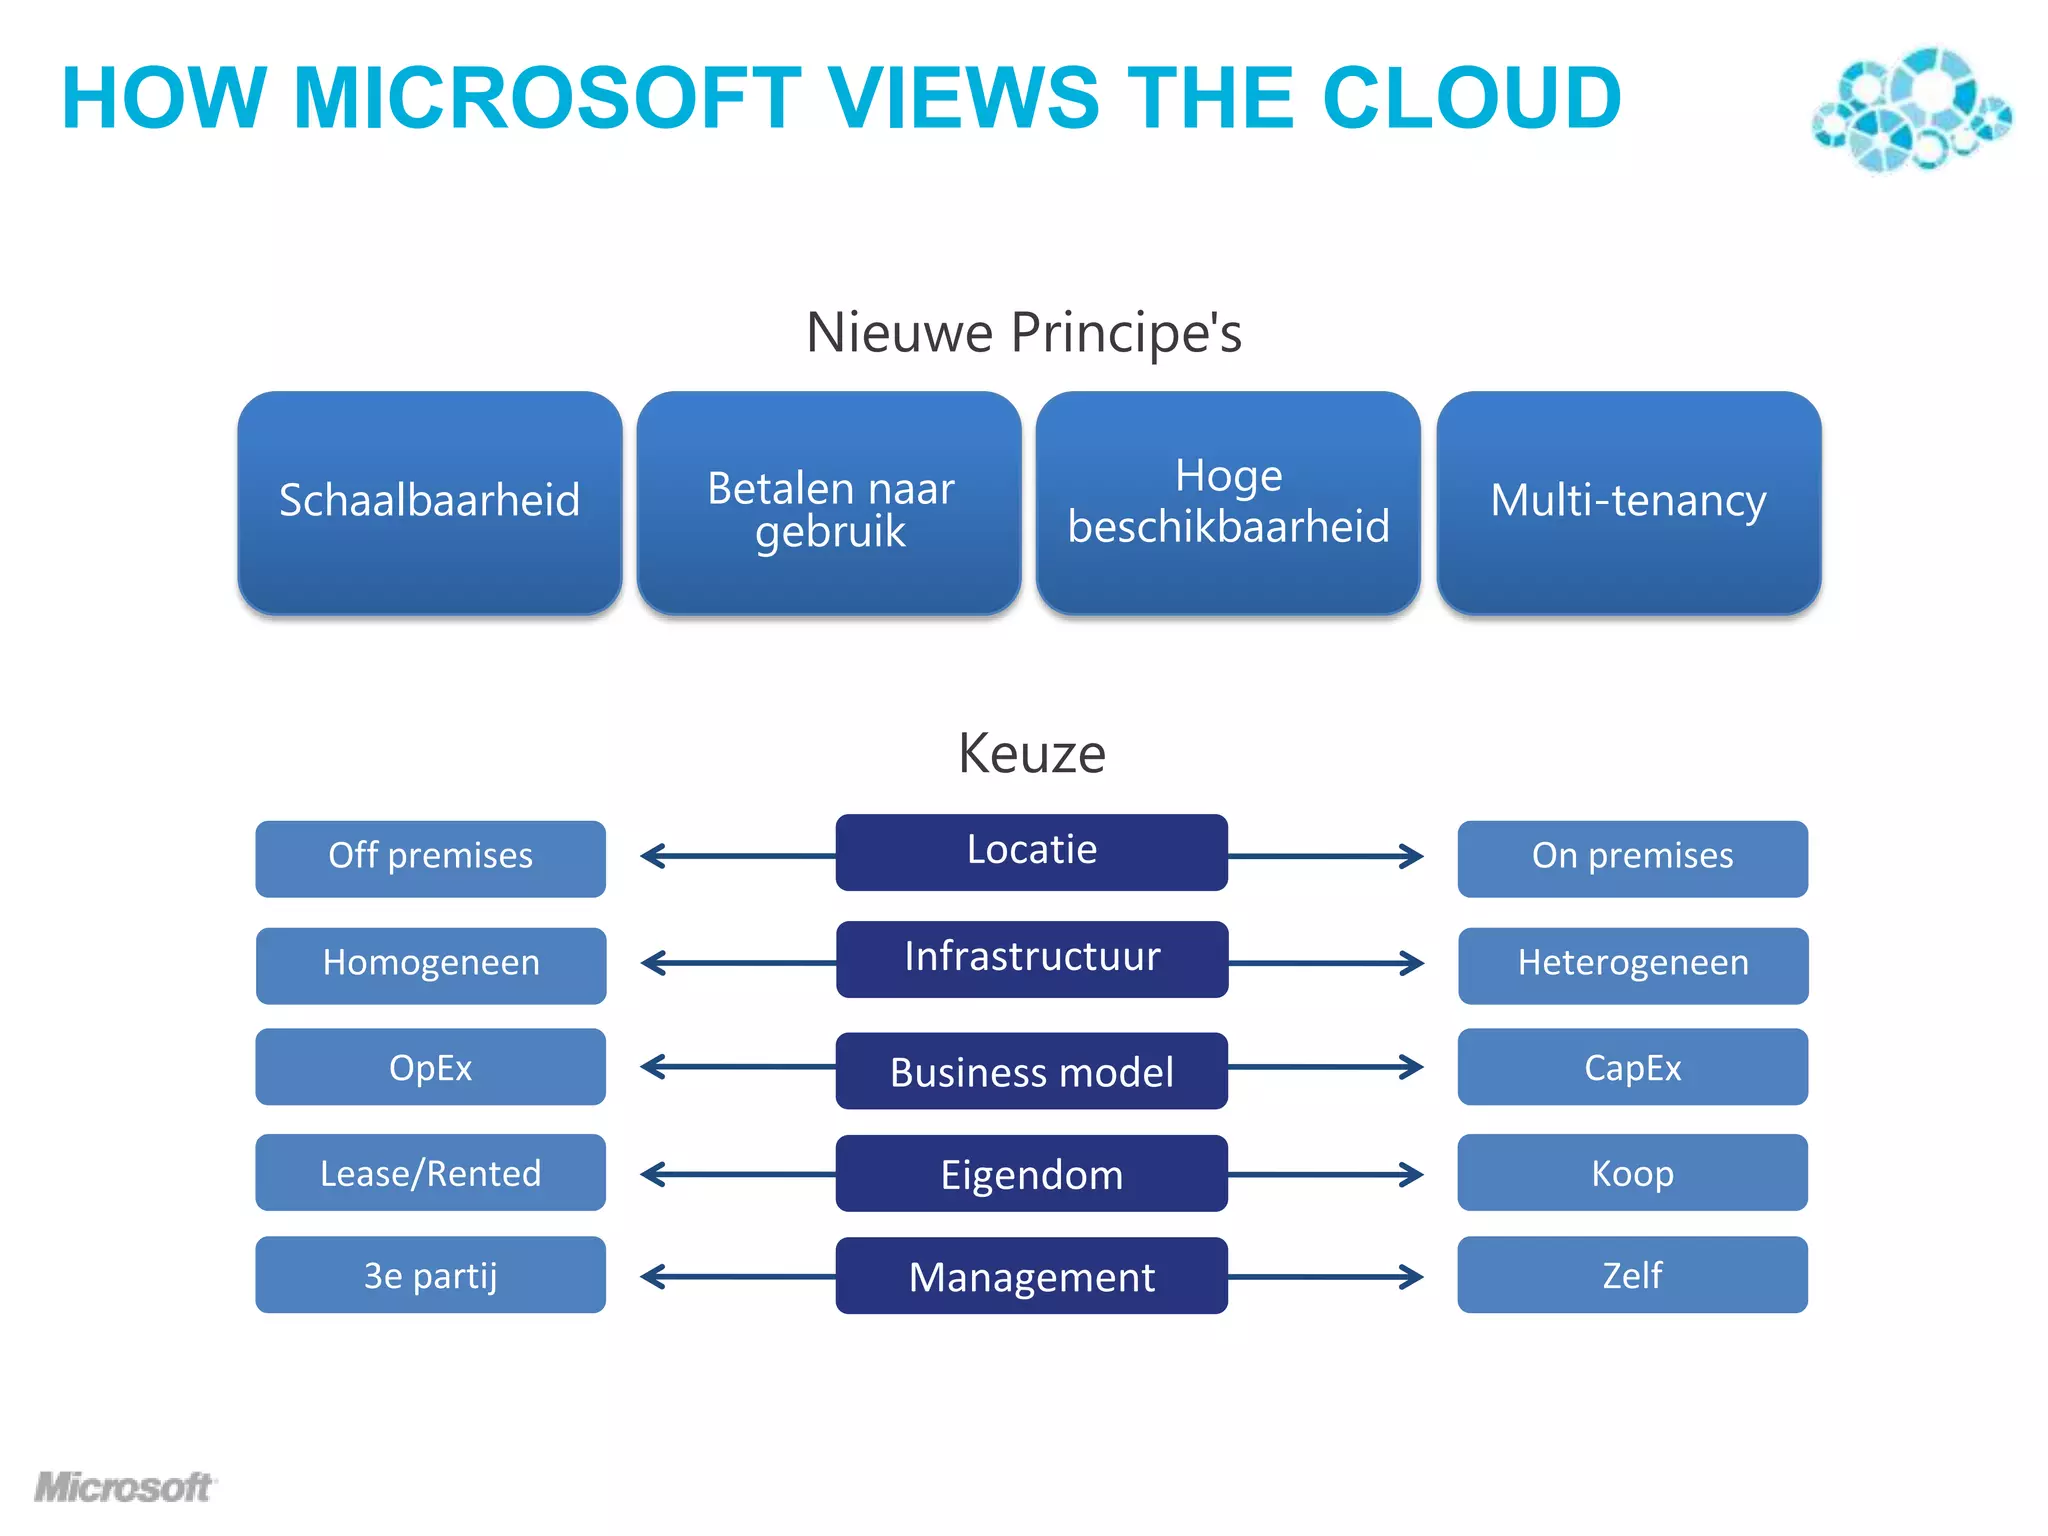
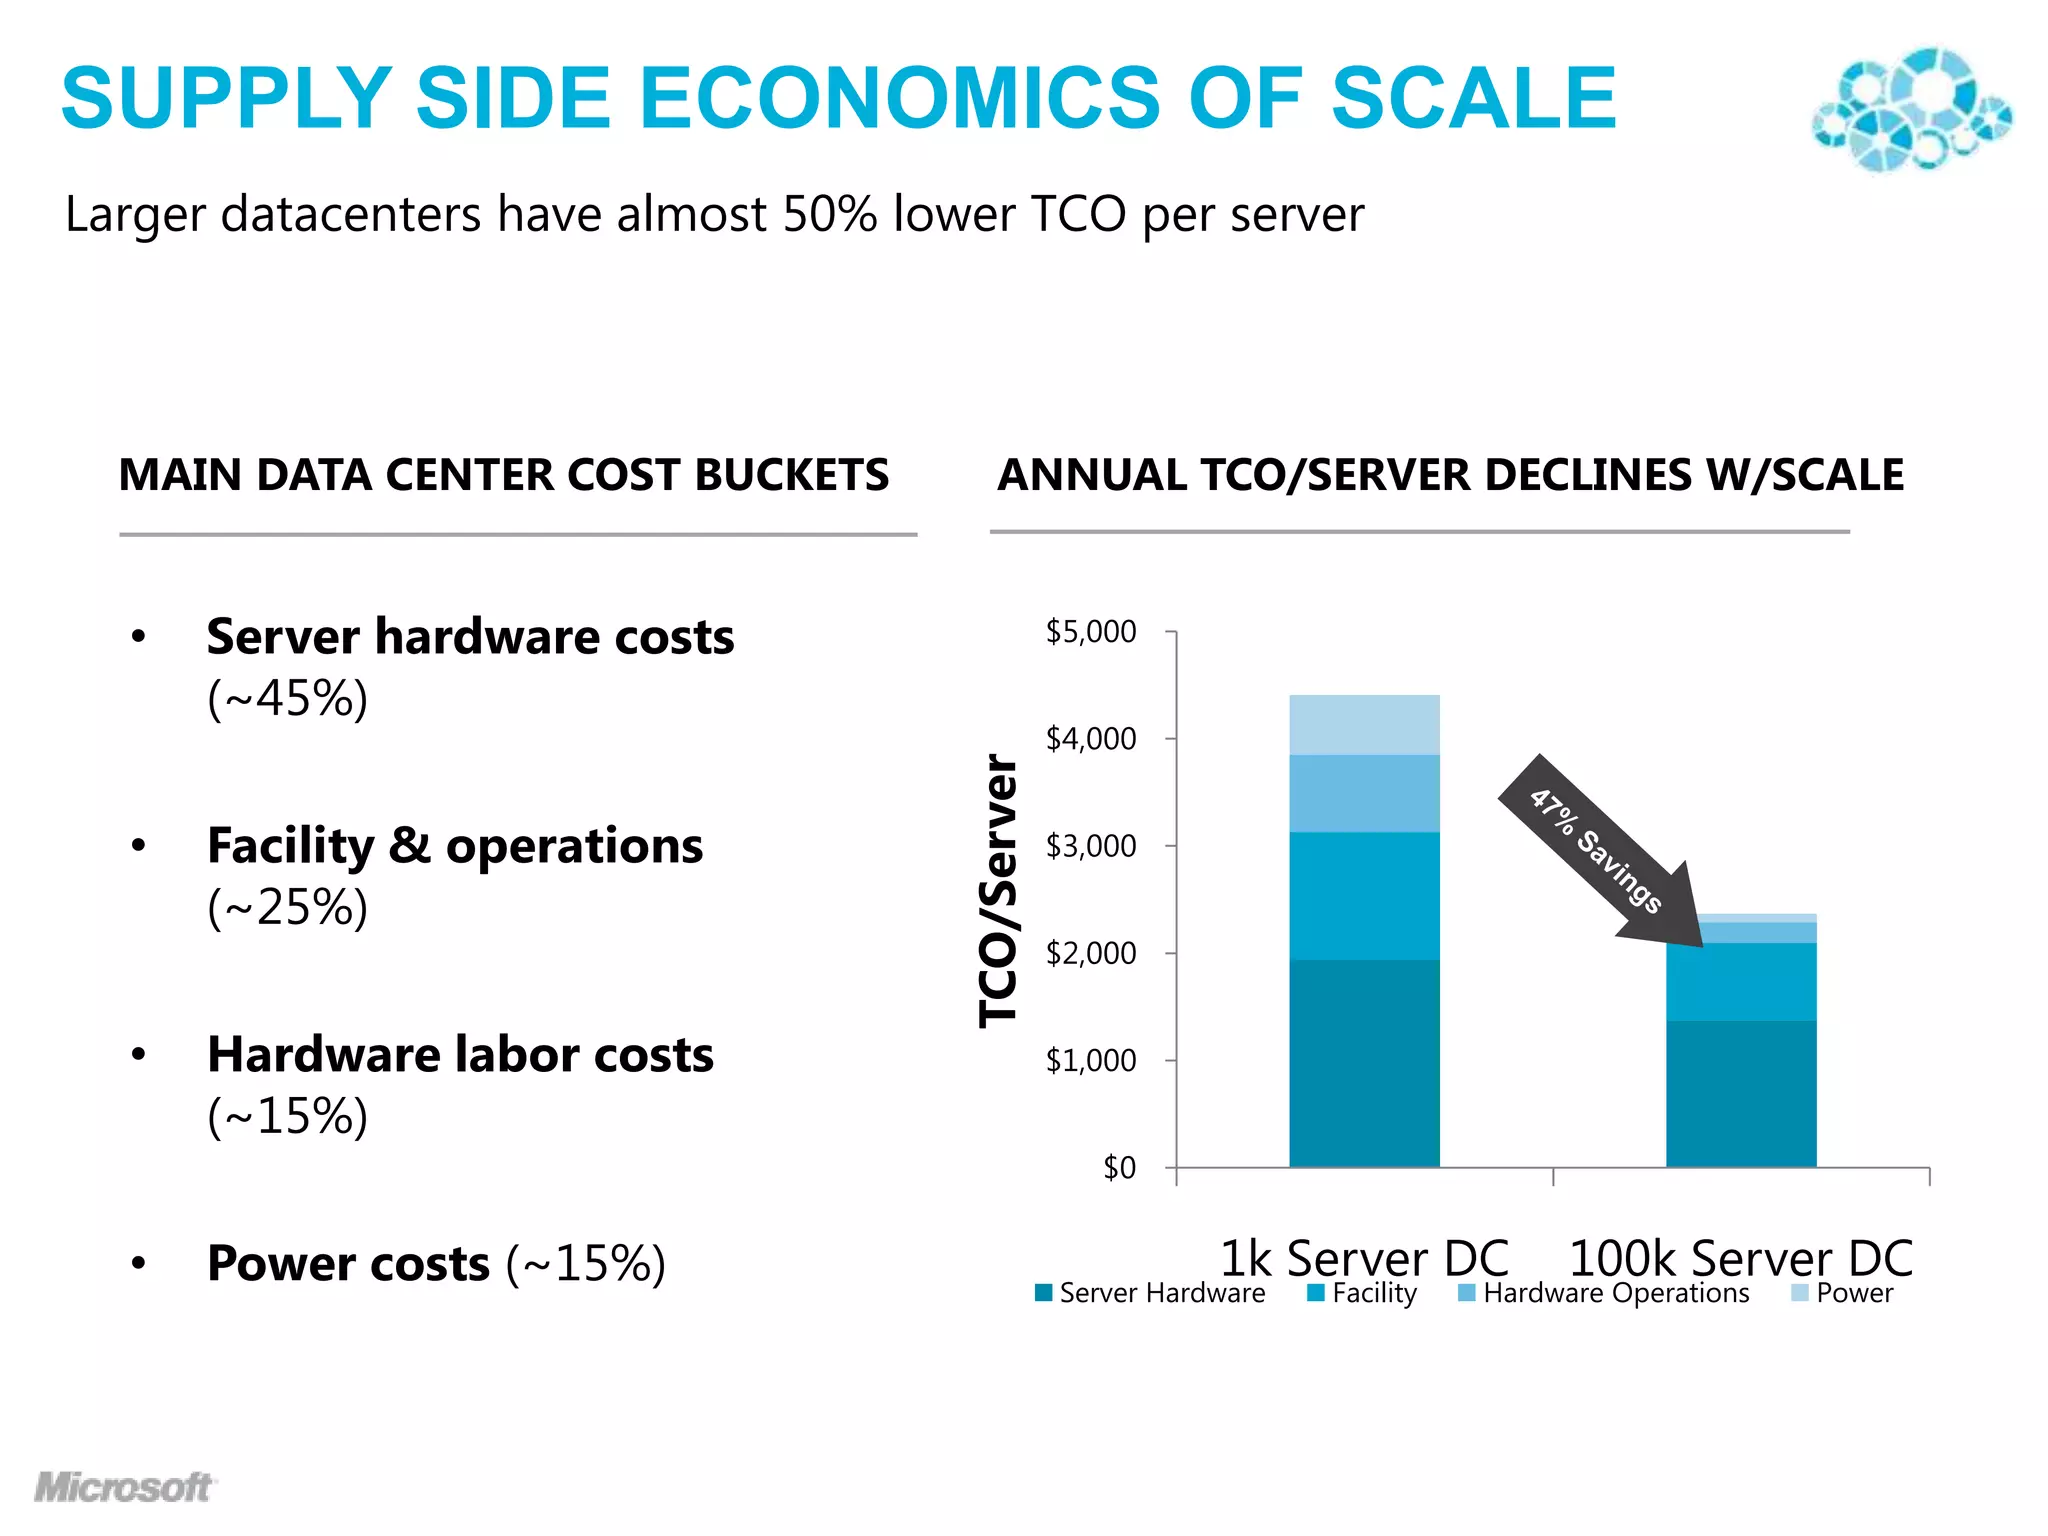
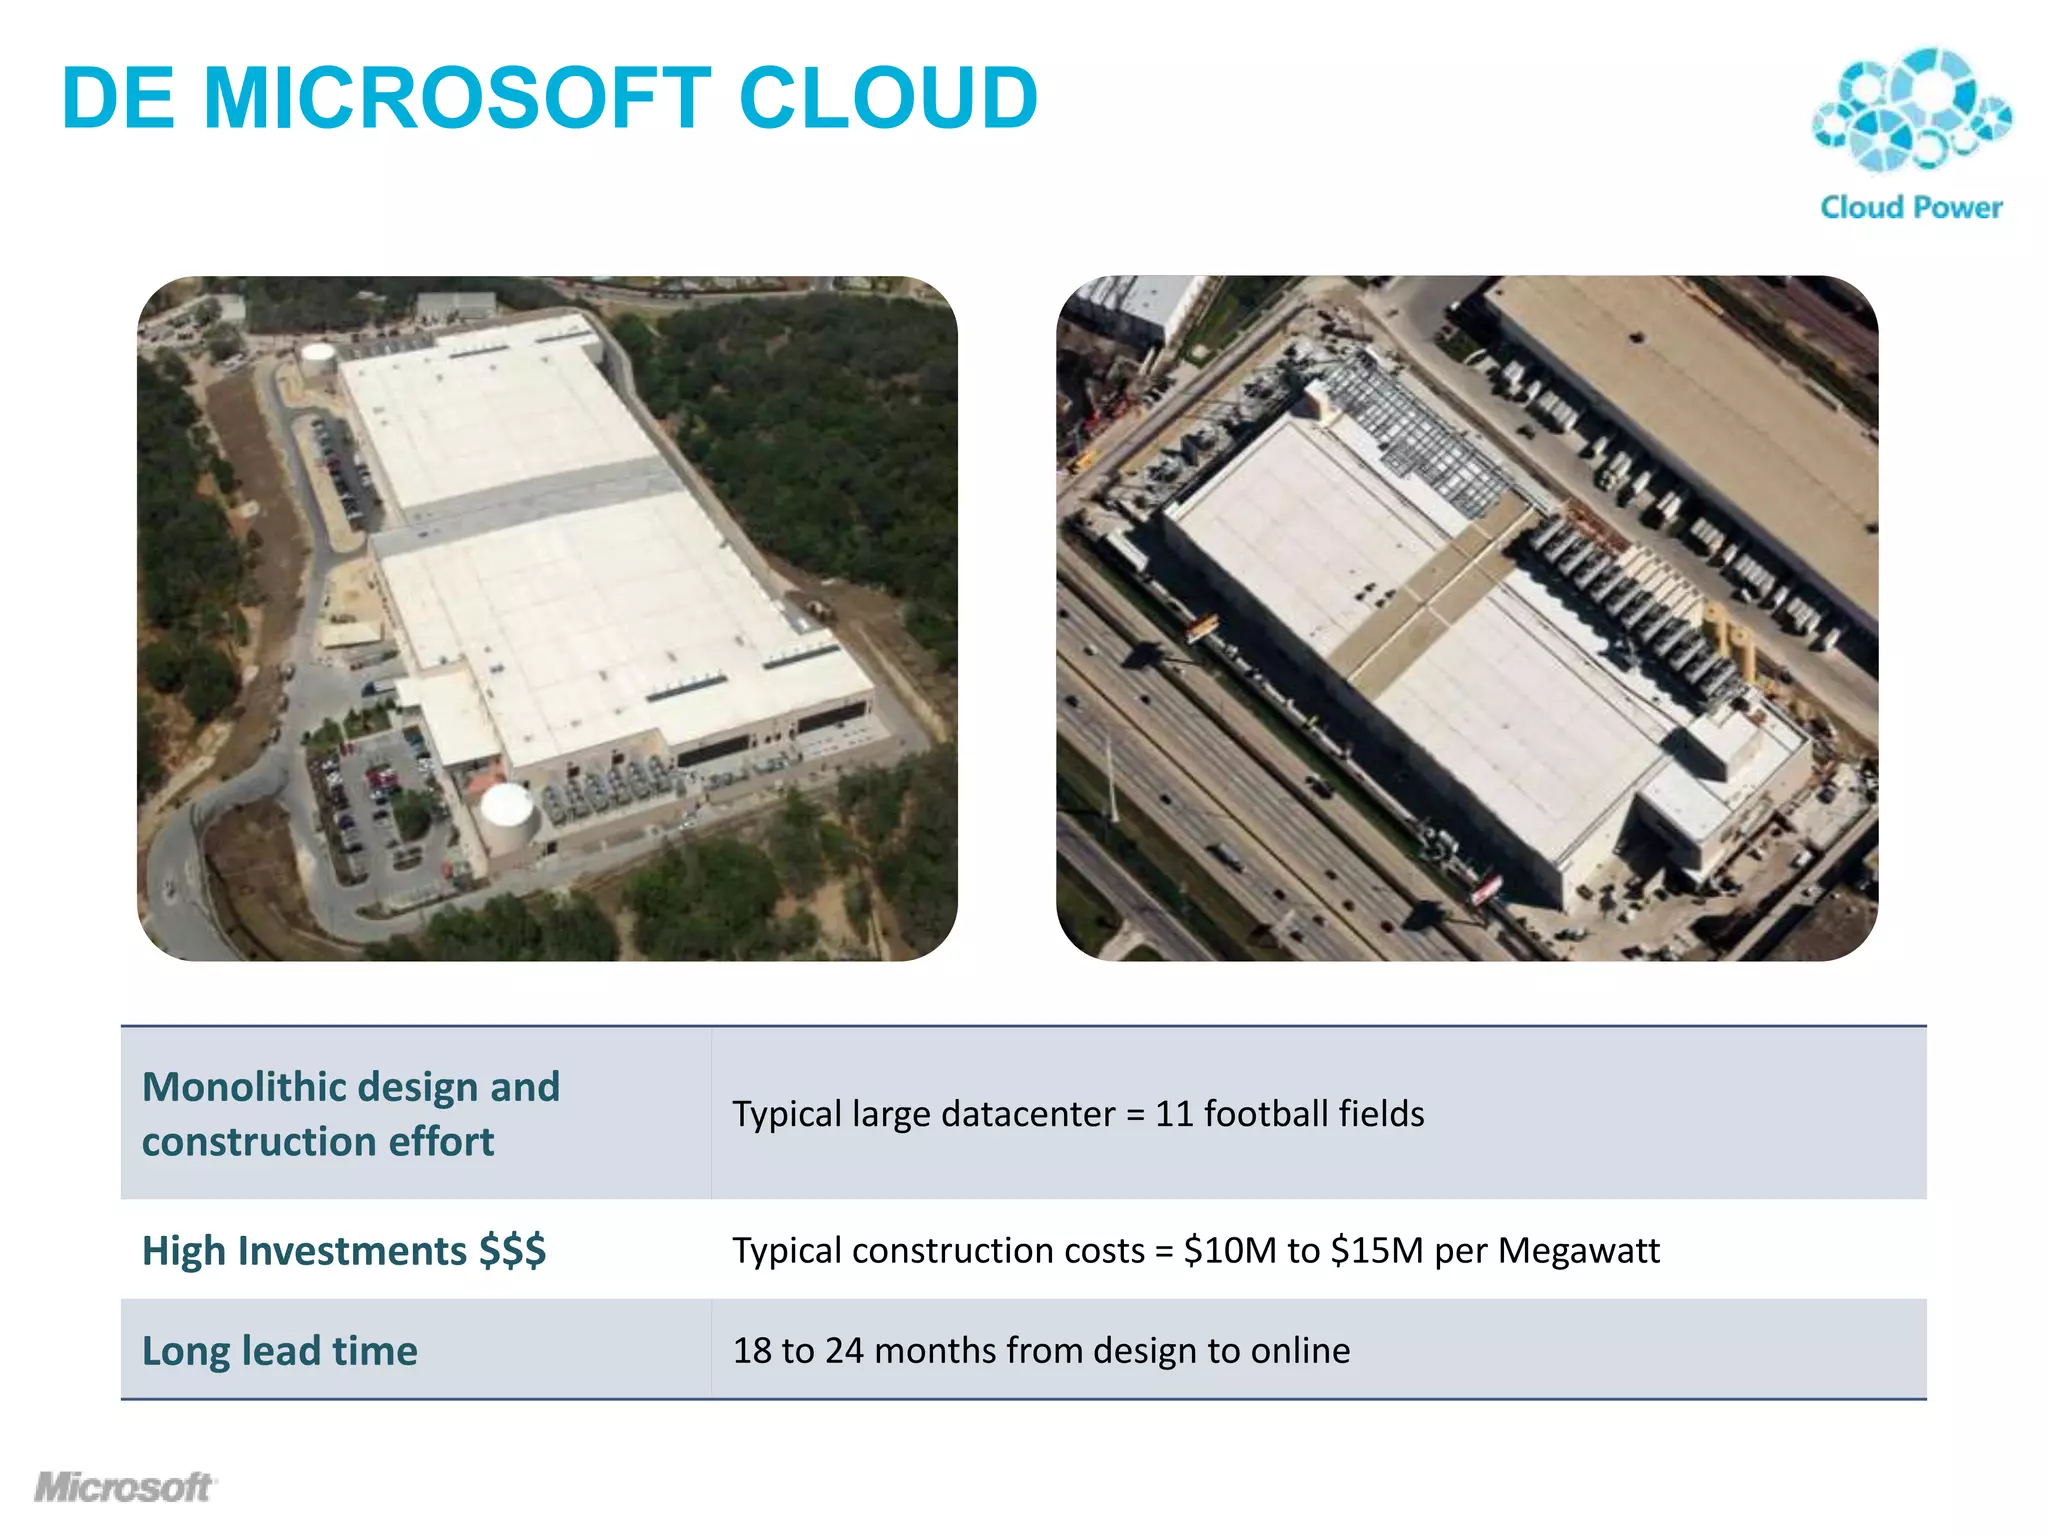
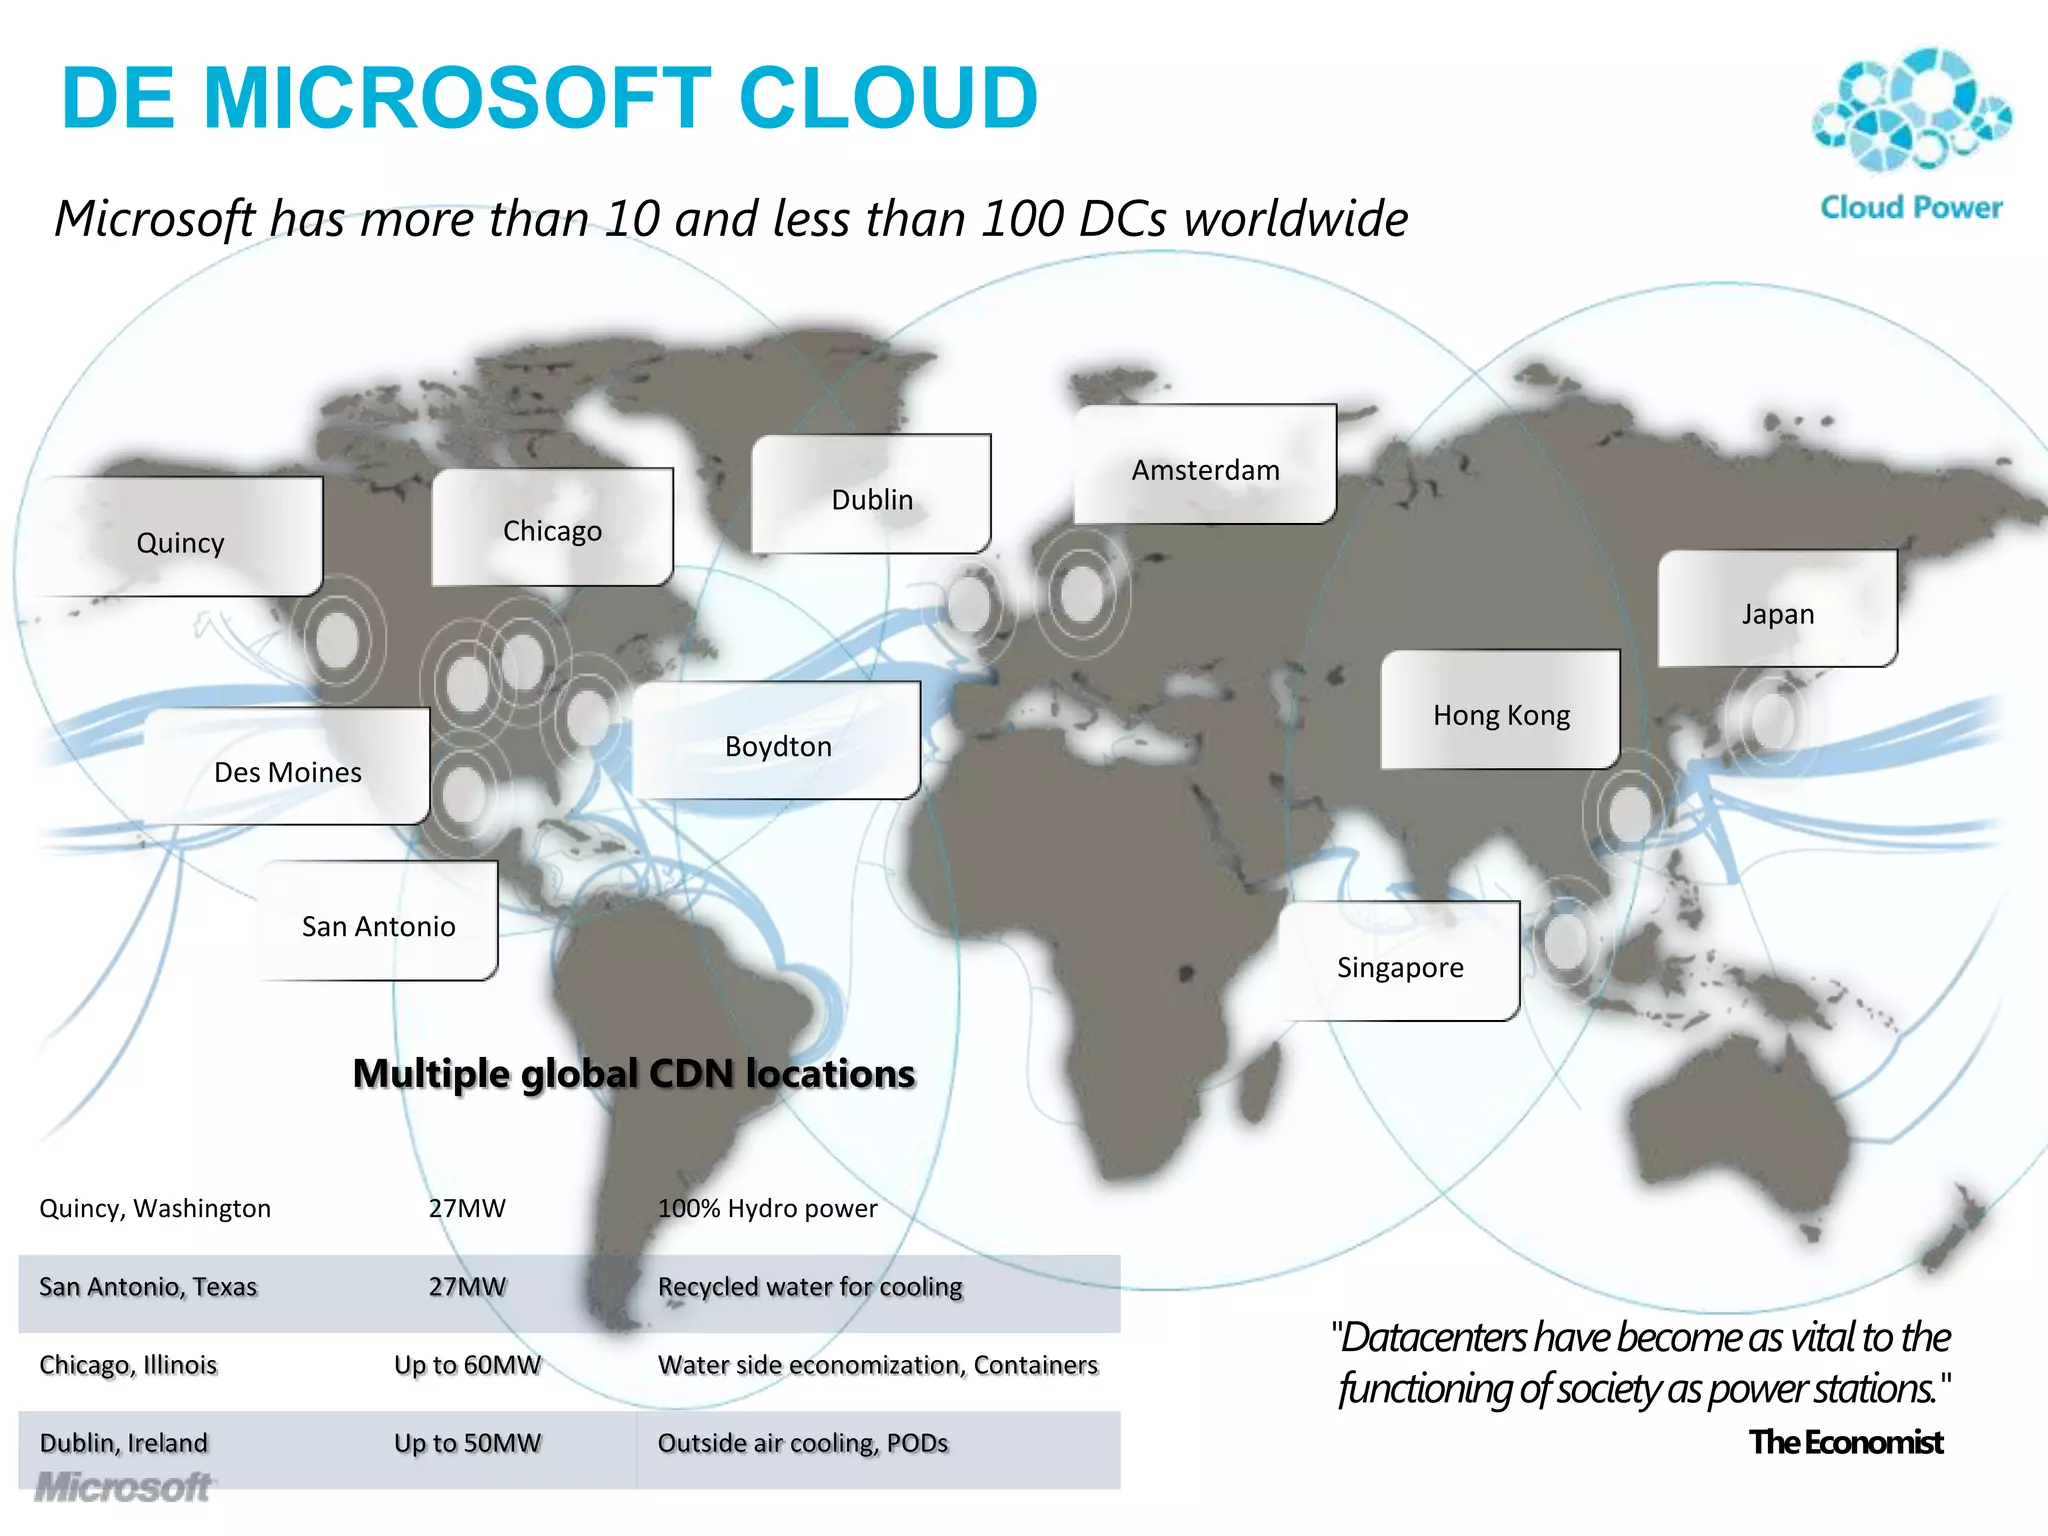
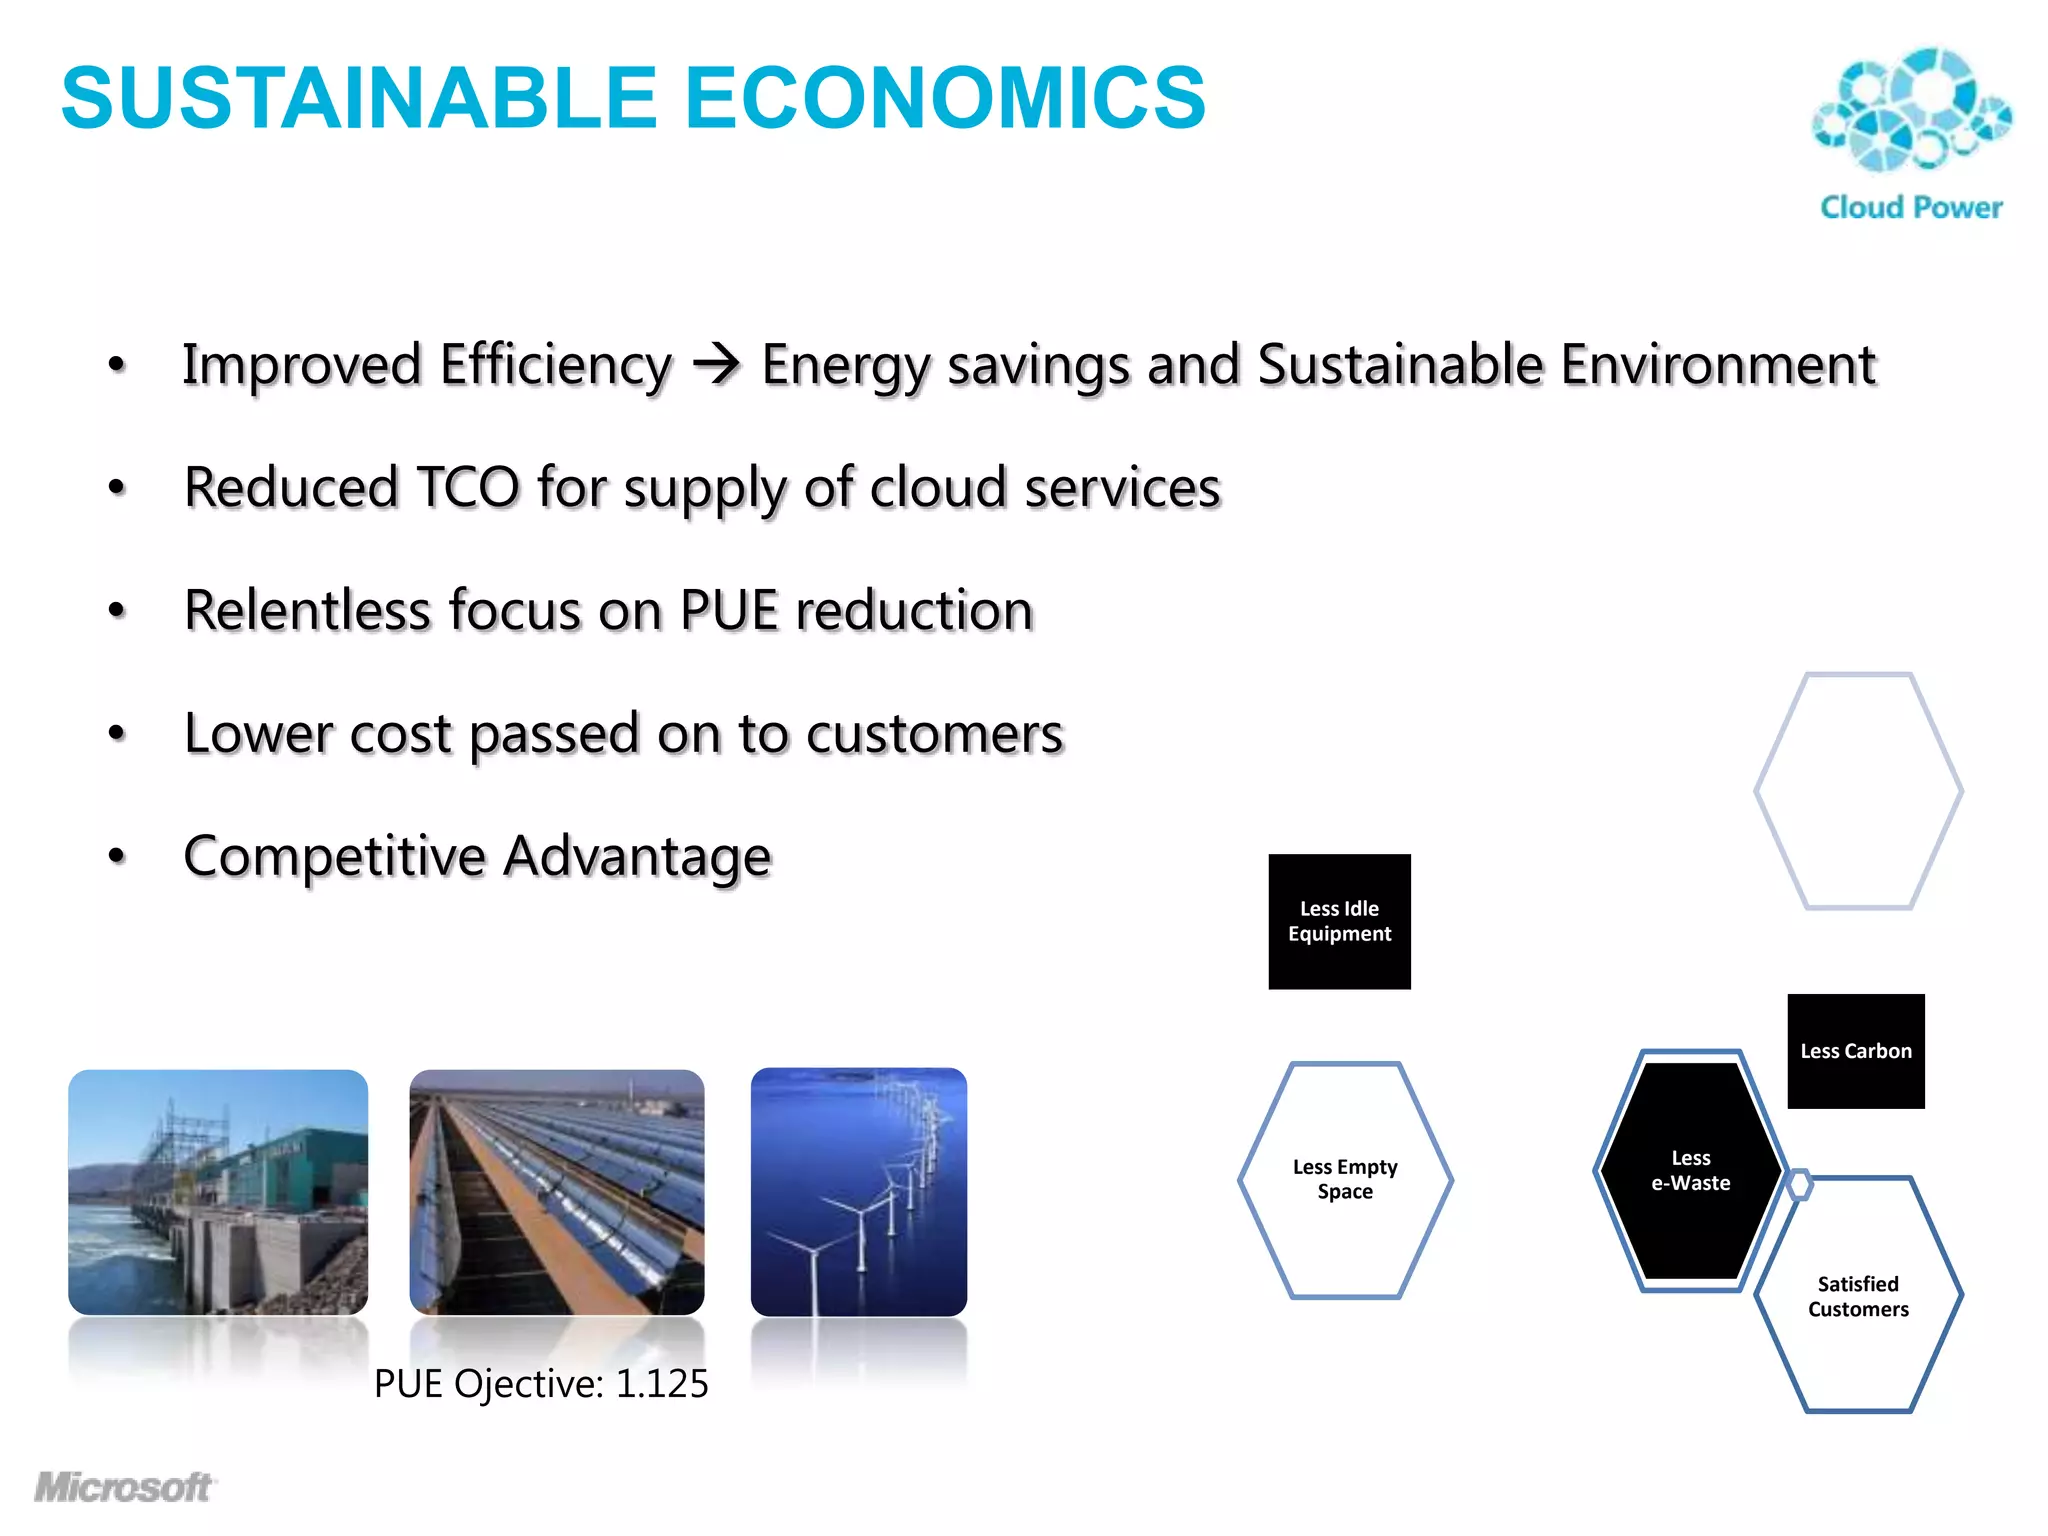

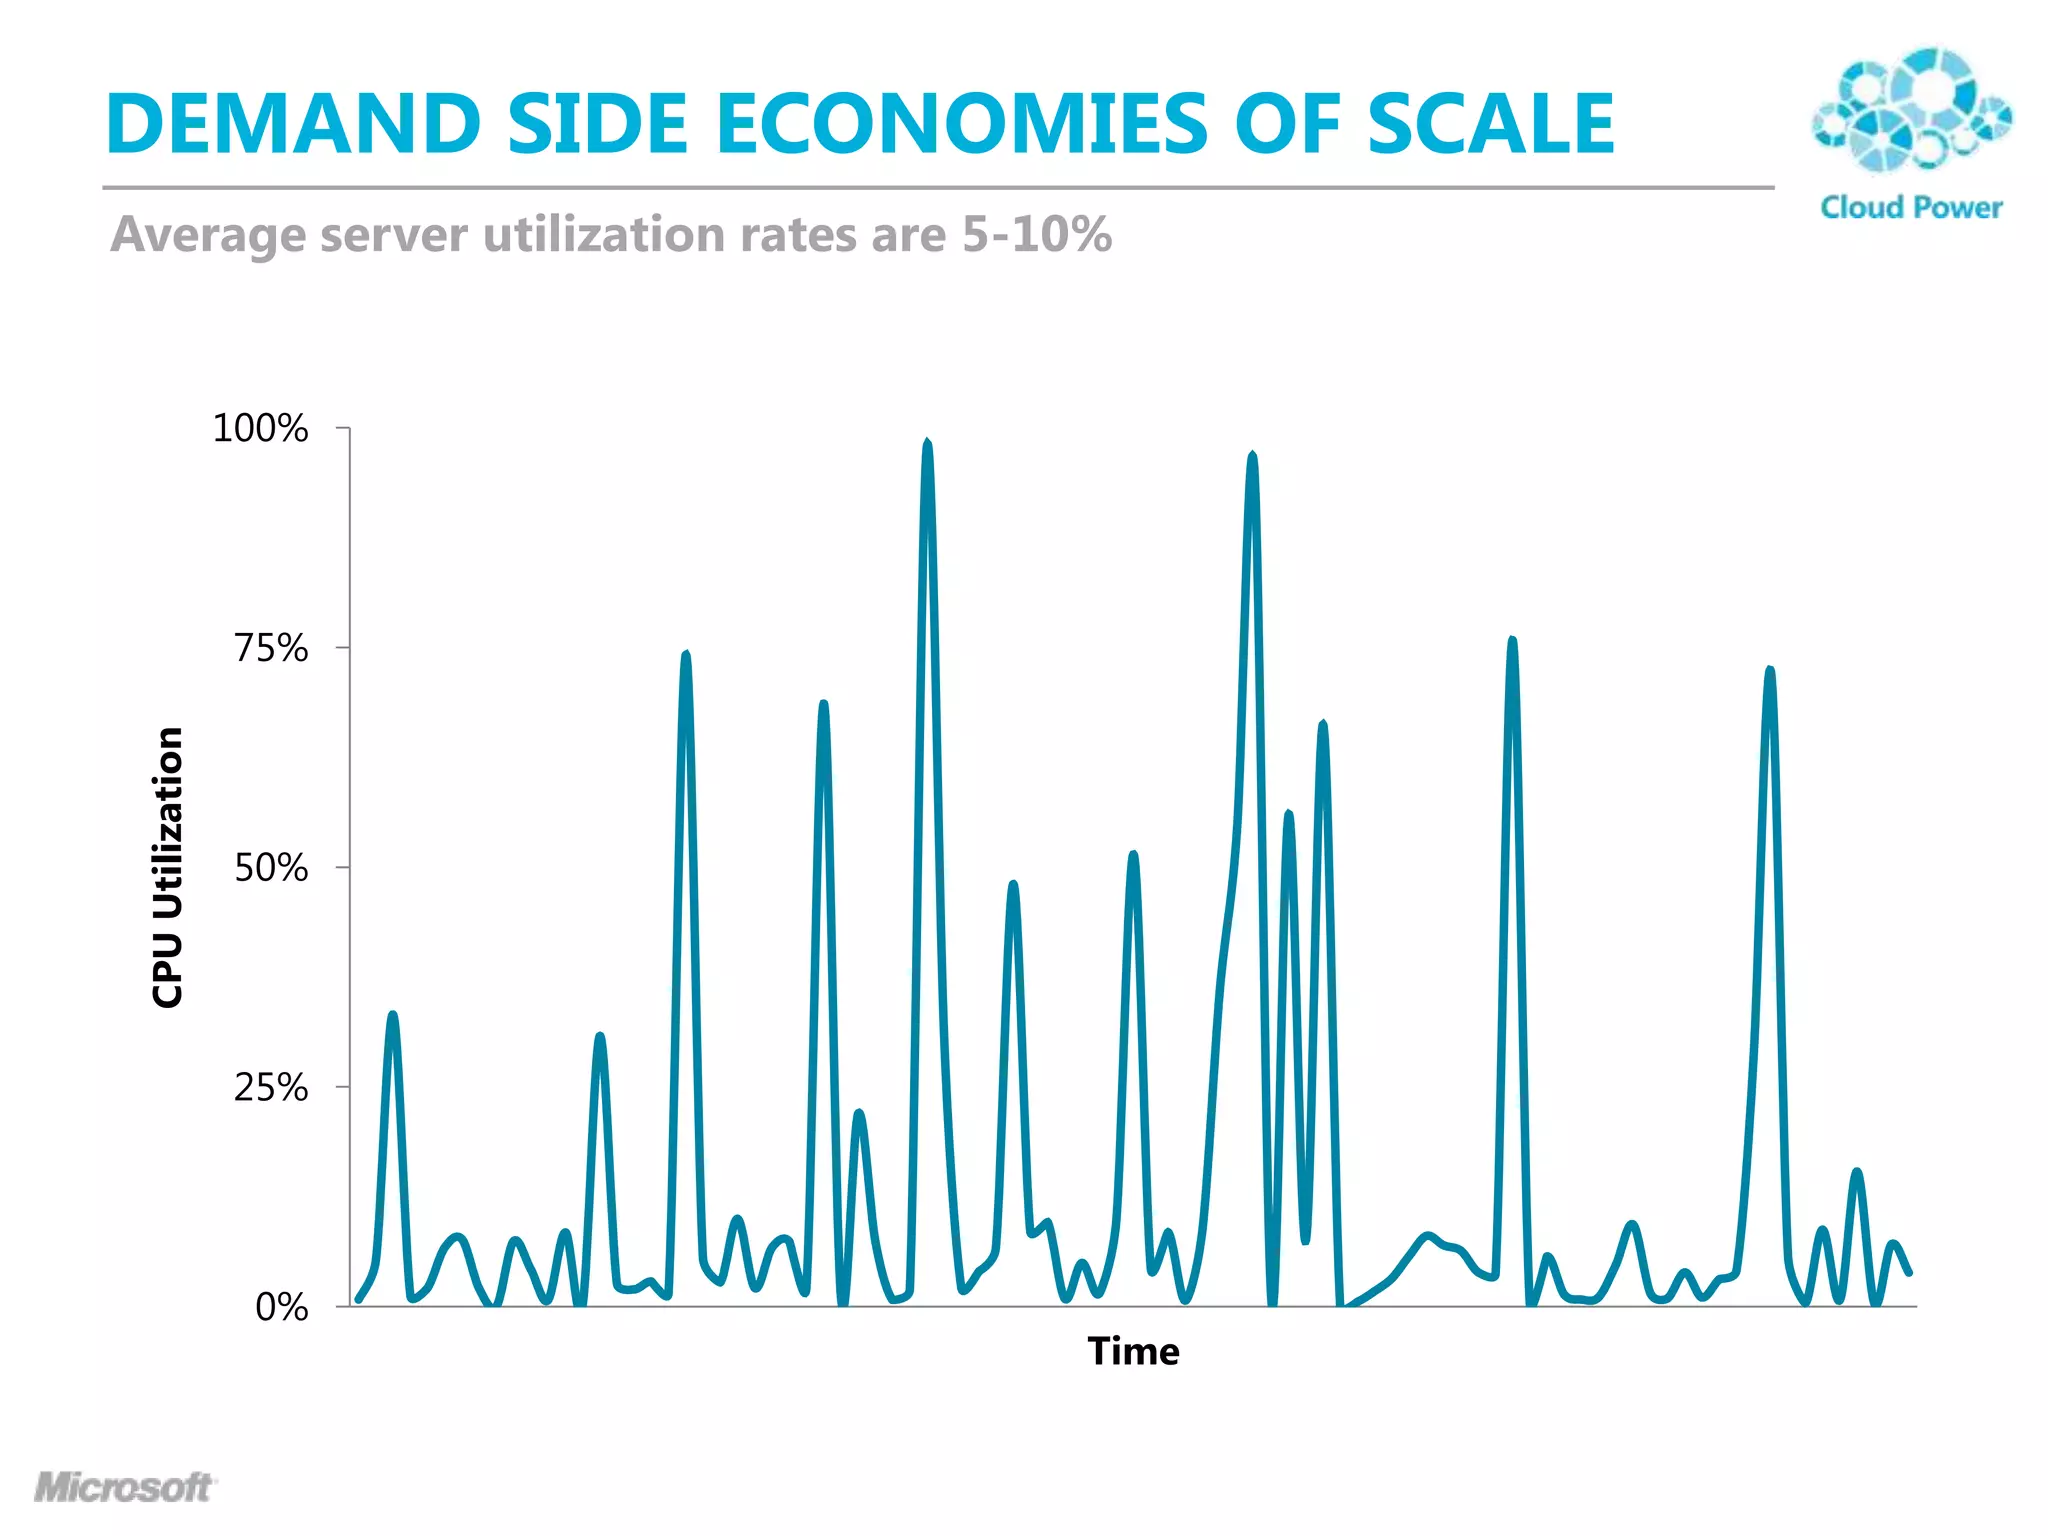
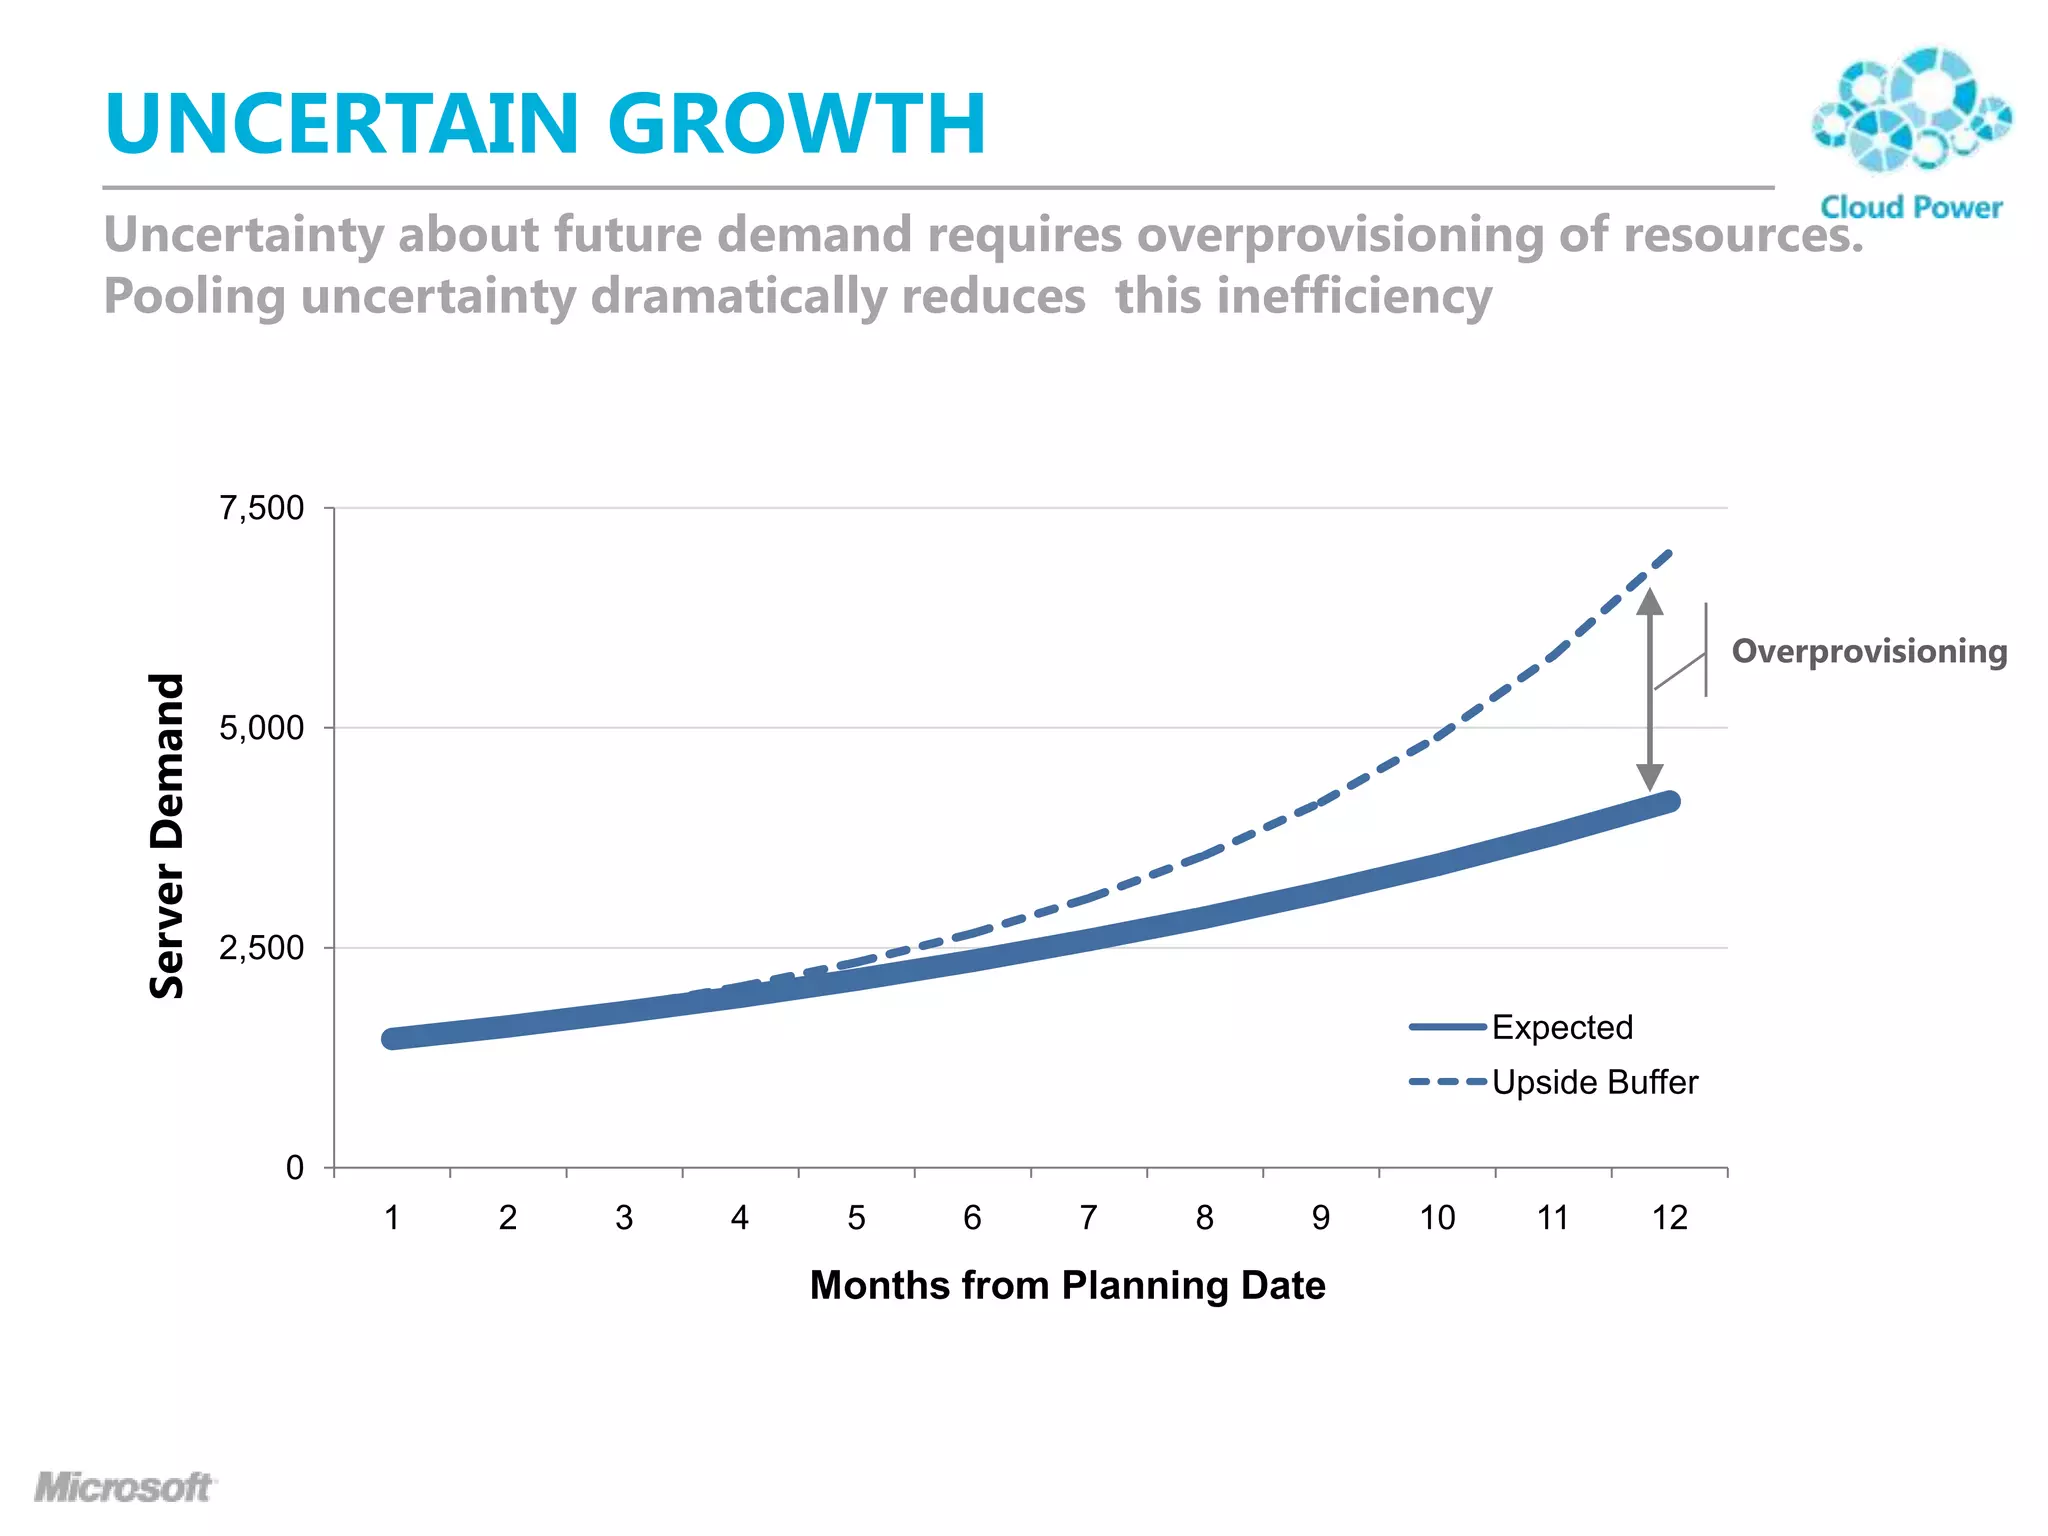
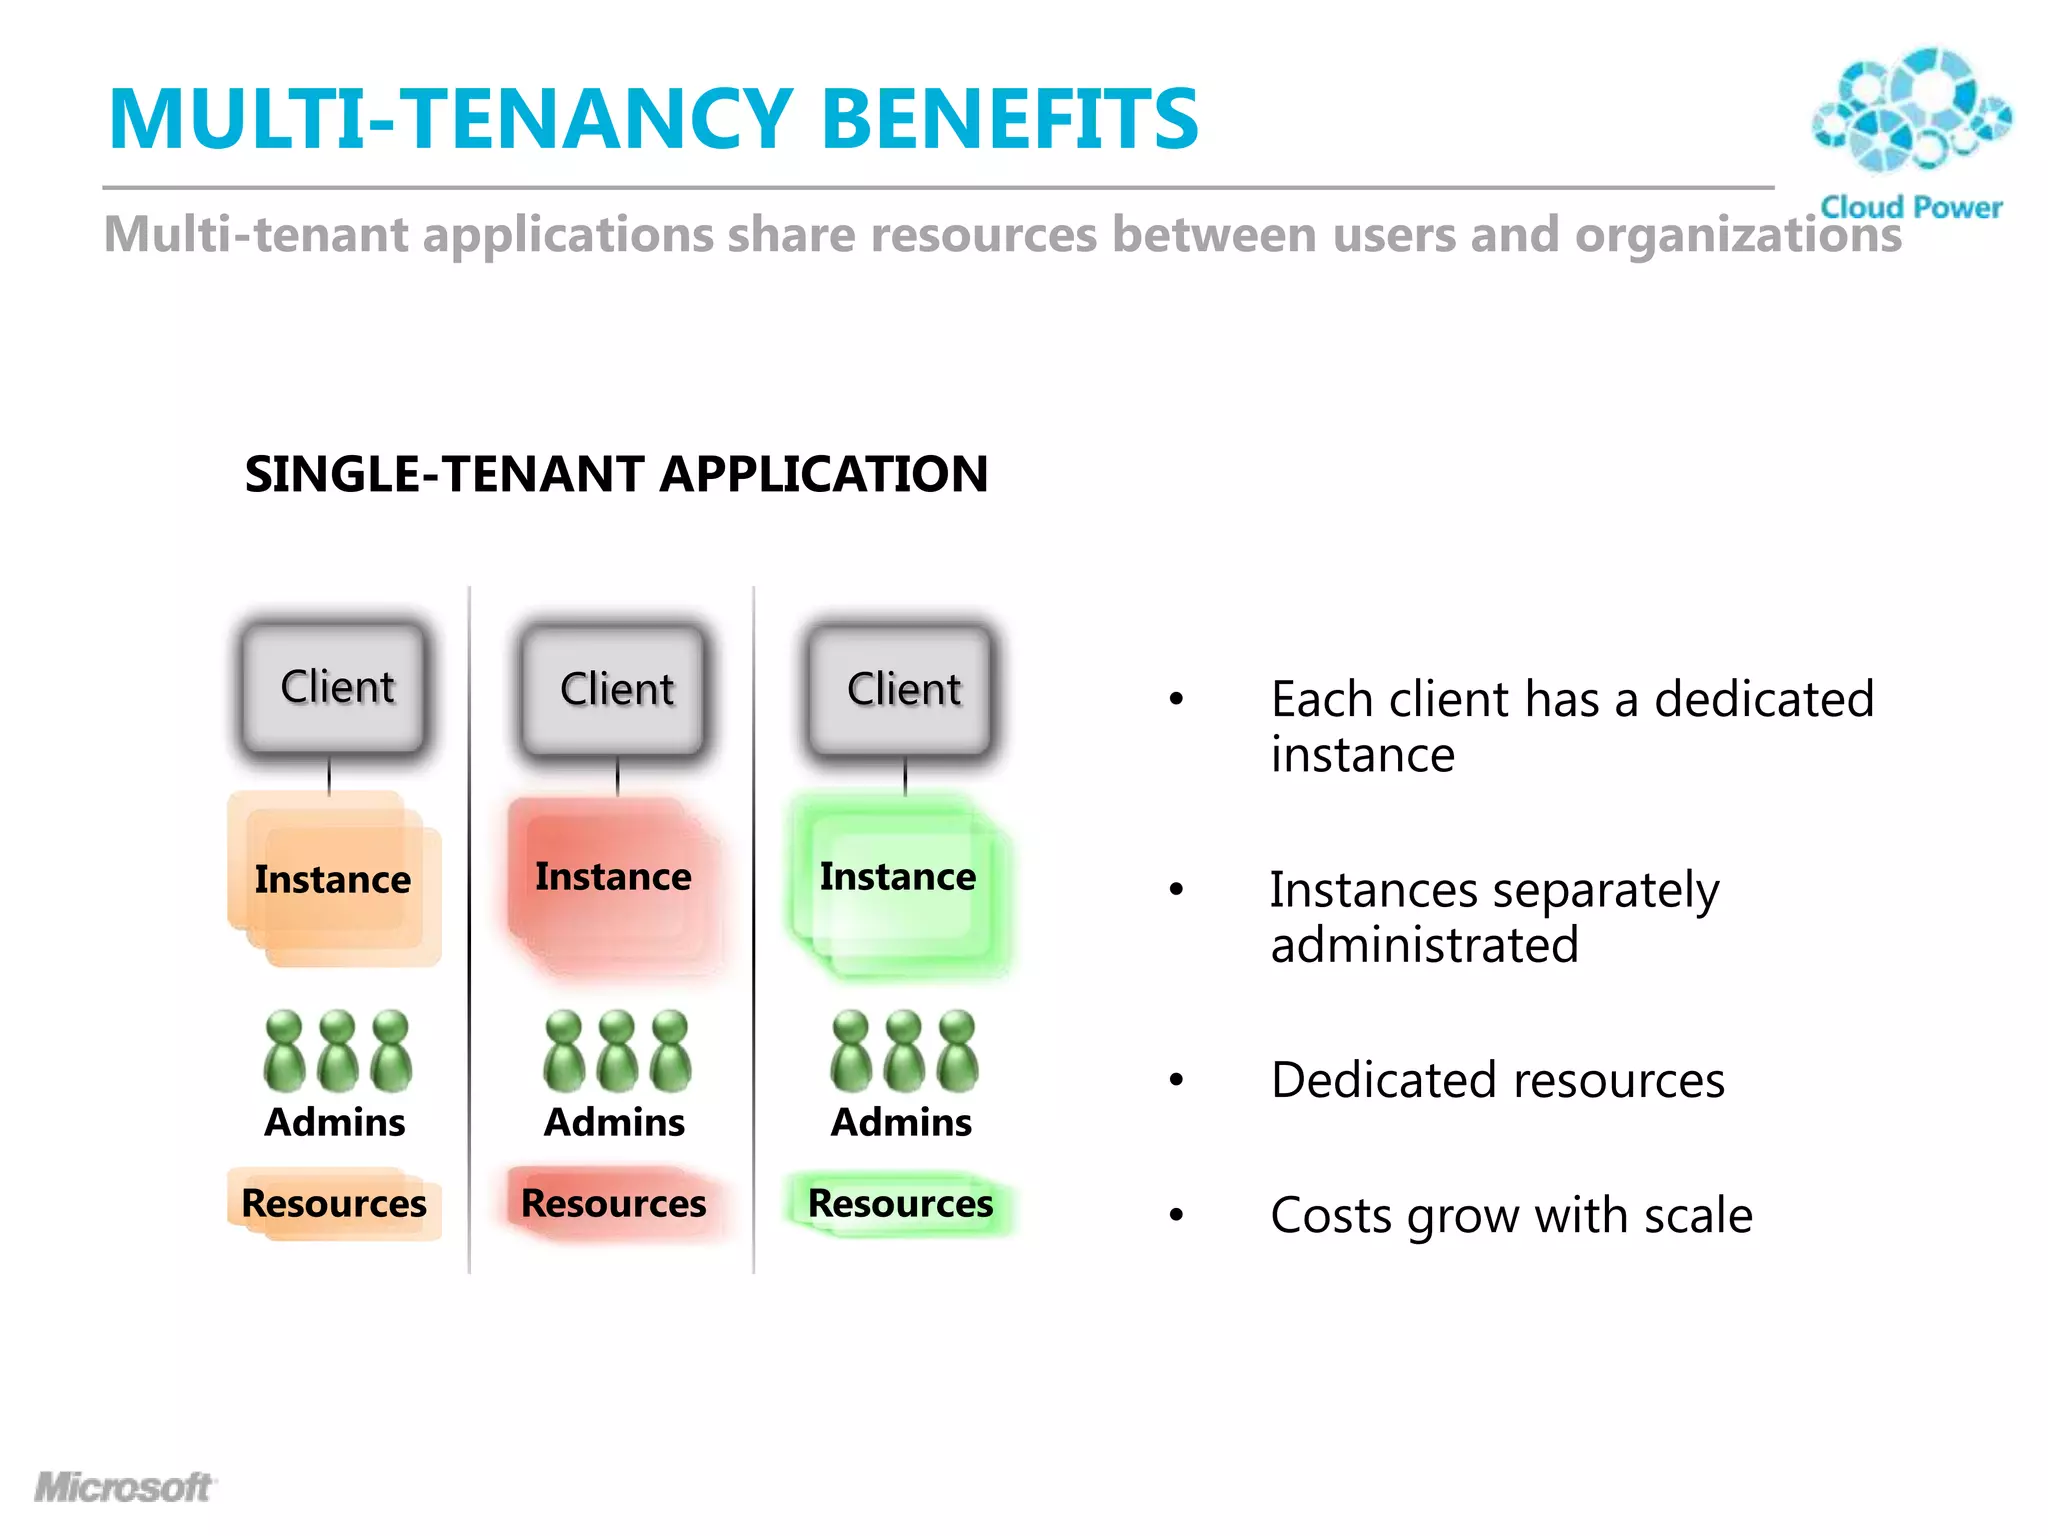
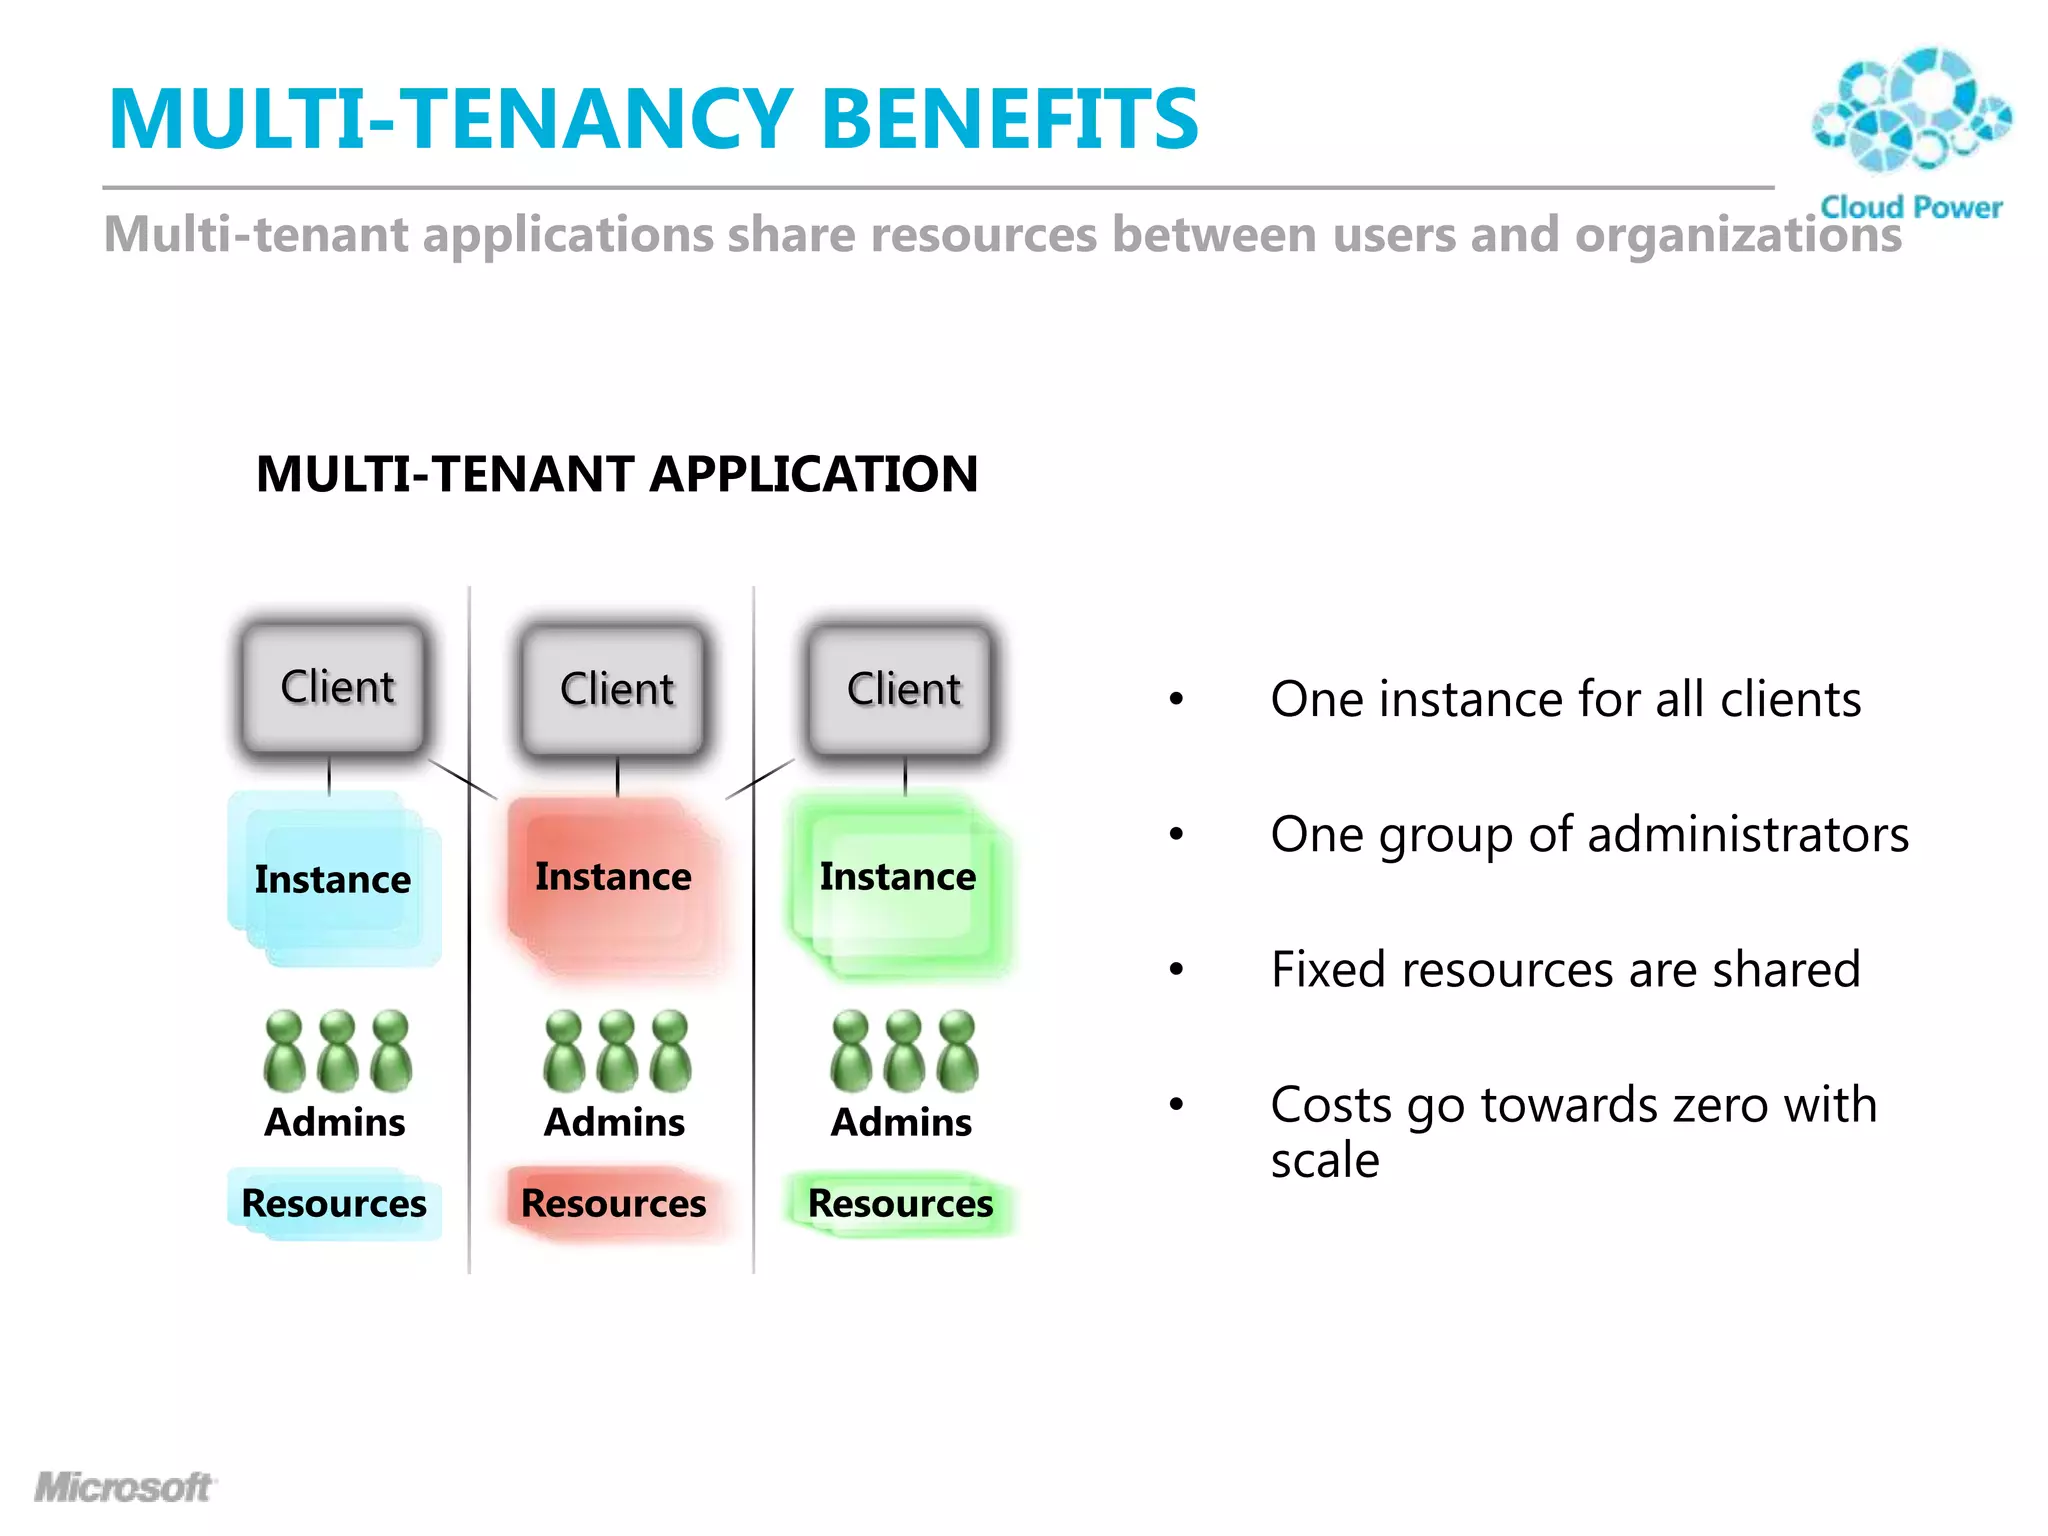
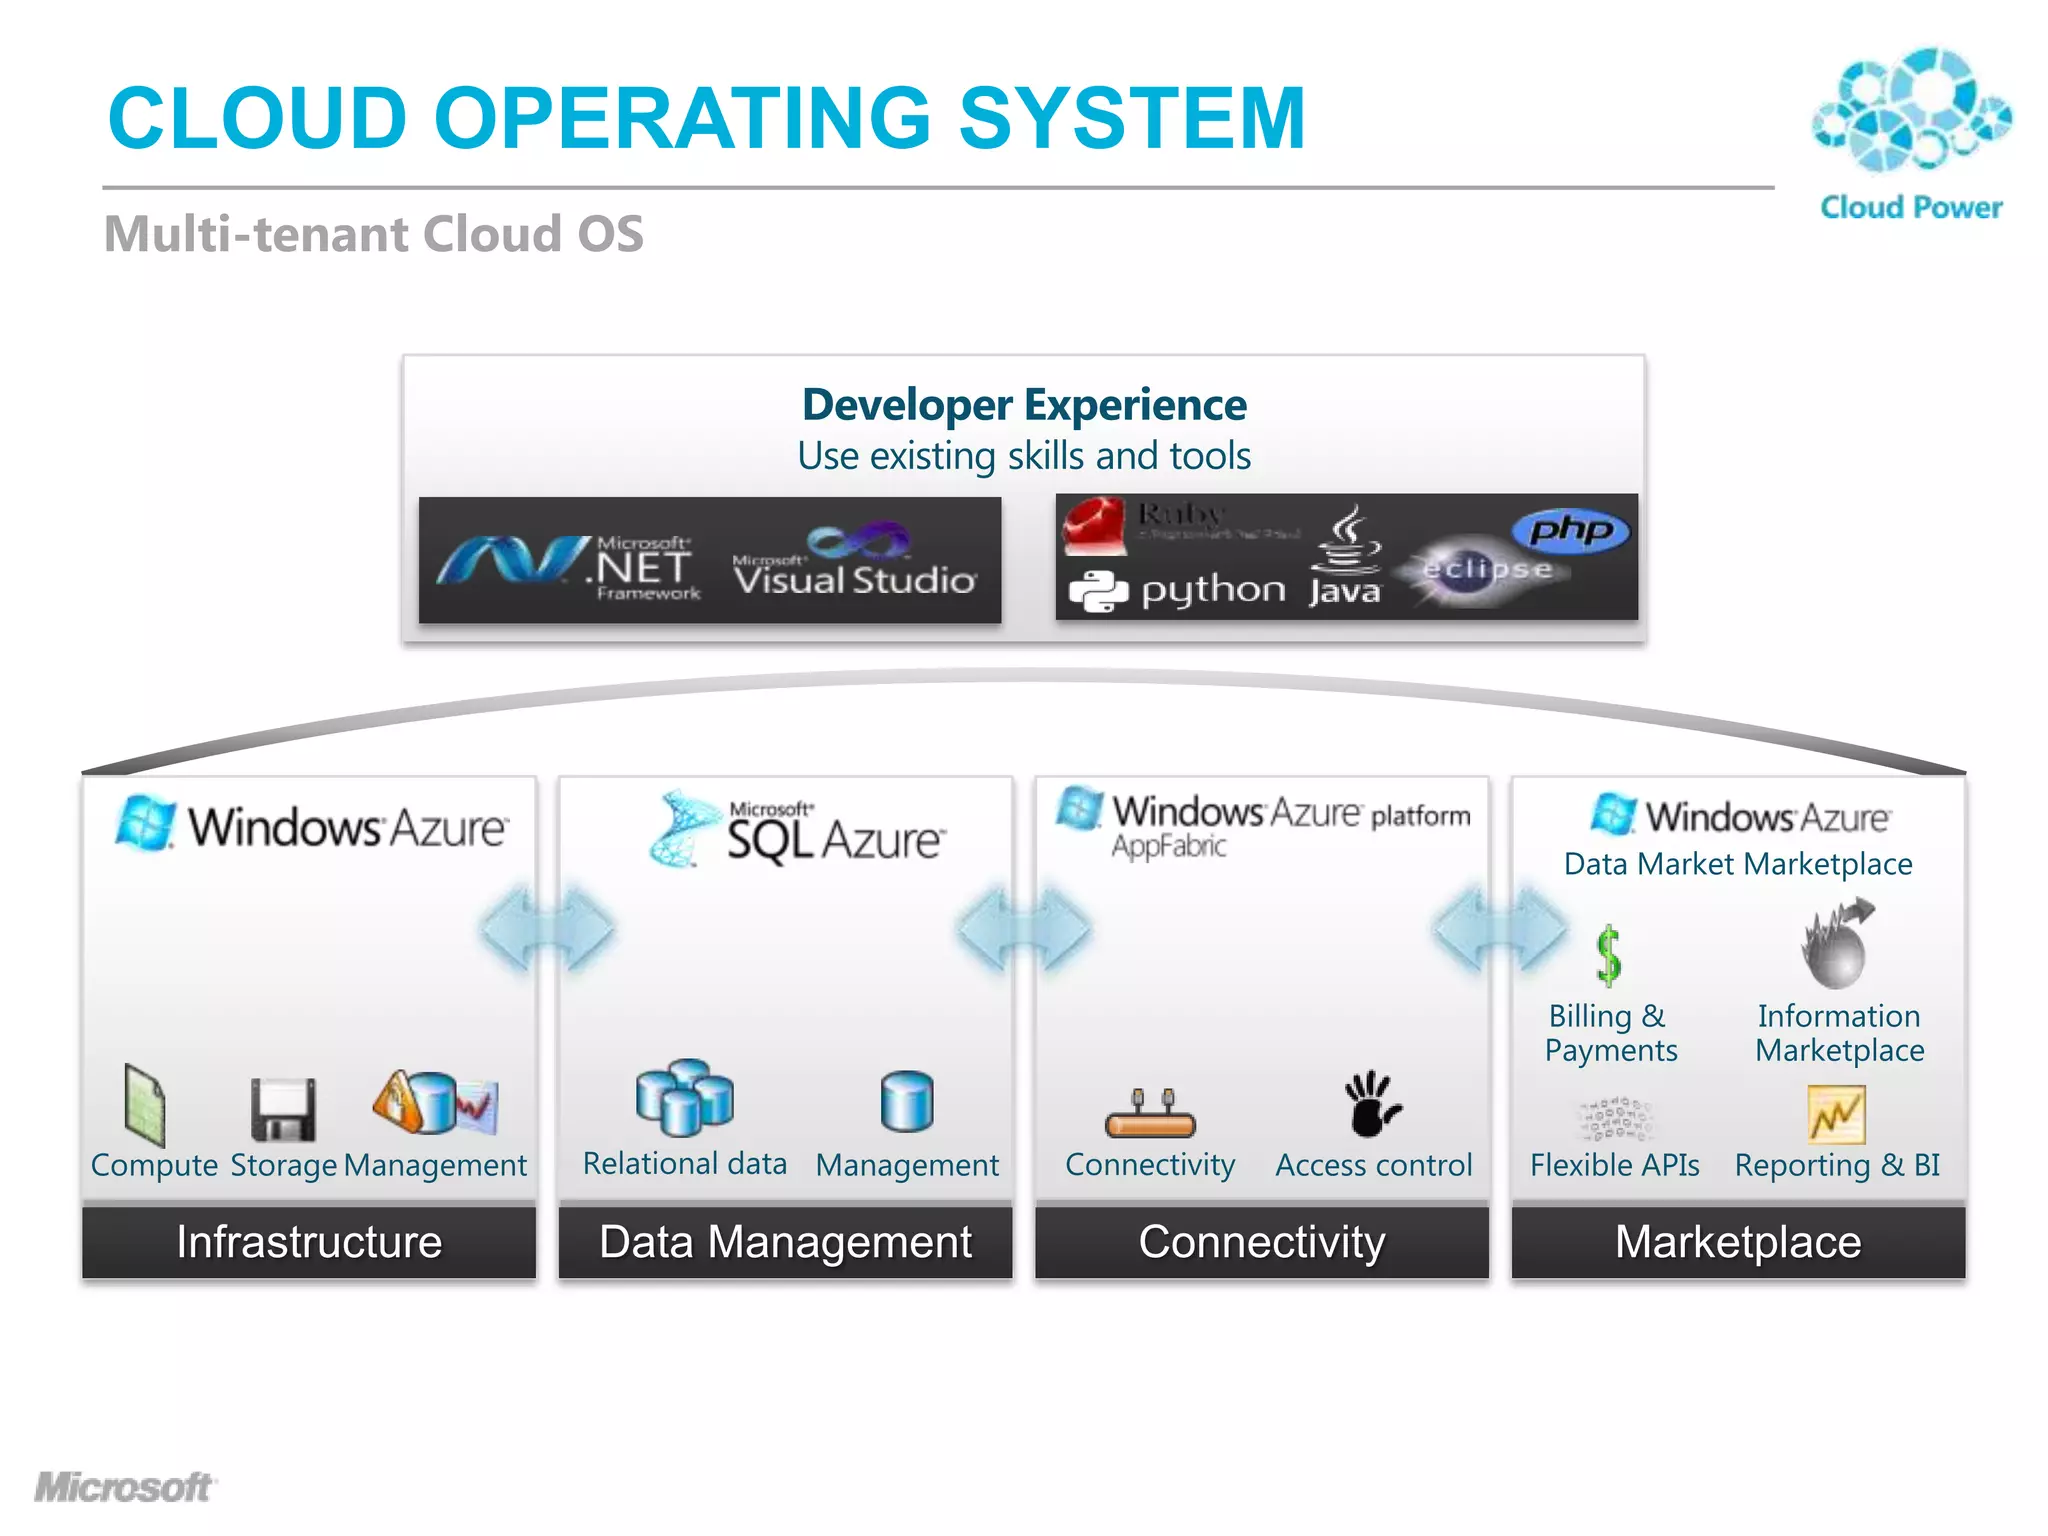
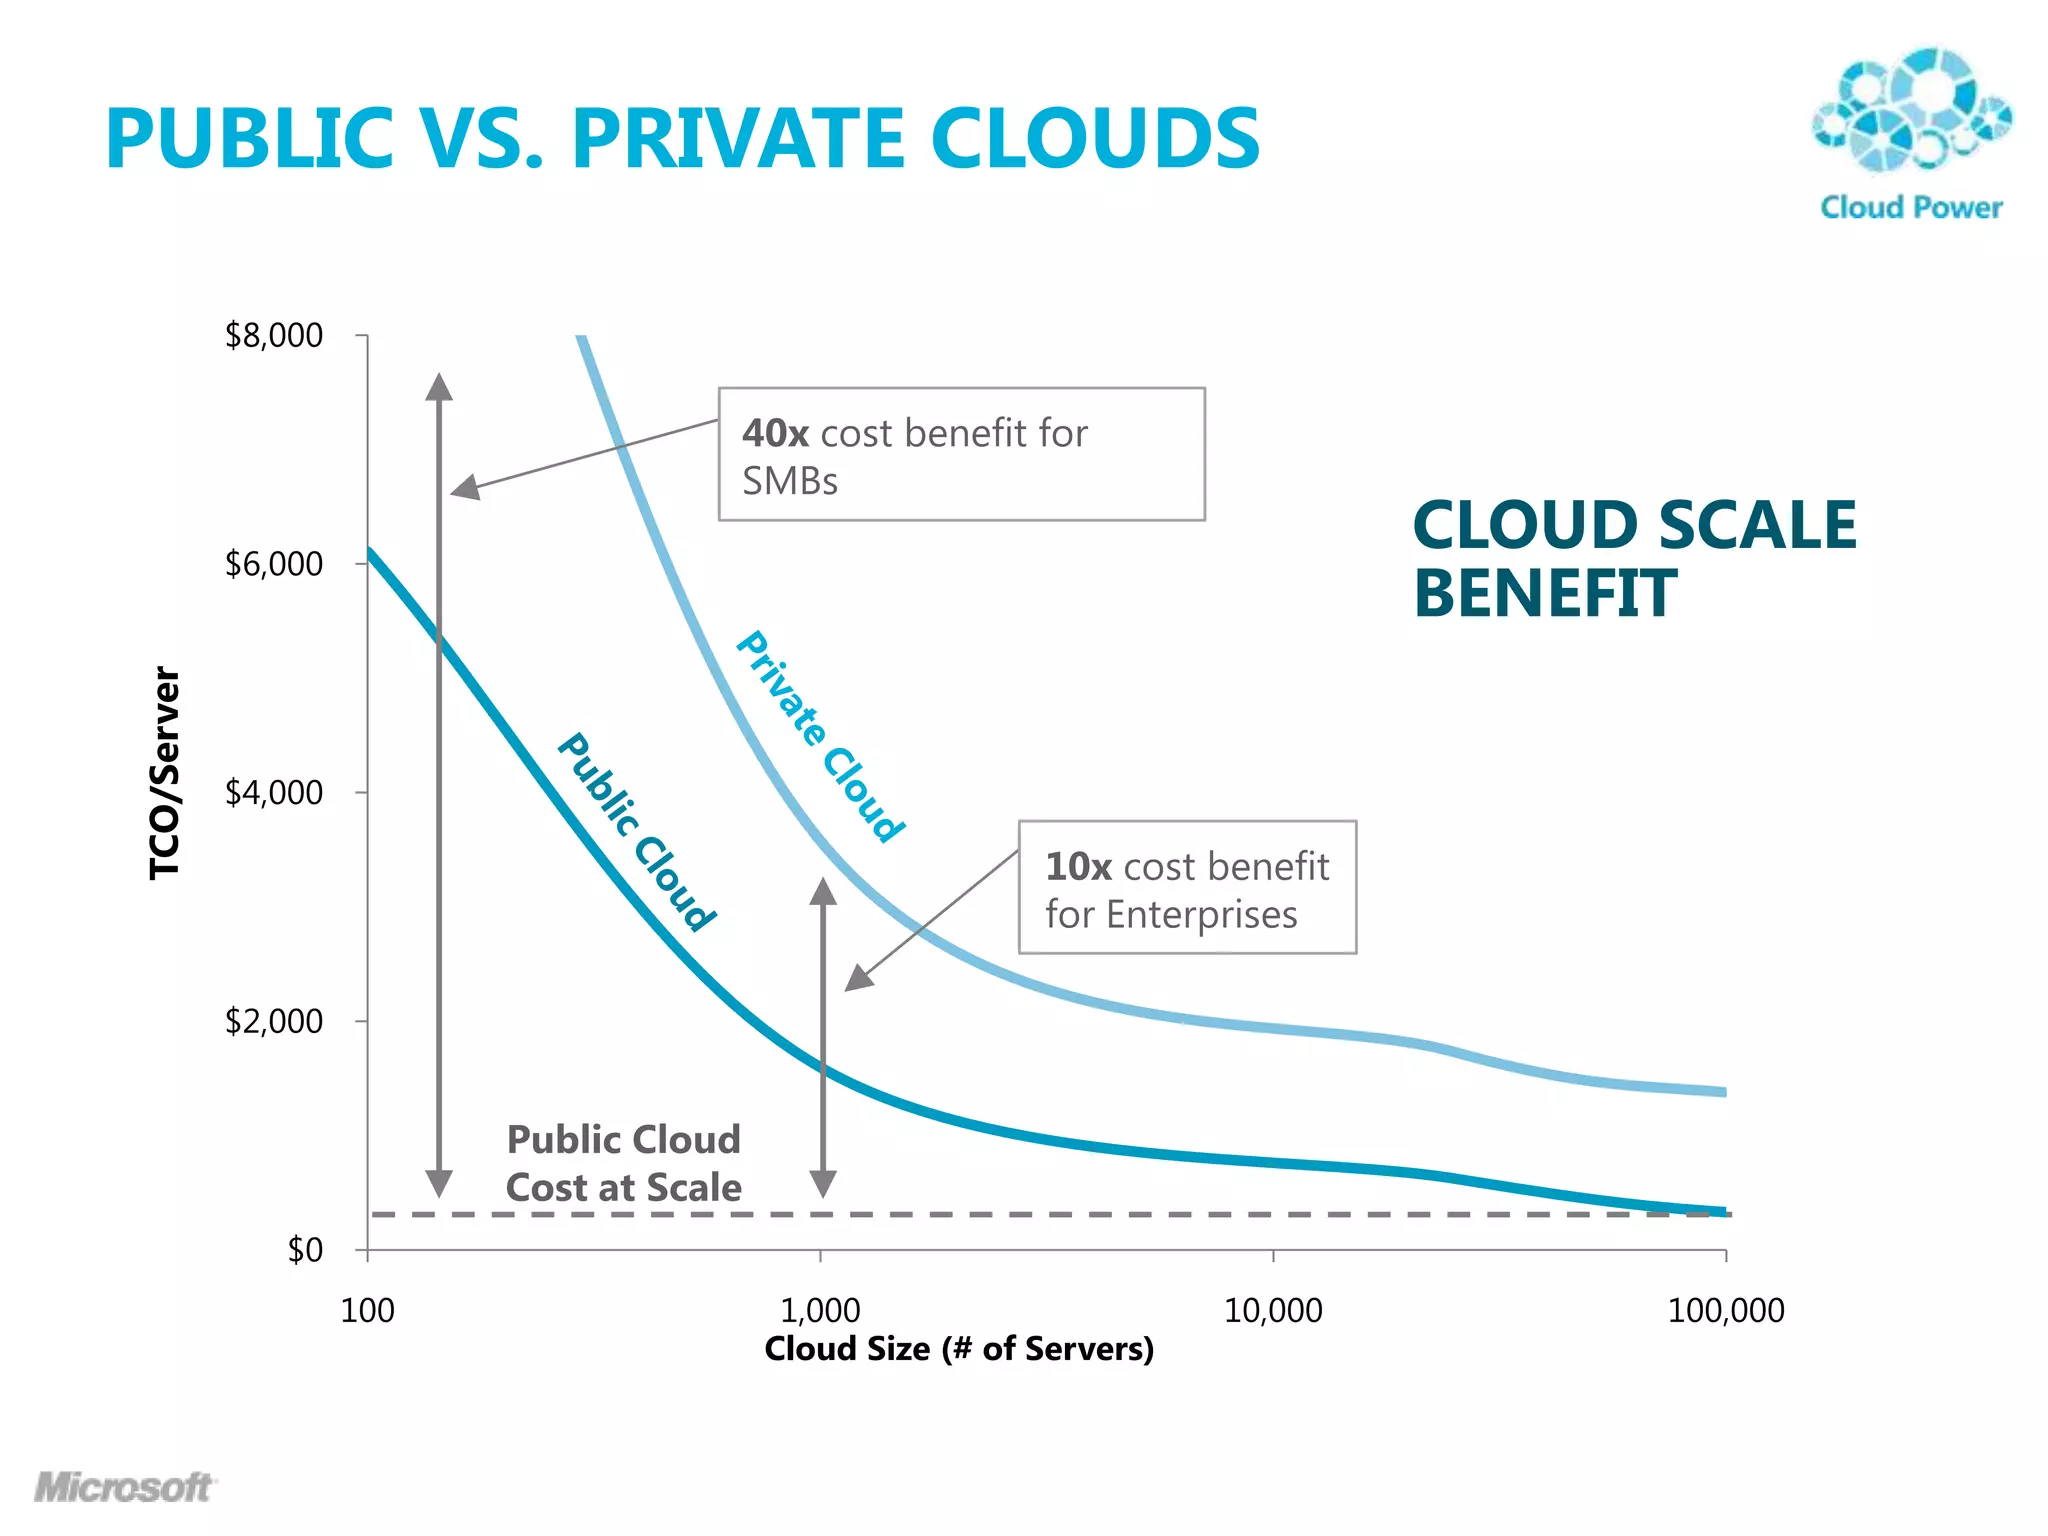
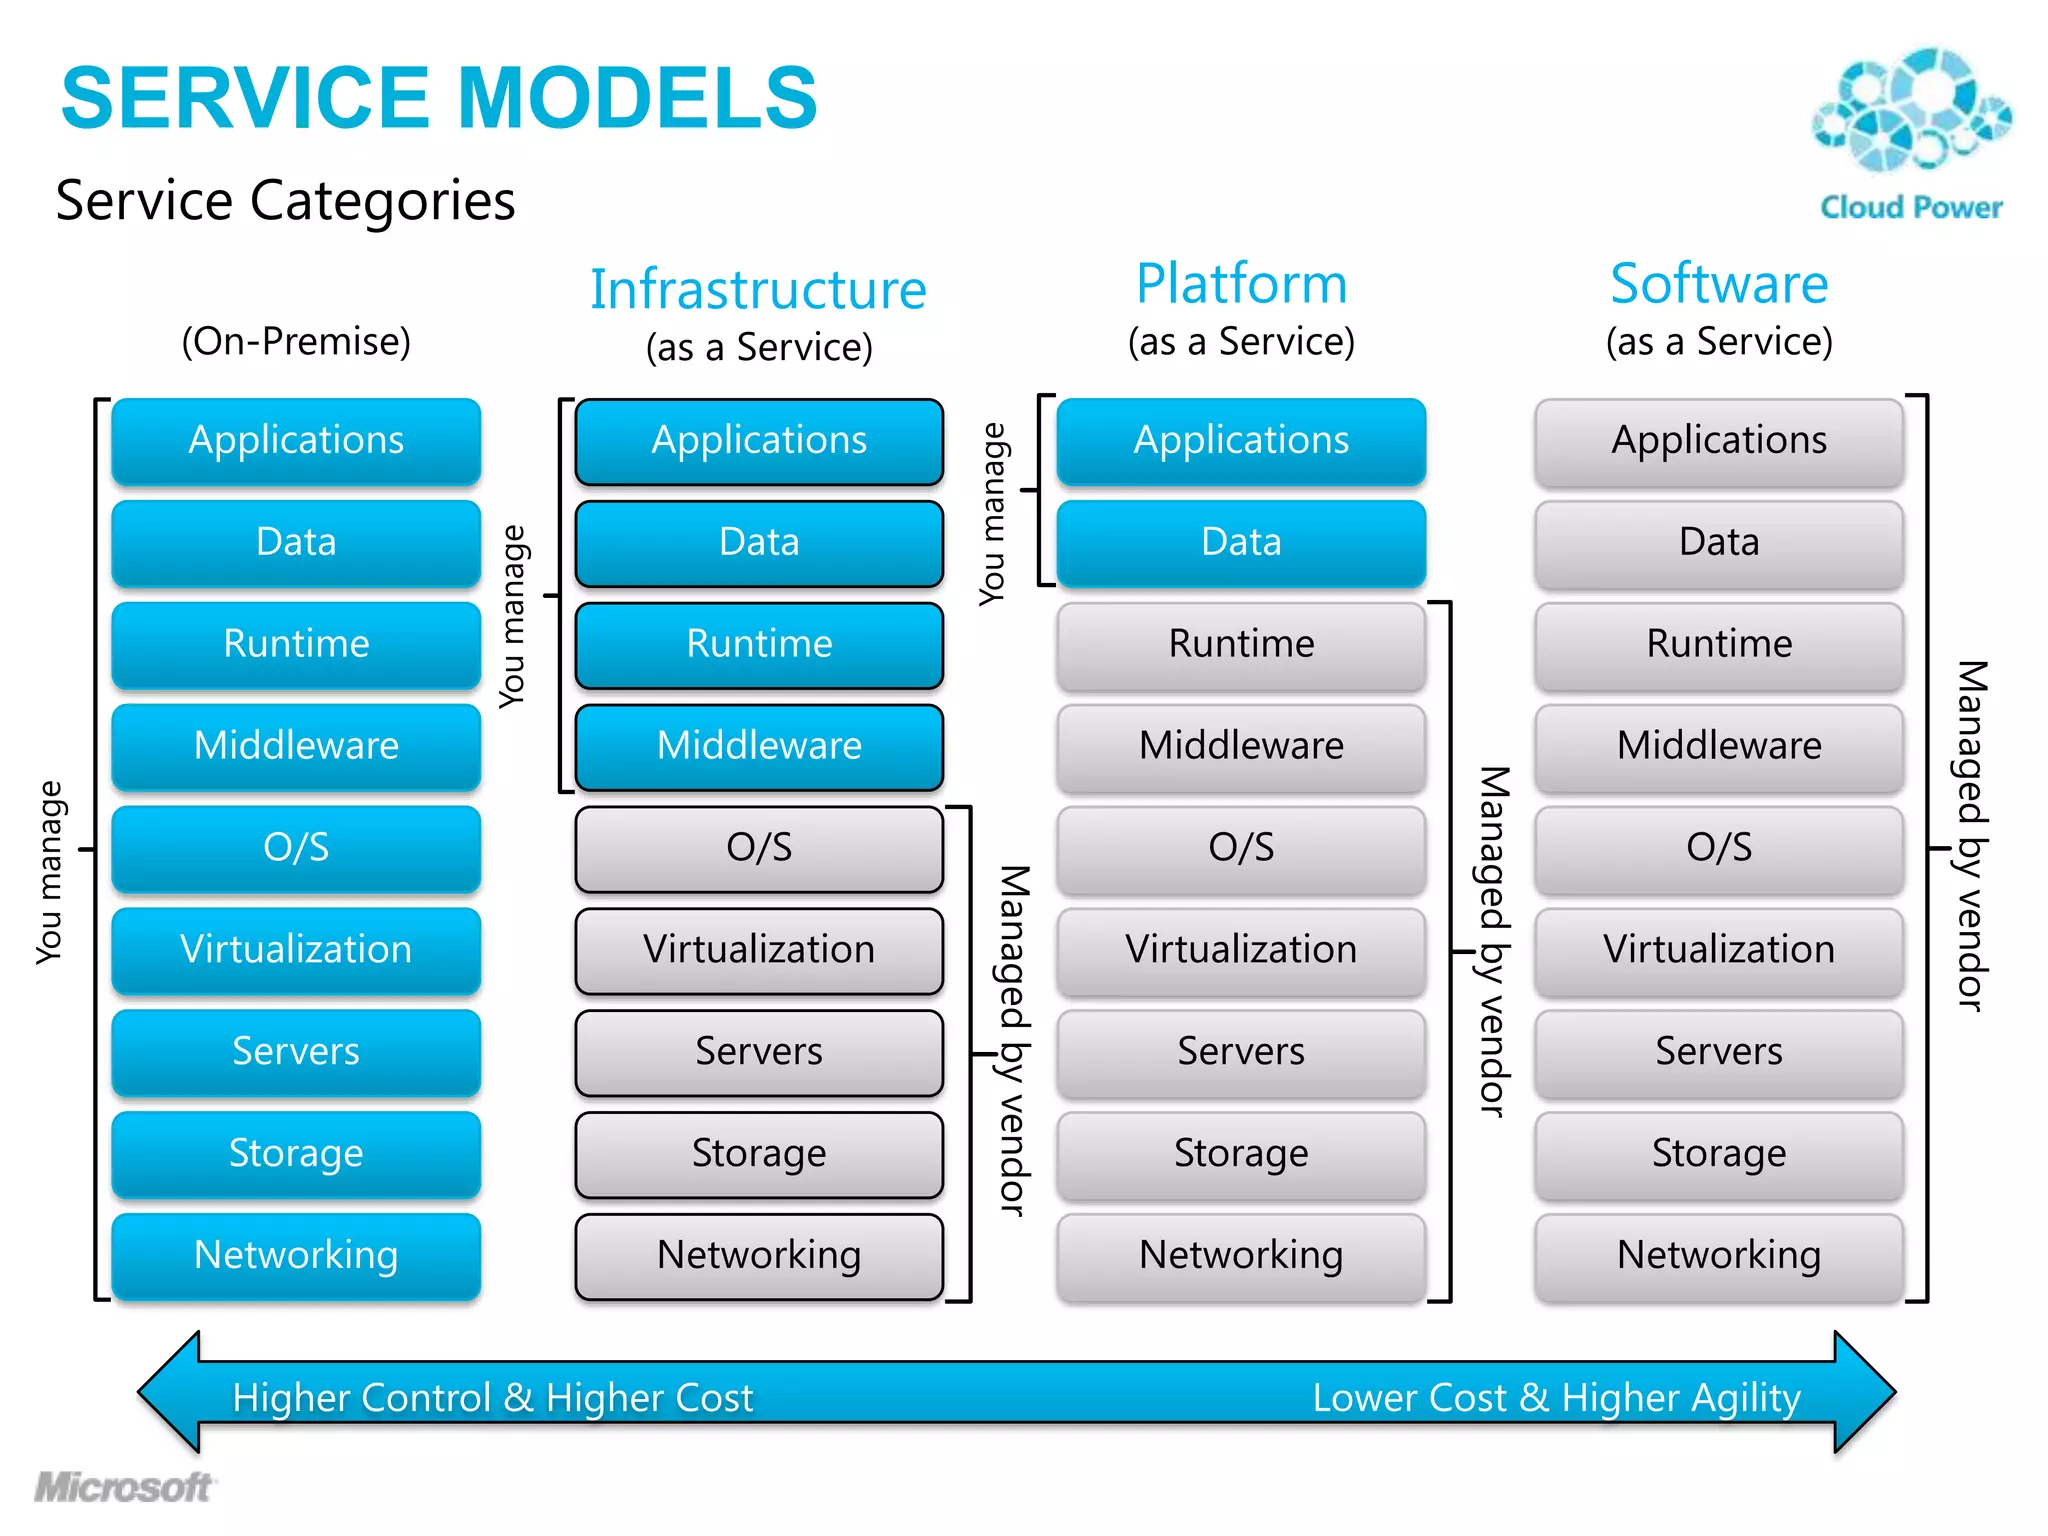
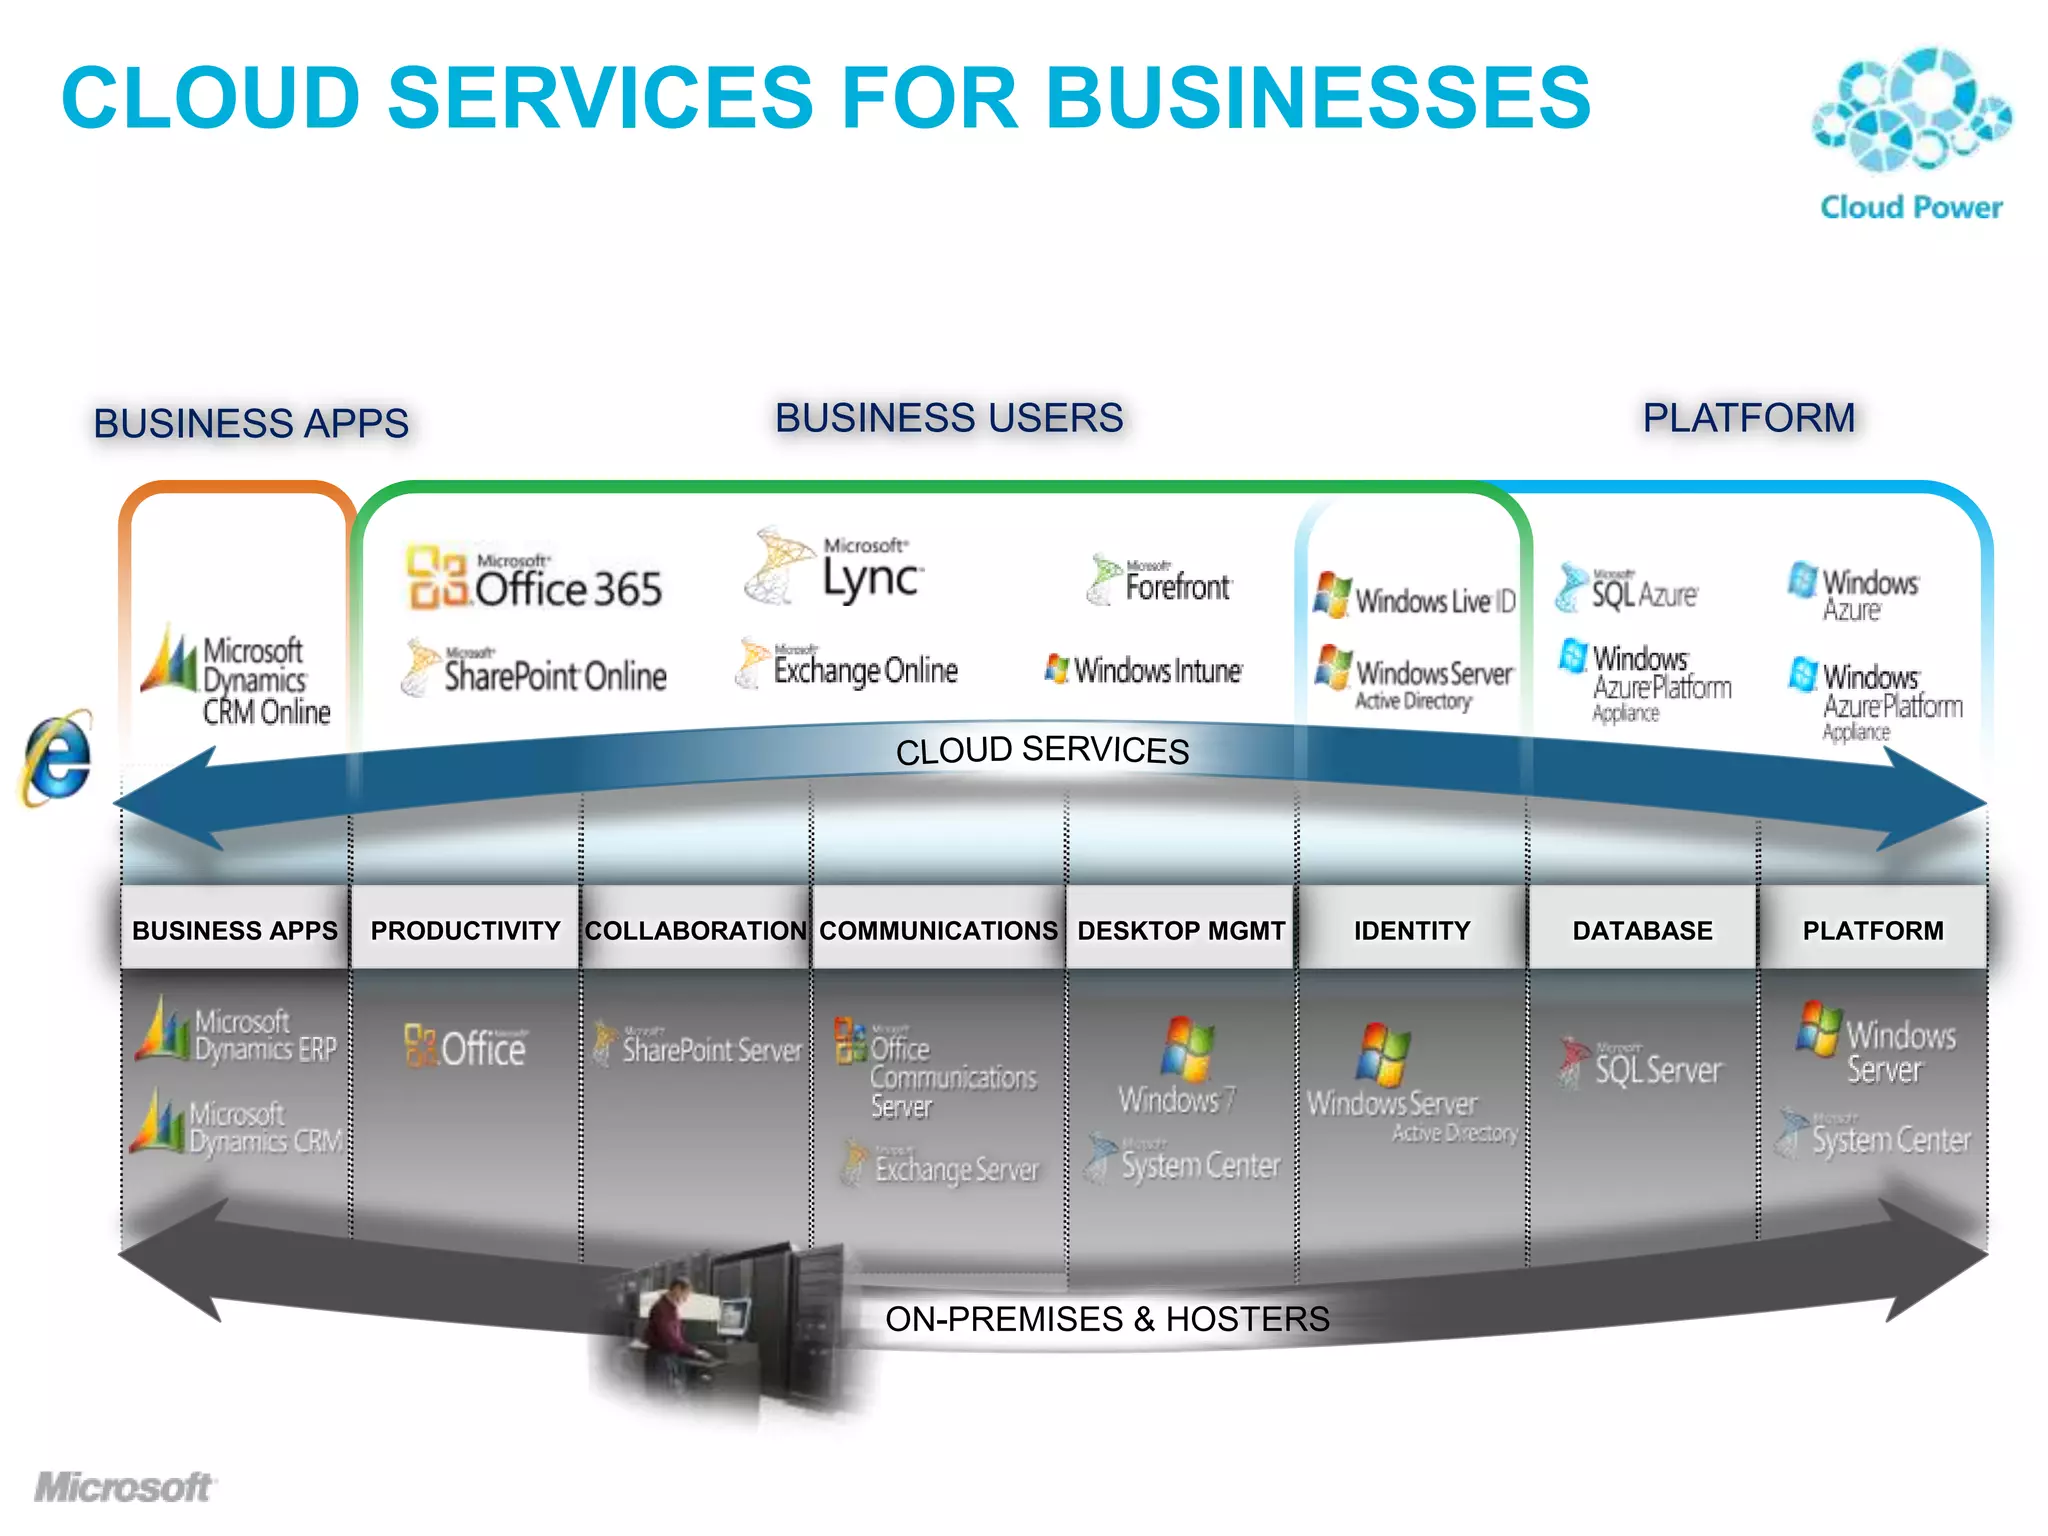
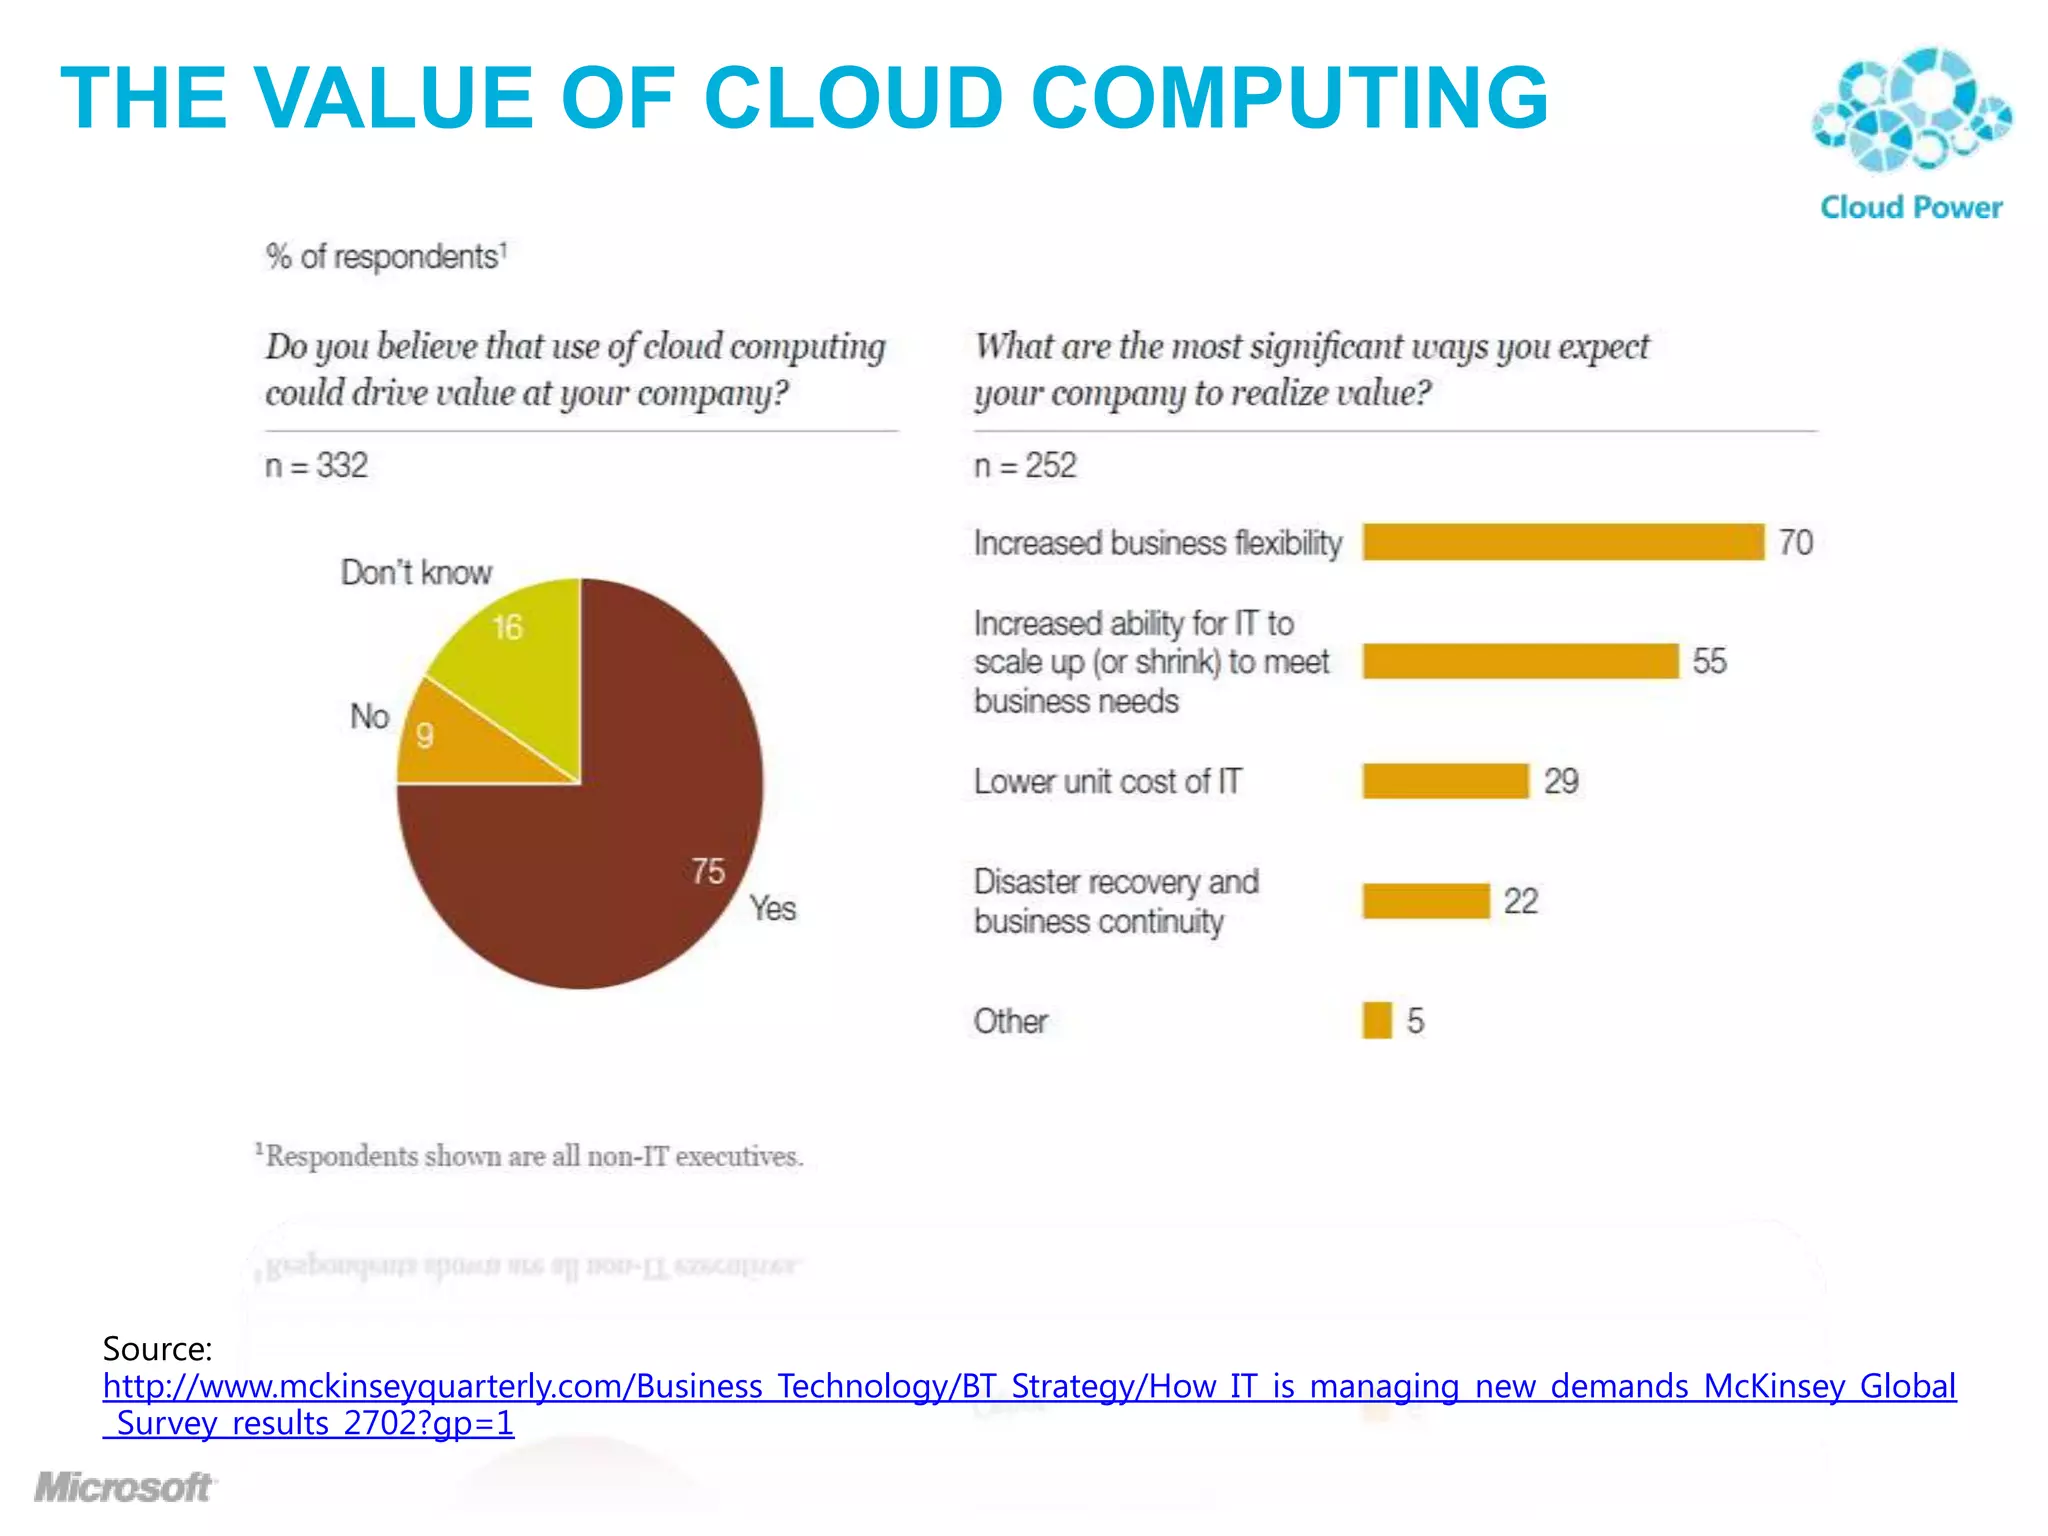


The document discusses the economics of cloud computing from Microsoft's perspective. It describes how large data centers provide significant cost savings due to economies of scale, with total cost of ownership per server declining substantially as data center size increases. It also explains how cloud platforms allow for improved server utilization rates and energy efficiency through multi-tenancy and on-demand services. The cloud provides businesses flexibility and opportunities for cost reduction compared to traditional on-premise models.


![The Economics Of The Cloud Whitepaper[1]](https://cdn.slidesharecdn.com/ss_thumbnails/theeconomicsofthecloudwhitepaper1-12950530802778-phpapp02-thumbnail.jpg?width=640&height=640&fit=bounds)


