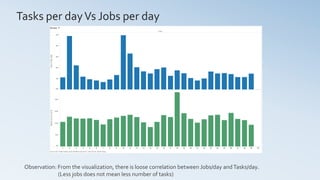
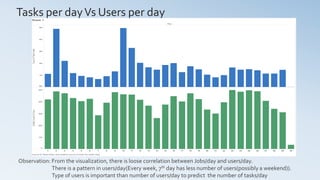
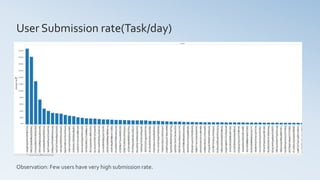
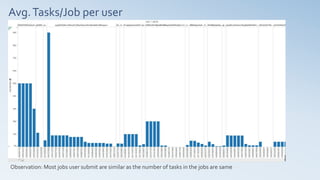
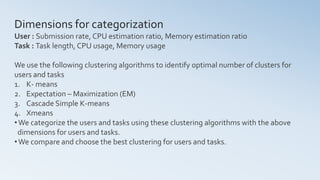
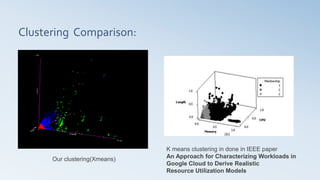
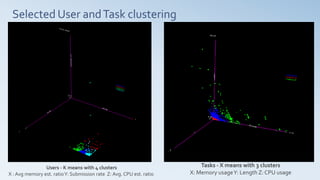
SlideShare a Scribd company logo
Cloud Computing
Project B
Cloud workload analysis
and simulation.
Group 3:
Abinaya Shanmugaraj
Arunraja Srinivasan
PrabhakarGanesamurthy
Priyanka Mehta
Instructor : Dr. I-LingYen
TA : Elham Rezvani
Overview
• Dataset preprocessing
• Dataset Analysis and Observations
• Important attributes in dataset
• Categorization of users and tasks
• Time series analysis
• Workload prediction
• Looking Ahead
Dataset pre-processing
• Inconsistent and vague data was processed to perform analysis.
• The task-usage table has many records for a same jobID-task index pair
because the same task might be re-submitted or re-scheduled due to task
failure.
• So to avoid reading many values for the same JobID-Task index pair pre-
processing was done.
• Pre-processing:All records were grouped by JobID-Task index and the last
occurring record of repeating task records was considered and stored as a
single record.
• Time is in microseconds in the dataset.
• Pre-processing:Time is converted into days and hours for per day analysis
Dataset pre-processing
• The data in the tables were visualized
• The data which were found to be constant/within a small range of
values for most of the records were not considered for analysis.
• The attributes that play a major part in shaping the user profile and
task profile are considered important attributes.
• The main attributes from a table were analyzed and visualized and
certain observations were made.
Data Analysis and Observation
Ignored attribute(example) – Memory accesses per
instruction
Memory accesses per instructionVsTasks per JobID – Except for a few tasks MAI is almost the same for all tasks
Job Events table
Attributes considered: Time, JobID, event type, user.
• These attributes were extracted from the csv files using java code.
• To find the number of jobs submitted per day and per user, the records
with event type = 0 were considered, as ‘0’ means a job is submitted by
the user.
• Time in microseconds is converted into days
Visualizations : jobs submitted per day, per user.
Task events table
Attributes considered: Time, JobID, task index,event type, user, CPU request, memory
request, disk space request.
• With records where event type = 0, the number of tasks per day, per user was visualized.
• Through the distinct count of users, the numbers of users per day was visualized
Average tasks per day = 1,607,694
Average users per day = 398
Visualizations: number of tasks per day, per user, number of users per day, user submission
rate (total number of tasks submitted/30) average memory requested per user, average CPU
requested per user, Avg tasks/job per user.
Tasks per dayVs Jobs per day
Day
1 2 3 4 5 6 7 8 9 10 11 12 13 14 15 16 17 18 19 20 21 22 23 24 25 26 27 28 29 30
0M
1M
2M
3M
4M
5M
CountofTaskIndex
0K
10K
20K
30K
40K
DistinctcountofJobID
Sheet 7
Count of Task Index and distinct count of Job ID for each Day.
Observation: From the visualization, there is loose correlation between Jobs/day andTasks/day.
(Less jobs does not mean less number of tasks)
Tasks per dayVs Users per day
Day
1 2 3 4 5 6 7 8 9 10 11 12 13 14 15 16 17 18 19 20 21 22 23 24 25 26 27 28 29 30
0M
1M
2M
3M
4M
5M
CountofTaskIndex
0
100
200
300
400
500
DistinctcountofUser
Sheet 1
Count of Task Index and distinct count of User for each Day.
Observation: From the visualization, there is loose correlation between Jobs/day and users/day.
There is a pattern in users/day(Every week, 7th day has less number of users(possibly a weekend)).
Type of users is important than number of users/day to predict the number of tasks/day
User Submission rate(Task/day)
Observation: Few users have very high submission rate.
Avg.Tasks/Job per user
Observation: Most jobs user submit are similar as the number of tasks in the jobs are same
Machine Events
Attributes considered: Time, machine ID, event type, CPU, memory.
• Considering records with event type = 0, we get machines that are
added to the cluster and are available
• Considering records with event type = 1, we get machines that are
removed due to failure
• Considering records with event type = 2, we get the machines whose
attributes are updated
• These data is of less significance for our project
Tasks usage
Attributes considered: start time, end time, job ID, task index, CPU rate,
canonical memory usage, assigned memory usage, local disk space
usage.
• Using the considered attributes, task length(running time*CPU rate)
was computed. (running time was converted from microseconds to
seconds)
• The user data from task events table was extracted to get the average
memory, CPU used per user
Visualization: Average CPU used per user, Average memory used per
user
CPU requested per userVs CPU used per user
Observation: Most users over estimate the resources they need and use less than 5% of the requested resources
A few users under estimate the resources and use more than thrice the amount of requested resources.
Memory requested per userVs Memory used per user
Observation: Most users over estimated the resources they need and use less than 30% of the requested resources
Very few users under estimated the resources and use more than the amount of requested resources
but when tasks use more memory than requested they get killed.
Important Attributes
• Those attributes which play an important part in identifying user and
task shape
• From the visualizations and observations made, the following are
identified as important attributes:
• User : Submission rate, CPU estimation ratio, Memory estimation ratio
Estimation ratio = (requested resource – used resource)/requested resource
• Task :Task length, CPU usage, Memory usage
CPU Estimation ratio per User
Users with negative (red) CPU estimation ratio have used resources more than requested.
Users with CPU estimation ratio between 0.9 to 1 have not used more than 90% of the requested resource.
Memory Estimation ratio per User
Users with negative (orange) memory estimation ratio have used resources more than requested.
Users with memory estimation ratio between 0.9 to 1 have not used more than 90% of the requested
resource.
Categorization of Users
Categorization ofTasks
Dimensions for categorization
User : Submission rate, CPU estimation ratio, Memory estimation ratio
Task : Task length, CPU usage, Memory usage
We use the following clustering algorithms to identify optimal number of clusters for
users and tasks
1. K- means
2. Expectation – Maximization (EM)
3. Cascade Simple K-means
4. Xmeans
•We categorize the users and tasks using these clustering algorithms with the above
dimensions for users and tasks.
•We compare and choose the best clustering for users and tasks.
User Categorization
Users - K- means with 4 clusters
X : Avg. memory est. ratio Y: Submission rate
Z: Avg. CPU est. ratio
Tasks Categorization
Tasks – Day 13 – Kmeans (3 clusters)
X: Memory usageY: Length Z: CPU usage
Tasks – Day 13 - Xmeans
X: Memory usageY: Length Z: CPU usage
Clustering Comparison:
Our clustering(Xmeans)
K means clustering in done in IEEE paper
An Approach for Characterizing Workloads in
Google Cloud to Derive Realistic
Resource Utilization Models
Selected User andTask clustering
Users - K means with 4 clusters
X : Avg memory est. ratioY: Submission rate Z: Avg. CPU est. ratio
Tasks - X means with 3 clusters
X: Memory usageY: Length Z: CPU usage
Time Series Analysis
SelectingTarget Users &Tasks
From the clustering results we observed:
• 97% of the users have estimation ratios ranging from 0.7-1.0
• That is 97% of the users don’t user more than 70% of the resources they request
• We targeted User Cluster 0 & Cluster 3 ( more than 90 % unused)
We targeted tasks that were long enough to perform efficient resource allocation
• Performed clustering on task lengths of these users to filter out short tasks
User workload analysis – DynamicTimeWarping
To identify user’s tasks with similar workload,
We ran the DTW algorithm on each tasks of Cluster0 and Cluster3 users
• Computed the DTW between user’s tasks and a reference curve
• Extracted tasks of a user that have same DTW value
• These tasks were identified to have similar workload curve.
Workload prediction
Workload prediction
Since resource allocation and de-allocation cannot be done dynamically because of :
• Huge overhead
• Delay in allocating resources
So the resource allocation must happen once in every pre-determined interval of time.
Prediction:
• When a predictable user runs a task , its initial workload is compared with the curve
associated(reference curve) with him/her.
• Based on the slope of the predicted workload curve(reference curve)
a step- up or step-down in resource allocation is determined, considering the delay
in resource allocation.
Looking ahead…
• When the unhashed job name and user name is known, associations between job name
and its workload can be formed and used for better prediction
• As observed in the user clustering, most users have poor estimation ratios.
So better resource estimating processes can be used to assist users to have a better
Estimation ratios.
• More techniques like regression analysis, curve fitting algorithms can be used to
get a better representative curve for a predictable user.
Cloud workload analysis and simulation

More Related Content

Similar to Cloud workload analysis and simulation

cloudworkloadanalysisandsimulation-140521153543-phpapp02
cloudworkloadanalysisandsimulation-140521153543-phpapp02cloudworkloadanalysisandsimulation-140521153543-phpapp02
cloudworkloadanalysisandsimulation-140521153543-phpapp02
PRIYANKA MEHTA
 
Cost-Based Task Scheduling in Cloud Computing
Cost-Based Task Scheduling in Cloud ComputingCost-Based Task Scheduling in Cloud Computing
Cost-Based Task Scheduling in Cloud Computing
IRJET Journal
 
Database Management System
Database Management SystemDatabase Management System
Database Management System
NILESH UCHCHASARE
 
Requirements Analysis
Requirements AnalysisRequirements Analysis
Requirements Analysis
Sibel Kuzgun AKIN
 
Why do Users kill HPC Jobs?
Why do Users kill HPC Jobs?Why do Users kill HPC Jobs?
Why do Users kill HPC Jobs?
Venkatesh Prasad Ranganath
 
V33119122
V33119122V33119122
V33119122
IJERA Editor
 
Search on the fly: how to lighten your Big Data - Simona Russo, Auro Rolle - ...
Search on the fly: how to lighten your Big Data - Simona Russo, Auro Rolle - ...Search on the fly: how to lighten your Big Data - Simona Russo, Auro Rolle - ...
Search on the fly: how to lighten your Big Data - Simona Russo, Auro Rolle - ...
Codemotion
 
Unit 1: Introduction to DBMS Unit 1 Complete
Unit 1: Introduction to DBMS Unit 1 CompleteUnit 1: Introduction to DBMS Unit 1 Complete
Unit 1: Introduction to DBMS Unit 1 Complete
Raj vardhan
 
Mongo db 2.4 time series data - Brignoli
Mongo db 2.4 time series data - BrignoliMongo db 2.4 time series data - Brignoli
Mongo db 2.4 time series data - Brignoli
Codemotion
 
Measures of query cost
Measures of query costMeasures of query cost
Measures of query cost
Hitesh Mohapatra
 
PAD: Performance Anomaly Detection in Multi-Server Distributed Systems
PAD: Performance Anomaly Detection in Multi-Server Distributed SystemsPAD: Performance Anomaly Detection in Multi-Server Distributed Systems
PAD: Performance Anomaly Detection in Multi-Server Distributed Systems
James Hill
 
Average Active Sessions - OaktableWorld 2013
Average Active Sessions - OaktableWorld 2013Average Active Sessions - OaktableWorld 2013
Average Active Sessions - OaktableWorld 2013
John Beresniewicz
 
Database management system.pptx
Database management system.pptxDatabase management system.pptx
Database management system.pptx
AshmitKashyap1
 
An adaptive algorithm for task scheduling for computational grid
An adaptive algorithm for task scheduling for computational gridAn adaptive algorithm for task scheduling for computational grid
An adaptive algorithm for task scheduling for computational grid
eSAT Journals
 
Database & Database Users
Database & Database UsersDatabase & Database Users
Database & Database Users
M.Zalmai Rahmani
 
DBMS architecture &; system structure
DBMS architecture &; system  structureDBMS architecture &; system  structure
DBMS architecture &; system structure
RUpaliLohar
 
Towards SLA-based Scheduling on YARN Clusters
Towards SLA-based Scheduling on YARN ClustersTowards SLA-based Scheduling on YARN Clusters
Towards SLA-based Scheduling on YARN Clusters
DataWorks Summit
 
Softwareproject planning
Softwareproject planningSoftwareproject planning
Softwareproject planning
saurabhshertukde
 
D04573033
D04573033D04573033
D04573033
IOSR-JEN
 
[CS570] Machine Learning Team Project (I know what items really are)
[CS570] Machine Learning Team Project (I know what items really are)[CS570] Machine Learning Team Project (I know what items really are)
[CS570] Machine Learning Team Project (I know what items really are)
Kunwoo Park
 

Similar to Cloud workload analysis and simulation (20)

cloudworkloadanalysisandsimulation-140521153543-phpapp02
cloudworkloadanalysisandsimulation-140521153543-phpapp02cloudworkloadanalysisandsimulation-140521153543-phpapp02
cloudworkloadanalysisandsimulation-140521153543-phpapp02
 
Cost-Based Task Scheduling in Cloud Computing
Cost-Based Task Scheduling in Cloud ComputingCost-Based Task Scheduling in Cloud Computing
Cost-Based Task Scheduling in Cloud Computing
 
Database Management System
Database Management SystemDatabase Management System
Database Management System
 
Requirements Analysis
Requirements AnalysisRequirements Analysis
Requirements Analysis
 
Why do Users kill HPC Jobs?
Why do Users kill HPC Jobs?Why do Users kill HPC Jobs?
Why do Users kill HPC Jobs?
 
V33119122
V33119122V33119122
V33119122
 
Search on the fly: how to lighten your Big Data - Simona Russo, Auro Rolle - ...
Search on the fly: how to lighten your Big Data - Simona Russo, Auro Rolle - ...Search on the fly: how to lighten your Big Data - Simona Russo, Auro Rolle - ...
Search on the fly: how to lighten your Big Data - Simona Russo, Auro Rolle - ...
 
Unit 1: Introduction to DBMS Unit 1 Complete
Unit 1: Introduction to DBMS Unit 1 CompleteUnit 1: Introduction to DBMS Unit 1 Complete
Unit 1: Introduction to DBMS Unit 1 Complete
 
Mongo db 2.4 time series data - Brignoli
Mongo db 2.4 time series data - BrignoliMongo db 2.4 time series data - Brignoli
Mongo db 2.4 time series data - Brignoli
 
Measures of query cost
Measures of query costMeasures of query cost
Measures of query cost
 
PAD: Performance Anomaly Detection in Multi-Server Distributed Systems
PAD: Performance Anomaly Detection in Multi-Server Distributed SystemsPAD: Performance Anomaly Detection in Multi-Server Distributed Systems
PAD: Performance Anomaly Detection in Multi-Server Distributed Systems
 
Average Active Sessions - OaktableWorld 2013
Average Active Sessions - OaktableWorld 2013Average Active Sessions - OaktableWorld 2013
Average Active Sessions - OaktableWorld 2013
 
Database management system.pptx
Database management system.pptxDatabase management system.pptx
Database management system.pptx
 
An adaptive algorithm for task scheduling for computational grid
An adaptive algorithm for task scheduling for computational gridAn adaptive algorithm for task scheduling for computational grid
An adaptive algorithm for task scheduling for computational grid
 
Database & Database Users
Database & Database UsersDatabase & Database Users
Database & Database Users
 
DBMS architecture &; system structure
DBMS architecture &; system  structureDBMS architecture &; system  structure
DBMS architecture &; system structure
 
Towards SLA-based Scheduling on YARN Clusters
Towards SLA-based Scheduling on YARN ClustersTowards SLA-based Scheduling on YARN Clusters
Towards SLA-based Scheduling on YARN Clusters
 
Softwareproject planning
Softwareproject planningSoftwareproject planning
Softwareproject planning
 
D04573033
D04573033D04573033
D04573033
 
[CS570] Machine Learning Team Project (I know what items really are)
[CS570] Machine Learning Team Project (I know what items really are)[CS570] Machine Learning Team Project (I know what items really are)
[CS570] Machine Learning Team Project (I know what items really are)
 

Recently uploaded

Programming Foundation Models with DSPy - Meetup Slides
Programming Foundation Models with DSPy - Meetup SlidesProgramming Foundation Models with DSPy - Meetup Slides
Programming Foundation Models with DSPy - Meetup Slides
Zilliz
 
How to use Firebase Data Connect For Flutter
How to use Firebase Data Connect For FlutterHow to use Firebase Data Connect For Flutter
How to use Firebase Data Connect For Flutter
Daiki Mogmet Ito
 
GraphRAG for Life Science to increase LLM accuracy
GraphRAG for Life Science to increase LLM accuracyGraphRAG for Life Science to increase LLM accuracy
GraphRAG for Life Science to increase LLM accuracy
Tomaz Bratanic
 
HCL Notes und Domino Lizenzkostenreduzierung in der Welt von DLAU
HCL Notes und Domino Lizenzkostenreduzierung in der Welt von DLAUHCL Notes und Domino Lizenzkostenreduzierung in der Welt von DLAU
HCL Notes und Domino Lizenzkostenreduzierung in der Welt von DLAU
panagenda
 
Artificial Intelligence for XMLDevelopment
Artificial Intelligence for XMLDevelopmentArtificial Intelligence for XMLDevelopment
Artificial Intelligence for XMLDevelopment
Octavian Nadolu
 
Serial Arm Control in Real Time Presentation
Serial Arm Control in Real Time PresentationSerial Arm Control in Real Time Presentation
Serial Arm Control in Real Time Presentation
tolgahangng
 
Driving Business Innovation: Latest Generative AI Advancements & Success Story
Driving Business Innovation: Latest Generative AI Advancements & Success StoryDriving Business Innovation: Latest Generative AI Advancements & Success Story
Driving Business Innovation: Latest Generative AI Advancements & Success Story
Safe Software
 
Let's Integrate MuleSoft RPA, COMPOSER, APM with AWS IDP along with Slack
Let's Integrate MuleSoft RPA, COMPOSER, APM with AWS IDP along with SlackLet's Integrate MuleSoft RPA, COMPOSER, APM with AWS IDP along with Slack
Let's Integrate MuleSoft RPA, COMPOSER, APM with AWS IDP along with Slack
shyamraj55
 
How to Get CNIC Information System with Paksim Ga.pptx
How to Get CNIC Information System with Paksim Ga.pptxHow to Get CNIC Information System with Paksim Ga.pptx
How to Get CNIC Information System with Paksim Ga.pptx
danishmna97
 
HCL Notes and Domino License Cost Reduction in the World of DLAU
HCL Notes and Domino License Cost Reduction in the World of DLAUHCL Notes and Domino License Cost Reduction in the World of DLAU
HCL Notes and Domino License Cost Reduction in the World of DLAU
panagenda
 
“I’m still / I’m still / Chaining from the Block”
“I’m still / I’m still / Chaining from the Block”“I’m still / I’m still / Chaining from the Block”
“I’m still / I’m still / Chaining from the Block”
Claudio Di Ciccio
 
Microsoft - Power Platform_G.Aspiotis.pdf
Microsoft - Power Platform_G.Aspiotis.pdfMicrosoft - Power Platform_G.Aspiotis.pdf
Microsoft - Power Platform_G.Aspiotis.pdf
Uni Systems S.M.S.A.
 
GraphSummit Singapore | Graphing Success: Revolutionising Organisational Stru...
GraphSummit Singapore | Graphing Success: Revolutionising Organisational Stru...GraphSummit Singapore | Graphing Success: Revolutionising Organisational Stru...
GraphSummit Singapore | Graphing Success: Revolutionising Organisational Stru...
Neo4j
 
Pushing the limits of ePRTC: 100ns holdover for 100 days
Pushing the limits of ePRTC: 100ns holdover for 100 daysPushing the limits of ePRTC: 100ns holdover for 100 days
Pushing the limits of ePRTC: 100ns holdover for 100 days
Adtran
 
GraphSummit Singapore | Neo4j Product Vision & Roadmap - Q2 2024
GraphSummit Singapore | Neo4j Product Vision & Roadmap - Q2 2024GraphSummit Singapore | Neo4j Product Vision & Roadmap - Q2 2024
GraphSummit Singapore | Neo4j Product Vision & Roadmap - Q2 2024
Neo4j
 
UiPath Test Automation using UiPath Test Suite series, part 5
UiPath Test Automation using UiPath Test Suite series, part 5UiPath Test Automation using UiPath Test Suite series, part 5
UiPath Test Automation using UiPath Test Suite series, part 5
DianaGray10
 
TrustArc Webinar - 2024 Global Privacy Survey
TrustArc Webinar - 2024 Global Privacy SurveyTrustArc Webinar - 2024 Global Privacy Survey
TrustArc Webinar - 2024 Global Privacy Survey
TrustArc
 
GraphSummit Singapore | The Future of Agility: Supercharging Digital Transfor...
GraphSummit Singapore | The Future of Agility: Supercharging Digital Transfor...GraphSummit Singapore | The Future of Agility: Supercharging Digital Transfor...
GraphSummit Singapore | The Future of Agility: Supercharging Digital Transfor...
Neo4j
 
GraphSummit Singapore | Enhancing Changi Airport Group's Passenger Experience...
GraphSummit Singapore | Enhancing Changi Airport Group's Passenger Experience...GraphSummit Singapore | Enhancing Changi Airport Group's Passenger Experience...
GraphSummit Singapore | Enhancing Changi Airport Group's Passenger Experience...
Neo4j
 
Unlock the Future of Search with MongoDB Atlas_ Vector Search Unleashed.pdf
Unlock the Future of Search with MongoDB Atlas_ Vector Search Unleashed.pdfUnlock the Future of Search with MongoDB Atlas_ Vector Search Unleashed.pdf
Unlock the Future of Search with MongoDB Atlas_ Vector Search Unleashed.pdf
Malak Abu Hammad
 

Recently uploaded (20)

Programming Foundation Models with DSPy - Meetup Slides
Programming Foundation Models with DSPy - Meetup SlidesProgramming Foundation Models with DSPy - Meetup Slides
Programming Foundation Models with DSPy - Meetup Slides
 
How to use Firebase Data Connect For Flutter
How to use Firebase Data Connect For FlutterHow to use Firebase Data Connect For Flutter
How to use Firebase Data Connect For Flutter
 
GraphRAG for Life Science to increase LLM accuracy
GraphRAG for Life Science to increase LLM accuracyGraphRAG for Life Science to increase LLM accuracy
GraphRAG for Life Science to increase LLM accuracy
 
HCL Notes und Domino Lizenzkostenreduzierung in der Welt von DLAU
HCL Notes und Domino Lizenzkostenreduzierung in der Welt von DLAUHCL Notes und Domino Lizenzkostenreduzierung in der Welt von DLAU
HCL Notes und Domino Lizenzkostenreduzierung in der Welt von DLAU
 
Artificial Intelligence for XMLDevelopment
Artificial Intelligence for XMLDevelopmentArtificial Intelligence for XMLDevelopment
Artificial Intelligence for XMLDevelopment
 
Serial Arm Control in Real Time Presentation
Serial Arm Control in Real Time PresentationSerial Arm Control in Real Time Presentation
Serial Arm Control in Real Time Presentation
 
Driving Business Innovation: Latest Generative AI Advancements & Success Story
Driving Business Innovation: Latest Generative AI Advancements & Success StoryDriving Business Innovation: Latest Generative AI Advancements & Success Story
Driving Business Innovation: Latest Generative AI Advancements & Success Story
 
Let's Integrate MuleSoft RPA, COMPOSER, APM with AWS IDP along with Slack
Let's Integrate MuleSoft RPA, COMPOSER, APM with AWS IDP along with SlackLet's Integrate MuleSoft RPA, COMPOSER, APM with AWS IDP along with Slack
Let's Integrate MuleSoft RPA, COMPOSER, APM with AWS IDP along with Slack
 
How to Get CNIC Information System with Paksim Ga.pptx
How to Get CNIC Information System with Paksim Ga.pptxHow to Get CNIC Information System with Paksim Ga.pptx
How to Get CNIC Information System with Paksim Ga.pptx
 
HCL Notes and Domino License Cost Reduction in the World of DLAU
HCL Notes and Domino License Cost Reduction in the World of DLAUHCL Notes and Domino License Cost Reduction in the World of DLAU
HCL Notes and Domino License Cost Reduction in the World of DLAU
 
“I’m still / I’m still / Chaining from the Block”
“I’m still / I’m still / Chaining from the Block”“I’m still / I’m still / Chaining from the Block”
“I’m still / I’m still / Chaining from the Block”
 
Microsoft - Power Platform_G.Aspiotis.pdf
Microsoft - Power Platform_G.Aspiotis.pdfMicrosoft - Power Platform_G.Aspiotis.pdf
Microsoft - Power Platform_G.Aspiotis.pdf
 
GraphSummit Singapore | Graphing Success: Revolutionising Organisational Stru...
GraphSummit Singapore | Graphing Success: Revolutionising Organisational Stru...GraphSummit Singapore | Graphing Success: Revolutionising Organisational Stru...
GraphSummit Singapore | Graphing Success: Revolutionising Organisational Stru...
 
Pushing the limits of ePRTC: 100ns holdover for 100 days
Pushing the limits of ePRTC: 100ns holdover for 100 daysPushing the limits of ePRTC: 100ns holdover for 100 days
Pushing the limits of ePRTC: 100ns holdover for 100 days
 
GraphSummit Singapore | Neo4j Product Vision & Roadmap - Q2 2024
GraphSummit Singapore | Neo4j Product Vision & Roadmap - Q2 2024GraphSummit Singapore | Neo4j Product Vision & Roadmap - Q2 2024
GraphSummit Singapore | Neo4j Product Vision & Roadmap - Q2 2024
 
UiPath Test Automation using UiPath Test Suite series, part 5
UiPath Test Automation using UiPath Test Suite series, part 5UiPath Test Automation using UiPath Test Suite series, part 5
UiPath Test Automation using UiPath Test Suite series, part 5
 
TrustArc Webinar - 2024 Global Privacy Survey
TrustArc Webinar - 2024 Global Privacy SurveyTrustArc Webinar - 2024 Global Privacy Survey
TrustArc Webinar - 2024 Global Privacy Survey
 
GraphSummit Singapore | The Future of Agility: Supercharging Digital Transfor...
GraphSummit Singapore | The Future of Agility: Supercharging Digital Transfor...GraphSummit Singapore | The Future of Agility: Supercharging Digital Transfor...
GraphSummit Singapore | The Future of Agility: Supercharging Digital Transfor...
 
GraphSummit Singapore | Enhancing Changi Airport Group's Passenger Experience...
GraphSummit Singapore | Enhancing Changi Airport Group's Passenger Experience...GraphSummit Singapore | Enhancing Changi Airport Group's Passenger Experience...
GraphSummit Singapore | Enhancing Changi Airport Group's Passenger Experience...
 
Unlock the Future of Search with MongoDB Atlas_ Vector Search Unleashed.pdf
Unlock the Future of Search with MongoDB Atlas_ Vector Search Unleashed.pdfUnlock the Future of Search with MongoDB Atlas_ Vector Search Unleashed.pdf
Unlock the Future of Search with MongoDB Atlas_ Vector Search Unleashed.pdf
 

Cloud workload analysis and simulation

  • 1. Cloud Computing Project B Cloud workload analysis and simulation. Group 3: Abinaya Shanmugaraj Arunraja Srinivasan PrabhakarGanesamurthy Priyanka Mehta Instructor : Dr. I-LingYen TA : Elham Rezvani
  • 2. Overview • Dataset preprocessing • Dataset Analysis and Observations • Important attributes in dataset • Categorization of users and tasks • Time series analysis • Workload prediction • Looking Ahead
  • 4. • Inconsistent and vague data was processed to perform analysis. • The task-usage table has many records for a same jobID-task index pair because the same task might be re-submitted or re-scheduled due to task failure. • So to avoid reading many values for the same JobID-Task index pair pre- processing was done. • Pre-processing:All records were grouped by JobID-Task index and the last occurring record of repeating task records was considered and stored as a single record. • Time is in microseconds in the dataset. • Pre-processing:Time is converted into days and hours for per day analysis Dataset pre-processing
  • 5.
  • 6. • The data in the tables were visualized • The data which were found to be constant/within a small range of values for most of the records were not considered for analysis. • The attributes that play a major part in shaping the user profile and task profile are considered important attributes. • The main attributes from a table were analyzed and visualized and certain observations were made. Data Analysis and Observation
  • 7. Ignored attribute(example) – Memory accesses per instruction Memory accesses per instructionVsTasks per JobID – Except for a few tasks MAI is almost the same for all tasks
  • 8. Job Events table Attributes considered: Time, JobID, event type, user. • These attributes were extracted from the csv files using java code. • To find the number of jobs submitted per day and per user, the records with event type = 0 were considered, as ‘0’ means a job is submitted by the user. • Time in microseconds is converted into days Visualizations : jobs submitted per day, per user.
  • 9. Task events table Attributes considered: Time, JobID, task index,event type, user, CPU request, memory request, disk space request. • With records where event type = 0, the number of tasks per day, per user was visualized. • Through the distinct count of users, the numbers of users per day was visualized Average tasks per day = 1,607,694 Average users per day = 398 Visualizations: number of tasks per day, per user, number of users per day, user submission rate (total number of tasks submitted/30) average memory requested per user, average CPU requested per user, Avg tasks/job per user.
  • 10. Tasks per dayVs Jobs per day Day 1 2 3 4 5 6 7 8 9 10 11 12 13 14 15 16 17 18 19 20 21 22 23 24 25 26 27 28 29 30 0M 1M 2M 3M 4M 5M CountofTaskIndex 0K 10K 20K 30K 40K DistinctcountofJobID Sheet 7 Count of Task Index and distinct count of Job ID for each Day. Observation: From the visualization, there is loose correlation between Jobs/day andTasks/day. (Less jobs does not mean less number of tasks)
  • 11. Tasks per dayVs Users per day Day 1 2 3 4 5 6 7 8 9 10 11 12 13 14 15 16 17 18 19 20 21 22 23 24 25 26 27 28 29 30 0M 1M 2M 3M 4M 5M CountofTaskIndex 0 100 200 300 400 500 DistinctcountofUser Sheet 1 Count of Task Index and distinct count of User for each Day. Observation: From the visualization, there is loose correlation between Jobs/day and users/day. There is a pattern in users/day(Every week, 7th day has less number of users(possibly a weekend)). Type of users is important than number of users/day to predict the number of tasks/day
  • 12. User Submission rate(Task/day) Observation: Few users have very high submission rate.
  • 13. Avg.Tasks/Job per user Observation: Most jobs user submit are similar as the number of tasks in the jobs are same
  • 14. Machine Events Attributes considered: Time, machine ID, event type, CPU, memory. • Considering records with event type = 0, we get machines that are added to the cluster and are available • Considering records with event type = 1, we get machines that are removed due to failure • Considering records with event type = 2, we get the machines whose attributes are updated • These data is of less significance for our project
  • 15. Tasks usage Attributes considered: start time, end time, job ID, task index, CPU rate, canonical memory usage, assigned memory usage, local disk space usage. • Using the considered attributes, task length(running time*CPU rate) was computed. (running time was converted from microseconds to seconds) • The user data from task events table was extracted to get the average memory, CPU used per user Visualization: Average CPU used per user, Average memory used per user
  • 16. CPU requested per userVs CPU used per user Observation: Most users over estimate the resources they need and use less than 5% of the requested resources A few users under estimate the resources and use more than thrice the amount of requested resources.
  • 17. Memory requested per userVs Memory used per user Observation: Most users over estimated the resources they need and use less than 30% of the requested resources Very few users under estimated the resources and use more than the amount of requested resources but when tasks use more memory than requested they get killed.
  • 18. Important Attributes • Those attributes which play an important part in identifying user and task shape • From the visualizations and observations made, the following are identified as important attributes: • User : Submission rate, CPU estimation ratio, Memory estimation ratio Estimation ratio = (requested resource – used resource)/requested resource • Task :Task length, CPU usage, Memory usage
  • 19. CPU Estimation ratio per User Users with negative (red) CPU estimation ratio have used resources more than requested. Users with CPU estimation ratio between 0.9 to 1 have not used more than 90% of the requested resource.
  • 20. Memory Estimation ratio per User Users with negative (orange) memory estimation ratio have used resources more than requested. Users with memory estimation ratio between 0.9 to 1 have not used more than 90% of the requested resource.
  • 22. Dimensions for categorization User : Submission rate, CPU estimation ratio, Memory estimation ratio Task : Task length, CPU usage, Memory usage We use the following clustering algorithms to identify optimal number of clusters for users and tasks 1. K- means 2. Expectation – Maximization (EM) 3. Cascade Simple K-means 4. Xmeans •We categorize the users and tasks using these clustering algorithms with the above dimensions for users and tasks. •We compare and choose the best clustering for users and tasks.
  • 24. Users - K- means with 4 clusters X : Avg. memory est. ratio Y: Submission rate Z: Avg. CPU est. ratio
  • 26. Tasks – Day 13 – Kmeans (3 clusters) X: Memory usageY: Length Z: CPU usage
  • 27. Tasks – Day 13 - Xmeans X: Memory usageY: Length Z: CPU usage
  • 28. Clustering Comparison: Our clustering(Xmeans) K means clustering in done in IEEE paper An Approach for Characterizing Workloads in Google Cloud to Derive Realistic Resource Utilization Models
  • 29. Selected User andTask clustering Users - K means with 4 clusters X : Avg memory est. ratioY: Submission rate Z: Avg. CPU est. ratio Tasks - X means with 3 clusters X: Memory usageY: Length Z: CPU usage
  • 31. SelectingTarget Users &Tasks From the clustering results we observed: • 97% of the users have estimation ratios ranging from 0.7-1.0 • That is 97% of the users don’t user more than 70% of the resources they request • We targeted User Cluster 0 & Cluster 3 ( more than 90 % unused) We targeted tasks that were long enough to perform efficient resource allocation • Performed clustering on task lengths of these users to filter out short tasks
  • 32. User workload analysis – DynamicTimeWarping To identify user’s tasks with similar workload, We ran the DTW algorithm on each tasks of Cluster0 and Cluster3 users • Computed the DTW between user’s tasks and a reference curve • Extracted tasks of a user that have same DTW value • These tasks were identified to have similar workload curve.
  • 34. Workload prediction Since resource allocation and de-allocation cannot be done dynamically because of : • Huge overhead • Delay in allocating resources So the resource allocation must happen once in every pre-determined interval of time. Prediction: • When a predictable user runs a task , its initial workload is compared with the curve associated(reference curve) with him/her. • Based on the slope of the predicted workload curve(reference curve) a step- up or step-down in resource allocation is determined, considering the delay in resource allocation.
  • 36. • When the unhashed job name and user name is known, associations between job name and its workload can be formed and used for better prediction • As observed in the user clustering, most users have poor estimation ratios. So better resource estimating processes can be used to assist users to have a better Estimation ratios. • More techniques like regression analysis, curve fitting algorithms can be used to get a better representative curve for a predictable user.