Downloaded 34 times


![Page 3
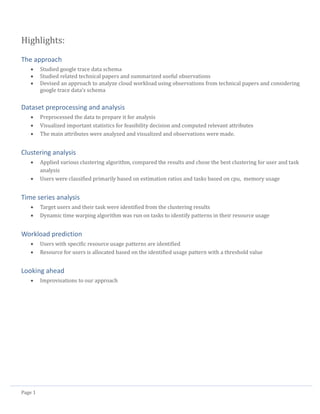
2. The Approach:
Based on our study on the google cloud trace data and the gathered observations from the technical
papers we devised the following approach for the problem:
Analyze and visualize the data to identify important attributes that determine user workload
pattern and ignore rest of the attributes
Calculate resource usage statistics of users to identify the feasibility of resource re-allocation
Classify users based on their resource usage quality[1] (amount of unused resource/resource
requested) using clustering analysis
Identify target users based on the clustering analysis for resource re-allocation
Study the workload pattern of tasks of the target users and classify tasks based on their lengths
Perform time series analysis on long tasks
Identify (if there is) a pattern for a user and associate that pattern for that user (or) form clusters
of tasks of all users that have similar workload based on time series analysis
Predict the usage pattern of a user if the current task’s pattern matches the pattern associated
with that user (or) matches the one of the cluster formed in the previous step.](https://image.slidesharecdn.com/cloudworkloadanalysisandsimulation-140521153543-phpapp02/85/Cloud-workload-analysis-and-simulation-5-320.jpg)
![Page 6
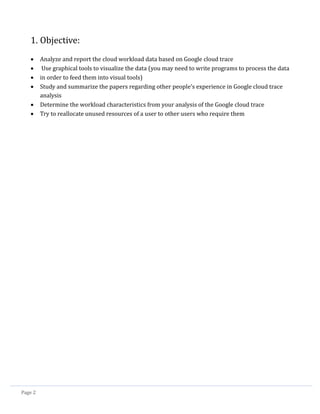
4. Calculation resource usage statistics:
As we are concerned with re-allocation of unused resources, we should look at those users who over-
estimate the resources as observed in the previous section.
To identify those users who over-estimate the resources a new attribute is calculated.
Estimation ratio [1] = (requested resource – used resource)/requested resource.
Estimation ratio varies from 0 to 1.
0 – User has used up/more than the requested resource
1 – User has not used any of the requested resource
Also from the visualizations and observations made, the following are identified as important
attributes:
User: Submission rate, CPU estimation ratio, Memory estimation ratio
Task: Task length, CPU usage, Memory usage
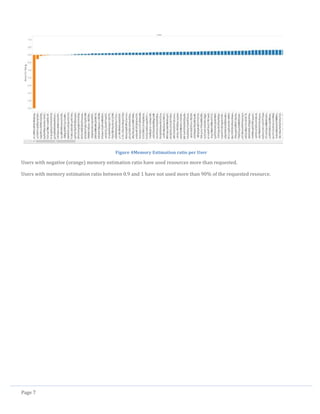
Figure 3CPU Estimation ratio per User
Users with negative (red) CPU estimation ratio have used resources more than requested.
Users with CPU estimation ratio between 0.9 and 1 have not used more than 90% of the requested resource.](https://image.slidesharecdn.com/cloudworkloadanalysisandsimulation-140521153543-phpapp02/85/Cloud-workload-analysis-and-simulation-8-320.jpg)
![Page 8
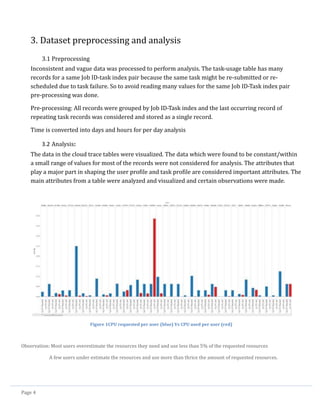
5. Classification of users and identifying target users:
The dimensions for classification are
User: Submission rate, CPU estimation ratio, Memory estimation ratio
We use the following clustering algorithms to identify optimal number of clusters for users and tasks
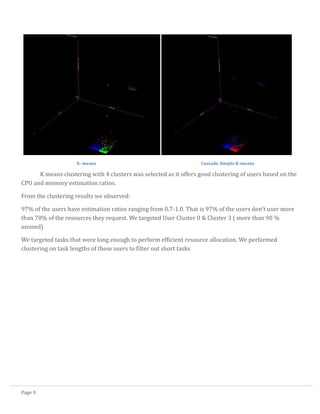
K- means
Expectation – Maximization (EM)
Cascade Simple K-means
X-means[2]
We categorize the users and tasks using these clustering algorithms with the above dimensions for
users.
We compare and choose the best clustering for users and tasks.
K-means (4 clusters) EM Clustering](https://image.slidesharecdn.com/cloudworkloadanalysisandsimulation-140521153543-phpapp02/85/Cloud-workload-analysis-and-simulation-10-320.jpg)
![Page 10
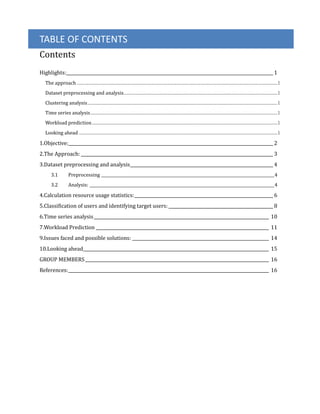
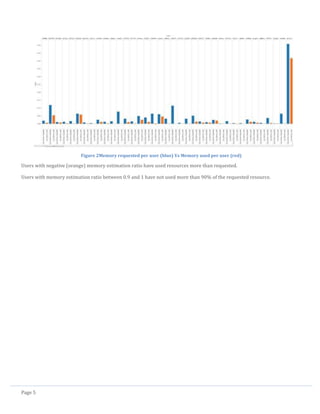
6. Time series analysis
To identify user’s tasks with similar workload, we ran the DTW[3] algorithm on each tasks of Cluster0 and
Cluster3 users, computed the DTW between all target user’s tasks and a reference sine curve (refer
Issues faced section)
Clustered tasks that have same DTW value
These tasks were identified to have similar workload curve.
Two tasks with same DTW distances having similar workloads
The clusters hence formed a reference workload curve was randomly selected from one of task’s
workload in the group of tasks in that cluster. (due to time constraint)](https://image.slidesharecdn.com/cloudworkloadanalysisandsimulation-140521153543-phpapp02/85/Cloud-workload-analysis-and-simulation-12-320.jpg)


This document summarizes the analysis of a cloud workload using Google trace data. The key steps included: 1) Preprocessing and analyzing the Google trace data to identify important attributes like CPU and memory usage. 2) Calculating resource usage statistics and classification of users into clusters based on estimation ratios using clustering algorithms. Target users who overestimated resources were identified. 3) Performing time series analysis using DTW on tasks of target users to identify patterns and cluster tasks with similar workloads.