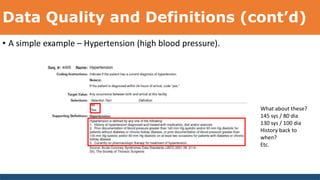
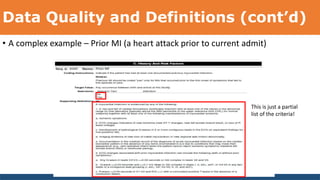
Clinical Healthcare
Data Analytics
From the Perspective of an Interventional Cardiology Registry
Dan Souk
Finna Technologies, Inc.
dan@finnatech.com
www.finnatech.com
Agenda
• Introduction
• What is a Registry?
• Background and Assumptions
• Healthcare’s Big(gest) Problem
• The Role of Analytics
• Technology Landscape
• Data Quality and Definitions
• Clinical Quality Measures (CQMs)
• Quantifying Risk
• Q & A
• Resources
• Footnotes
• Hands-on workshop
It’s All About the Patient!
Introduction – About me
• Founder of Finna Technologies, Inc.
• Health care data/outcomes analytics firm
• Specializing in interventional cardiology
• All-in on cloud computing
• Software Architect
• Experience with both transactional (OLTP) and analytic (OLAP) systems
• Alum of Avanade, JV between Microsoft and Accenture
• Technology agnostic
• Two Microsoft certifications: Azure (cloud), .Net (application development)
• Proficient with Linux, BASH scripting, Postgres and the OSS ecosystem
• Professional expat finance experience
• MBA, Finance, Baylor University
• Bleed Orange and Blue
What is a Registry?
• Disease-specific database
• Cardiology, Oncology (cancer), Orthopedics (joints), Trauma, etc.
• Designed to collect highly detailed, granular data
• Patient chart-level, not claims-level
• Supports advanced analytics, statistical studies, etc.
• Supports observational studies
• Far more affordable than clinical trials
• Obtain results more quickly
• Science tells us what we can do.
• Guidelines tell us what we should do.
• Registries tell us what we’re actually doing.
Brief History of BMC2
• Started in 1997 as a quality improvement registry to study Percutaneous
Coronary Interventions (PCI) across Michigan.
• State-wide collaborative of 50-60 hospitals.
• Several hundred participating physicians.
• Other procedures include Vascular Surgery, Trans-aortic Valve Replacement
(TAVR), Carotid Stents, Carotid Endarterectomy and Peripheral Vascular
Interventions (PVI).
• Saved over $30 MM between 2008 and 2012.
• Thousands of patients have a higher quality of life due to improvements in care.
Coronary Artery Disease
Background and Assumptions
• The major goal of health care data analytics is to improve care quality - reduce
outcomes and reduce costs.
• Health care has some big problems - costs, growth of spending, inconsistent quality of
care, difficulty of care coordination, etc.
• We'll focus on in-hospital costs, inconsistent quality of care and how one organization
has made significant improvements across an entire state.
• Social determinants of health - behavioral and socio-economic - are important issues
but we won't cover them here.
• Analytics can contribute to solving these problems, or at the very least, lead to a better
understanding of them, which in turn should lead to solutions.
• Cardiology is a costly service for a hospital, and a prime area to look for cost. Oncology
and orthopedics are also good candidates.
• Behavioral change is needed to create lasting improvements and savings.
Background and Assumptions
(cont’d)
• Change in physician practice has generally come from academic medical research
and clinical trials (evidence based medicine).
• We need detailed clinical data to establish credibility with a physician audience.
• Claims and similar government data (eg, CMS) is useful but not as granular - and
therefore not as useful - as clinical data.
• Data quality - including definitions - is a very important issue.
• Disease registries can be an excellent source of data.
• Metrics must be actionable to be useful.
• Attention to detail is crucial.
Healthcare’s Big(gest) Problem
• The US health care system is the most costly in the world, accounting for 17% of the
gross domestic product with estimates that percentage will grow to nearly 20% by
2020. (1)
• Why? Very complicated issue with no simple answers, but here are a few factors to give
you a general idea, in no particular order:
• Growth of Medicare/Medicaid/etc, demographics (baby boomer generation is retiring). Strains
healthcare infrastructure, drives up prices.
• Disconnect between doctors (providers), insurance companies, including govt, (payers) and
patients. Economic incentives are horribly mis-aligned.
• Lack of cost transparency. Do you have any idea how much your care will cost before you're
admitted?
• Difficulty of care coordination (doctors still carry pagers and use fax machines). Can lead to
duplicate tests, errors that cause complications, etc.
• Lack of integration across systems. Duplication of care/testing/etc. Mistakes due to lack of
information about the patient, etc.
• etc., etc.
Healthcare’s Big(gest) Problem
(cont’d)
Healthcare’s Big(gest) Problem
(cont’d)
How do these systems / entities communicate?
Value based care – Goal of Reform3
The Role of Analytics
• Descriptive. Understand the past.
• Predictive. Understand the future.
• Prescriptive. Affect the future.
• All require clear, clean, consistent data to be effective.
• Supports move from volume-driven care to value-driven care.
• An organization’s analytics capability is not binary, but rather a journey, similar to
CMM.
Healthcare Analytics Adoption Model2
Level 8
Personalized Medicine
& Prescriptive Analytics
Tailoring patient care based on population outcomes and genetic
data. Fee-for-quality rewards health maintenance.
Level 7
Clinical Risk Intervention
& Predictive Analytics
Organizational processes for intervention are supported with
predictive risk models. Fee-for-quality includes fixed per capita
payment.
Level 6
Population Health Management &
Suggestive Analytics
Tailoring patient care based upon population metrics. Fee-for-
quality includes bundled per case payment.
Level 5 Waste & Care Variability Reduction
Reducing variability in care processes. Focusing on internal
optimization and waste reduction.
Level 4 Automated External Reporting
Efficient, consistent production of reports & adaptability to
changing requirements.
Level 3 Automated Internal Reporting
Efficient, consistent production of reports; & widespread
availability in the organization.
Level 2
Standardized Vocabulary
& Patient Registries
Relating and organizing the core data content.
Level 1 Enterprise Data Warehouse Collecting and integrating the core data content.
Level 0 Fragmented Point Solutions
Inefficient, inconsistent versions of the truth. Cumbersome
internal and external reporting.
Standards
• HL7, Health Level 7 International, hl7.org
• FHIR, Fast Healthcare Interoperability Resources, hl7.org/fhir/
• ICD 9/10, International Classification of Diseases
• LOINC, Logical Observation Identifiers Names and Codes, Laboratory info,
loinc.org
• SNOMED, Systematized Nomenclature of Medicine, snomed.org
• CDA, Clinical Document Architecture, an XML standard for assembling clinical
documents for data exchange.
• The registry does not deal with any of these; we use ‘raw’ clinical terms, as they
are generally accepted by practicing clinicians.
Technology Landscape
Technology Role Description Tools
Relational Databases Structured data Well-understood data
models, especially
anatomic
Microsoft Sql Server,
Postgres, Oracle, etc.
NoSql Databases Semi/Un-structured data Physician notes, non-
standard tests, etc.
RavenDb, MongoDb, etc
Stats Statistical analyses Academic papers,
rigorous research
R / SAS / SPSS / Python,
etc.
BI / Data warehouses Advanced analytics Descriptive, some
predictive. Slice & dice.
Microsoft Sql Server,
Oracle, Pentaho, etc.
AI / Machine Learning Discover patterns Needs lots of granular
data for training
Microsoft Azure ML
Studio, TensorFlow, etc.
Data Visualization Facilitate analysis Enables more insights into
data than static reports
Qlik, Tableau, PowerBI,
Excel, etc.
The Cloud Scale, Reduce costs Outsource computing Azure, AWS, Google, etc.
Possible Data Sources
Architecture
BMC2
Other
NCDR
Analysis Service
cubes
Excel
Cube
Reporting
ETL
(KPIs, etc.)
Static PDF
Clinical Hub / ODS
(patient matching,
clinical data model)
End User
Presentation
and Analysis
$0
$50,000
$100,000
$150,000
$200,000
ESTIMATED COST OF ACTIVITY PER YEAR
Cost of Activities
TelcoManagement
ProcessDesign
Network ReportingwithAutomation
Project andProgramManagement
Network Analysis
CNBSBusinessSupport
Vendor Management
General Management/ResourceManagement
Administration
Vacation/Holidays
Sick Time
Training
Data Sources Postgres
SQL Server
DW / SSAS
R / Sweave / Latex
SSAS Cubes / Excel
Standard
Reports
Static KPIs
Data Quality and Definitions
Three things matter in real estate:
1. Location
2. Location
3. Location
Three things matter in quality improvement:
1. Definitions
2. Definitions
3. Definitions
Data Quality and Definitions (cont’d)
• Data quality and definitions are fundamental to producing effective analytics.
• Many ways to implement these concepts
• Data needs to be (reasonably) clear, clean and consistent to the fullest extent
possible.
Data Quality and Definitions (cont’d)
• A simple example – Hypertension (high blood pressure).
What about these?
145 sys / 80 dia
130 sys / 100 dia
History back to
when?
Etc.
Data Quality and Definitions (cont’d)
• A complex example – Prior MI (a heart attack prior to current admit)
This is just a partial
list of the criteria!
Clinical Quality Measures (CQMs)
• These are the Key Performance Indicators (KPIs) of the healthcare world, used to
assess care quality, protocols, etc.
• Highly dependent on quality and definitions of the raw data points.
• Reliable CQMs are the foundation for generating the data needed to understand
the current circumstances and historical trends.
• That foundation is also needed to support predictive and prescriptive analytics.
• Some are pay-for-performance (P4P), which raises the stakes considerably.
• Must be actionable.
Clinical Quality Measures (cont’d)
• Primarily measured as rates / percentages, but sometimes also as
average/standard deviation, median.
rate = (n - ex) / (d - ex)
where:
• n = Numerator. Cases that had a specific condition.
• d = Denominator. All possible cases for a specific condition.
• ex = Exclusions. Cases that are not included.
Clinical Quality Measures (cont’d)
Exclusions
• An exclusion is a case (a patient, procedure or lesion) that is considered invalid
for the metric in question.
Examples:
• Patients allergic to aspirin are not included in aspirin metrics.
• Patients below a certain weight (60 kg) or above a certain age (75) are not
included in Prasugrel metrics.
Clinical Quality Measures (cont’d)
• Examples of (mostly) Non-Actionable metrics
Clinical Quality Measures (cont’d)
• Examples of (mostly) Actionable metrics
Quantifying and Adjusting for Risk
• There are often significant differences in the health of patient populations treated by different
hospitals.
• If Hospital B has healthier patients than Hospital A, but both have the same rates for mortality
for cardiac cath patients, Hospital A likely has better care.
• Adjusting for this difference is known as risk-adjustment, the process of statistically accounting
for differences in patient case mix that influence health care outcomes.
• This requires creating models, selecting algorithms, etc.
• All models are wrong but some are useful.
• The result is usually expressed as a risk score at the patient level, which can be aggregated into
a predicted rate for a given hospital.
• The predicted rate can then be compared to actual to obtain an O/E ratio (observed/expected)
• The O/E ratio provides a reasonable basis for comparing hospitals with differing populations
Quantifying Risk (cont’d)
It’s All About the Patient!
Thank You
Dan Souk
Finna Technologies, Inc.
www.finnatech.com
dan@finnatech.com
@dansouk
www.linkedin.com/in/dansouk
630-762-8258
Q & A
Resources
• Outcomes Measures and Risk Adjustment. https://www.ncbi.nlm.nih.gov/pmc/articles/PMC3816010/. Academic paper; good
background material regarding outcomes measurement.
• Healthcare.ai. Open source AI in healthcare, supported by HealthCatalyst.
• Dr. John Halamka, http://geekdoctor.blogspot.com/2017/04/a-cautionary-tale-for-healthcare.html. Practicing physician, CIO of
Harvard’s Beth Israel Deaconess medical center.
• UCI Machine Learning Repository. http://archive.ics.uci.edu/ml/. Great source for practice datasets.
• R bloggers. www.r-bloggers.com. Feed aggregator; includes ~750 feeds.
• Datanami. www.datanami.com. Big data/AI/ML news.
• Impact Analytix. www.impactanalytix.com. Analytics industry observer, former Microsoft PM.
• HISTalk.com. Healthcare IT news, written anonymously by a practicing physician.
• Microsoft Azure. portal.azure.com. Microsoft Cloud.
• Microsoft Azure ML Studio. studio.azureml.net. See sample experiments to get started.
• Azure Friday. channel9.msdn.com. Short, informative videos on Azure features.
• Build Azure. www.buildazure.com. Keep up with changes and updates in Azure.
• Azure Data Science VM. Available in the VM gallery.
• Amazon / Google / Rackspace / etc. Other cloud providers 
• Keith Boone. motorcycleguy.blogspot.com. Healthcare standards guru.
Healthcare Analytics Adoption Model2
Level 8
Personalized Medicine & Prescriptive Analytics: Analytic motive expands to wellness management, physical and behavioral functional health, and mass customization of care. Analytics expands to include NLP of text,
prescriptive analytics, and interventional decision support. Prescriptive analytics are available at the point of care to improve patient specific outcomes based upon population outcomes. Data content expands to
include 7x24 biometrics data, genomic data and familial data. The EDW is updated within a few minutes of changes in the source systems.
Level 7
Clinical Risk Intervention & Predictive Analytics: Analytic motive expands to address diagnosis-based, fixed-fee per capita reimbursement models. Focus expands from management of cases to collaboration with
clinician and payer partners to manage episodes of care, using predictive modeling, forecasting, and risk stratification to support outreach, triage, escalation and referrals. Physicians, hospitals, employers, payers
and members/patients collaborate to share risk and reward (e.g., financial reward to patients for healthy behavior). Patients are flagged in registries who are unable or unwilling to participate in care protocols.
Data content expands to include home monitoring data, long term care facility data, and protocol-specific patient reported outcomes. On average, the EDW is updated within one hour or less of source system changes.
Level 6
Population Health Management: The “accountable care organization” shares in the financial risk and reward that is tied to clinical outcomes. At least 50% of acute care cases are managed under bundled payments.
Analytics are available at the point of care to support the Triple Aim of maximizing the quality of individual patient care, population management, and the economics of care. Data content expands to include bedside
devices, home monitoring data, external pharmacy data, and detailed activity based costing. Data governance plays a major role in the accuracy of metrics supporting quality-based compensation plans for clinicians
and executives. On average, the EDW is updated within one day of source system changes. The EDW reports organizationally to a C-level executive who is accountable for balancing cost of care and quality of care.
Level 5
Waste & Care Variability Reduction: Analytic motive is focused on measuring adherence to clinical best practices, minimizing waste, and reducing variability. Data governance expands to support care management
teams that are focused on improving the health of patient populations. Population-based analytics are used to suggest improvements to individual patient care. Permanent multidisciplinary teams are in-place that
continuously monitor opportunities to improve quality, and reduce risk and cost, across acute care processes, chronic diseases, patient safety scenarios, and internal workflows. Precision of registries is improved by
including data from lab, pharmacy, and clinical observations in the definition of the patient cohorts. EDW content is organized into evidence-based, standardized data marts that combine clinical and cost data
associated with patient registries. Data content expands to include insurance claims (if not already included) and HIE data feeds. On average, the EDW is updated within one week of source system changes.
Level 4
Automated External Reporting: Analytic motive is focused on consistent, efficient production of reports required for regulatory and accreditation requirements (e.g. CMS, Joint Commission, tumor registry,
communicable diseases); payer incentives (e.g. MU, PQRS, VBP, readmission reduction); and specialty society databases (e.g. STS, NRMI, Vermont-Oxford). Adherence to industry-standard vocabularies is required.
Clinical text data content is available for simple key word searches. Centralized data governance exists for review and approval of externally released data.
Level 3
Automated Internal Reporting: Analytic motive is focused on consistent, efficient production of reports supporting basic management and operation of the healthcare organization. Key performance indicators are
easily accessible from the executive level to the front-line manager. Corporate and business unit data analysts meet regularly to collaborate and steer the EDW. Data governance expands to raise the data literacy
of the organization and develop a data acquisition strategy for Levels 4 and above.
Level 2 Standardized Vocabulary & Patient Registries: Master vocabulary and reference data identified and standardized across disparate source system content in the data warehouse. Naming, definition, and data types are
consistent with local standards. Patient registries are defined solely on ICD billing data. Data governance forms around the definition and evolution of patient registries and master data management.
Level 1
Enterprise Data Warehouse: At a minimum, the following data are co-located in a single data warehouse, locally or hosted: HIMSS EMR Stage 3 data, Revenue Cycle, Financial, Costing, Supply Chain, and Patient
Experience. Searchable metadata repository is available across the enterprise. Data content includes insurance claims, if possible. Data warehouse is updated within one month of source system changes. Data
governance is forming around the data quality of source systems. The EDW reports organizationally to the CIO.
Level 0
Fragmented Point Solutions: Vendor-based and internally developed applications are used to address specific analytic needs as they arise. The fragmented point solutions are neither co-located in a data warehouse
nor otherwise architecturally integrated with one another. Overlapping data content leads to multiple versions of analytic truth. Basic internal & external reports are labor intensive and inconsistent. Data governance
is non-existent.
Self-Assessment
Workshop – Azure Machine Learning
1. Log in to your Azure account at portal.azure.com. Create an account if needed.
2. Create a Machine Learning workspace. Navigate to More services (bottom of
left-hand menu) | Intelligence + Analytics | Machine Learning services (should
be 2nd menu item, after HDInsight clusters).
3. Once created, select your ML workspace to expand the options blade.
4. Choose Launch Machine Learning Studio in the Additonal Links section.
5. Click the Sign In button and follow the prompts.
6. Create a new experiment, and choose the sample Quantile Regression: Car
Price Prediction.
7. Open https://docs.microsoft.com/en-us/azure/machine-learning/machine-
learning-create-experiment. Follow the tutorial to complete the experiment.
Footnotes
1. National Healthcare Expenditure Projections, 2010-2020. Centers for Medicare and Medicaid
Services, Office of the Actuary.
2. Dale Sanders, Vice President, HealthCatalyst.
3. Shahid Shah, www.healthcareguy.com, How to Use Open Source Technologies in Safety-
critical Health Applications.

Clinical Healthcare Data Analytics

  • 1.
    Clinical Healthcare Data Analytics Fromthe Perspective of an Interventional Cardiology Registry Dan Souk Finna Technologies, Inc. dan@finnatech.com www.finnatech.com
  • 2.
    Agenda • Introduction • Whatis a Registry? • Background and Assumptions • Healthcare’s Big(gest) Problem • The Role of Analytics • Technology Landscape • Data Quality and Definitions • Clinical Quality Measures (CQMs) • Quantifying Risk • Q & A • Resources • Footnotes • Hands-on workshop
  • 3.
    It’s All Aboutthe Patient!
  • 4.
    Introduction – Aboutme • Founder of Finna Technologies, Inc. • Health care data/outcomes analytics firm • Specializing in interventional cardiology • All-in on cloud computing • Software Architect • Experience with both transactional (OLTP) and analytic (OLAP) systems • Alum of Avanade, JV between Microsoft and Accenture • Technology agnostic • Two Microsoft certifications: Azure (cloud), .Net (application development) • Proficient with Linux, BASH scripting, Postgres and the OSS ecosystem • Professional expat finance experience • MBA, Finance, Baylor University • Bleed Orange and Blue
  • 5.
    What is aRegistry? • Disease-specific database • Cardiology, Oncology (cancer), Orthopedics (joints), Trauma, etc. • Designed to collect highly detailed, granular data • Patient chart-level, not claims-level • Supports advanced analytics, statistical studies, etc. • Supports observational studies • Far more affordable than clinical trials • Obtain results more quickly • Science tells us what we can do. • Guidelines tell us what we should do. • Registries tell us what we’re actually doing.
  • 6.
    Brief History ofBMC2 • Started in 1997 as a quality improvement registry to study Percutaneous Coronary Interventions (PCI) across Michigan. • State-wide collaborative of 50-60 hospitals. • Several hundred participating physicians. • Other procedures include Vascular Surgery, Trans-aortic Valve Replacement (TAVR), Carotid Stents, Carotid Endarterectomy and Peripheral Vascular Interventions (PVI). • Saved over $30 MM between 2008 and 2012. • Thousands of patients have a higher quality of life due to improvements in care.
  • 7.
  • 8.
    Background and Assumptions •The major goal of health care data analytics is to improve care quality - reduce outcomes and reduce costs. • Health care has some big problems - costs, growth of spending, inconsistent quality of care, difficulty of care coordination, etc. • We'll focus on in-hospital costs, inconsistent quality of care and how one organization has made significant improvements across an entire state. • Social determinants of health - behavioral and socio-economic - are important issues but we won't cover them here. • Analytics can contribute to solving these problems, or at the very least, lead to a better understanding of them, which in turn should lead to solutions. • Cardiology is a costly service for a hospital, and a prime area to look for cost. Oncology and orthopedics are also good candidates. • Behavioral change is needed to create lasting improvements and savings.
  • 9.
    Background and Assumptions (cont’d) •Change in physician practice has generally come from academic medical research and clinical trials (evidence based medicine). • We need detailed clinical data to establish credibility with a physician audience. • Claims and similar government data (eg, CMS) is useful but not as granular - and therefore not as useful - as clinical data. • Data quality - including definitions - is a very important issue. • Disease registries can be an excellent source of data. • Metrics must be actionable to be useful. • Attention to detail is crucial.
  • 10.
    Healthcare’s Big(gest) Problem •The US health care system is the most costly in the world, accounting for 17% of the gross domestic product with estimates that percentage will grow to nearly 20% by 2020. (1) • Why? Very complicated issue with no simple answers, but here are a few factors to give you a general idea, in no particular order: • Growth of Medicare/Medicaid/etc, demographics (baby boomer generation is retiring). Strains healthcare infrastructure, drives up prices. • Disconnect between doctors (providers), insurance companies, including govt, (payers) and patients. Economic incentives are horribly mis-aligned. • Lack of cost transparency. Do you have any idea how much your care will cost before you're admitted? • Difficulty of care coordination (doctors still carry pagers and use fax machines). Can lead to duplicate tests, errors that cause complications, etc. • Lack of integration across systems. Duplication of care/testing/etc. Mistakes due to lack of information about the patient, etc. • etc., etc.
  • 11.
  • 12.
    Healthcare’s Big(gest) Problem (cont’d) Howdo these systems / entities communicate?
  • 13.
    Value based care– Goal of Reform3
  • 14.
    The Role ofAnalytics • Descriptive. Understand the past. • Predictive. Understand the future. • Prescriptive. Affect the future. • All require clear, clean, consistent data to be effective. • Supports move from volume-driven care to value-driven care. • An organization’s analytics capability is not binary, but rather a journey, similar to CMM.
  • 15.
    Healthcare Analytics AdoptionModel2 Level 8 Personalized Medicine & Prescriptive Analytics Tailoring patient care based on population outcomes and genetic data. Fee-for-quality rewards health maintenance. Level 7 Clinical Risk Intervention & Predictive Analytics Organizational processes for intervention are supported with predictive risk models. Fee-for-quality includes fixed per capita payment. Level 6 Population Health Management & Suggestive Analytics Tailoring patient care based upon population metrics. Fee-for- quality includes bundled per case payment. Level 5 Waste & Care Variability Reduction Reducing variability in care processes. Focusing on internal optimization and waste reduction. Level 4 Automated External Reporting Efficient, consistent production of reports & adaptability to changing requirements. Level 3 Automated Internal Reporting Efficient, consistent production of reports; & widespread availability in the organization. Level 2 Standardized Vocabulary & Patient Registries Relating and organizing the core data content. Level 1 Enterprise Data Warehouse Collecting and integrating the core data content. Level 0 Fragmented Point Solutions Inefficient, inconsistent versions of the truth. Cumbersome internal and external reporting.
  • 16.
    Standards • HL7, HealthLevel 7 International, hl7.org • FHIR, Fast Healthcare Interoperability Resources, hl7.org/fhir/ • ICD 9/10, International Classification of Diseases • LOINC, Logical Observation Identifiers Names and Codes, Laboratory info, loinc.org • SNOMED, Systematized Nomenclature of Medicine, snomed.org • CDA, Clinical Document Architecture, an XML standard for assembling clinical documents for data exchange. • The registry does not deal with any of these; we use ‘raw’ clinical terms, as they are generally accepted by practicing clinicians.
  • 17.
    Technology Landscape Technology RoleDescription Tools Relational Databases Structured data Well-understood data models, especially anatomic Microsoft Sql Server, Postgres, Oracle, etc. NoSql Databases Semi/Un-structured data Physician notes, non- standard tests, etc. RavenDb, MongoDb, etc Stats Statistical analyses Academic papers, rigorous research R / SAS / SPSS / Python, etc. BI / Data warehouses Advanced analytics Descriptive, some predictive. Slice & dice. Microsoft Sql Server, Oracle, Pentaho, etc. AI / Machine Learning Discover patterns Needs lots of granular data for training Microsoft Azure ML Studio, TensorFlow, etc. Data Visualization Facilitate analysis Enables more insights into data than static reports Qlik, Tableau, PowerBI, Excel, etc. The Cloud Scale, Reduce costs Outsource computing Azure, AWS, Google, etc.
  • 18.
  • 19.
    Architecture BMC2 Other NCDR Analysis Service cubes Excel Cube Reporting ETL (KPIs, etc.) StaticPDF Clinical Hub / ODS (patient matching, clinical data model) End User Presentation and Analysis $0 $50,000 $100,000 $150,000 $200,000 ESTIMATED COST OF ACTIVITY PER YEAR Cost of Activities TelcoManagement ProcessDesign Network ReportingwithAutomation Project andProgramManagement Network Analysis CNBSBusinessSupport Vendor Management General Management/ResourceManagement Administration Vacation/Holidays Sick Time Training Data Sources Postgres SQL Server DW / SSAS R / Sweave / Latex SSAS Cubes / Excel Standard Reports Static KPIs
  • 20.
    Data Quality andDefinitions Three things matter in real estate: 1. Location 2. Location 3. Location Three things matter in quality improvement: 1. Definitions 2. Definitions 3. Definitions
  • 21.
    Data Quality andDefinitions (cont’d) • Data quality and definitions are fundamental to producing effective analytics. • Many ways to implement these concepts • Data needs to be (reasonably) clear, clean and consistent to the fullest extent possible.
  • 22.
    Data Quality andDefinitions (cont’d) • A simple example – Hypertension (high blood pressure). What about these? 145 sys / 80 dia 130 sys / 100 dia History back to when? Etc.
  • 23.
    Data Quality andDefinitions (cont’d) • A complex example – Prior MI (a heart attack prior to current admit) This is just a partial list of the criteria!
  • 24.
    Clinical Quality Measures(CQMs) • These are the Key Performance Indicators (KPIs) of the healthcare world, used to assess care quality, protocols, etc. • Highly dependent on quality and definitions of the raw data points. • Reliable CQMs are the foundation for generating the data needed to understand the current circumstances and historical trends. • That foundation is also needed to support predictive and prescriptive analytics. • Some are pay-for-performance (P4P), which raises the stakes considerably. • Must be actionable.
  • 25.
    Clinical Quality Measures(cont’d) • Primarily measured as rates / percentages, but sometimes also as average/standard deviation, median. rate = (n - ex) / (d - ex) where: • n = Numerator. Cases that had a specific condition. • d = Denominator. All possible cases for a specific condition. • ex = Exclusions. Cases that are not included.
  • 26.
    Clinical Quality Measures(cont’d) Exclusions • An exclusion is a case (a patient, procedure or lesion) that is considered invalid for the metric in question. Examples: • Patients allergic to aspirin are not included in aspirin metrics. • Patients below a certain weight (60 kg) or above a certain age (75) are not included in Prasugrel metrics.
  • 27.
    Clinical Quality Measures(cont’d) • Examples of (mostly) Non-Actionable metrics
  • 28.
    Clinical Quality Measures(cont’d) • Examples of (mostly) Actionable metrics
  • 29.
    Quantifying and Adjustingfor Risk • There are often significant differences in the health of patient populations treated by different hospitals. • If Hospital B has healthier patients than Hospital A, but both have the same rates for mortality for cardiac cath patients, Hospital A likely has better care. • Adjusting for this difference is known as risk-adjustment, the process of statistically accounting for differences in patient case mix that influence health care outcomes. • This requires creating models, selecting algorithms, etc. • All models are wrong but some are useful. • The result is usually expressed as a risk score at the patient level, which can be aggregated into a predicted rate for a given hospital. • The predicted rate can then be compared to actual to obtain an O/E ratio (observed/expected) • The O/E ratio provides a reasonable basis for comparing hospitals with differing populations
  • 30.
  • 31.
  • 32.
    It’s All Aboutthe Patient!
  • 33.
    Thank You Dan Souk FinnaTechnologies, Inc. www.finnatech.com dan@finnatech.com @dansouk www.linkedin.com/in/dansouk 630-762-8258
  • 34.
  • 35.
    Resources • Outcomes Measuresand Risk Adjustment. https://www.ncbi.nlm.nih.gov/pmc/articles/PMC3816010/. Academic paper; good background material regarding outcomes measurement. • Healthcare.ai. Open source AI in healthcare, supported by HealthCatalyst. • Dr. John Halamka, http://geekdoctor.blogspot.com/2017/04/a-cautionary-tale-for-healthcare.html. Practicing physician, CIO of Harvard’s Beth Israel Deaconess medical center. • UCI Machine Learning Repository. http://archive.ics.uci.edu/ml/. Great source for practice datasets. • R bloggers. www.r-bloggers.com. Feed aggregator; includes ~750 feeds. • Datanami. www.datanami.com. Big data/AI/ML news. • Impact Analytix. www.impactanalytix.com. Analytics industry observer, former Microsoft PM. • HISTalk.com. Healthcare IT news, written anonymously by a practicing physician. • Microsoft Azure. portal.azure.com. Microsoft Cloud. • Microsoft Azure ML Studio. studio.azureml.net. See sample experiments to get started. • Azure Friday. channel9.msdn.com. Short, informative videos on Azure features. • Build Azure. www.buildazure.com. Keep up with changes and updates in Azure. • Azure Data Science VM. Available in the VM gallery. • Amazon / Google / Rackspace / etc. Other cloud providers  • Keith Boone. motorcycleguy.blogspot.com. Healthcare standards guru.
  • 36.
    Healthcare Analytics AdoptionModel2 Level 8 Personalized Medicine & Prescriptive Analytics: Analytic motive expands to wellness management, physical and behavioral functional health, and mass customization of care. Analytics expands to include NLP of text, prescriptive analytics, and interventional decision support. Prescriptive analytics are available at the point of care to improve patient specific outcomes based upon population outcomes. Data content expands to include 7x24 biometrics data, genomic data and familial data. The EDW is updated within a few minutes of changes in the source systems. Level 7 Clinical Risk Intervention & Predictive Analytics: Analytic motive expands to address diagnosis-based, fixed-fee per capita reimbursement models. Focus expands from management of cases to collaboration with clinician and payer partners to manage episodes of care, using predictive modeling, forecasting, and risk stratification to support outreach, triage, escalation and referrals. Physicians, hospitals, employers, payers and members/patients collaborate to share risk and reward (e.g., financial reward to patients for healthy behavior). Patients are flagged in registries who are unable or unwilling to participate in care protocols. Data content expands to include home monitoring data, long term care facility data, and protocol-specific patient reported outcomes. On average, the EDW is updated within one hour or less of source system changes. Level 6 Population Health Management: The “accountable care organization” shares in the financial risk and reward that is tied to clinical outcomes. At least 50% of acute care cases are managed under bundled payments. Analytics are available at the point of care to support the Triple Aim of maximizing the quality of individual patient care, population management, and the economics of care. Data content expands to include bedside devices, home monitoring data, external pharmacy data, and detailed activity based costing. Data governance plays a major role in the accuracy of metrics supporting quality-based compensation plans for clinicians and executives. On average, the EDW is updated within one day of source system changes. The EDW reports organizationally to a C-level executive who is accountable for balancing cost of care and quality of care. Level 5 Waste & Care Variability Reduction: Analytic motive is focused on measuring adherence to clinical best practices, minimizing waste, and reducing variability. Data governance expands to support care management teams that are focused on improving the health of patient populations. Population-based analytics are used to suggest improvements to individual patient care. Permanent multidisciplinary teams are in-place that continuously monitor opportunities to improve quality, and reduce risk and cost, across acute care processes, chronic diseases, patient safety scenarios, and internal workflows. Precision of registries is improved by including data from lab, pharmacy, and clinical observations in the definition of the patient cohorts. EDW content is organized into evidence-based, standardized data marts that combine clinical and cost data associated with patient registries. Data content expands to include insurance claims (if not already included) and HIE data feeds. On average, the EDW is updated within one week of source system changes. Level 4 Automated External Reporting: Analytic motive is focused on consistent, efficient production of reports required for regulatory and accreditation requirements (e.g. CMS, Joint Commission, tumor registry, communicable diseases); payer incentives (e.g. MU, PQRS, VBP, readmission reduction); and specialty society databases (e.g. STS, NRMI, Vermont-Oxford). Adherence to industry-standard vocabularies is required. Clinical text data content is available for simple key word searches. Centralized data governance exists for review and approval of externally released data. Level 3 Automated Internal Reporting: Analytic motive is focused on consistent, efficient production of reports supporting basic management and operation of the healthcare organization. Key performance indicators are easily accessible from the executive level to the front-line manager. Corporate and business unit data analysts meet regularly to collaborate and steer the EDW. Data governance expands to raise the data literacy of the organization and develop a data acquisition strategy for Levels 4 and above. Level 2 Standardized Vocabulary & Patient Registries: Master vocabulary and reference data identified and standardized across disparate source system content in the data warehouse. Naming, definition, and data types are consistent with local standards. Patient registries are defined solely on ICD billing data. Data governance forms around the definition and evolution of patient registries and master data management. Level 1 Enterprise Data Warehouse: At a minimum, the following data are co-located in a single data warehouse, locally or hosted: HIMSS EMR Stage 3 data, Revenue Cycle, Financial, Costing, Supply Chain, and Patient Experience. Searchable metadata repository is available across the enterprise. Data content includes insurance claims, if possible. Data warehouse is updated within one month of source system changes. Data governance is forming around the data quality of source systems. The EDW reports organizationally to the CIO. Level 0 Fragmented Point Solutions: Vendor-based and internally developed applications are used to address specific analytic needs as they arise. The fragmented point solutions are neither co-located in a data warehouse nor otherwise architecturally integrated with one another. Overlapping data content leads to multiple versions of analytic truth. Basic internal & external reports are labor intensive and inconsistent. Data governance is non-existent. Self-Assessment
  • 37.
    Workshop – AzureMachine Learning 1. Log in to your Azure account at portal.azure.com. Create an account if needed. 2. Create a Machine Learning workspace. Navigate to More services (bottom of left-hand menu) | Intelligence + Analytics | Machine Learning services (should be 2nd menu item, after HDInsight clusters). 3. Once created, select your ML workspace to expand the options blade. 4. Choose Launch Machine Learning Studio in the Additonal Links section. 5. Click the Sign In button and follow the prompts. 6. Create a new experiment, and choose the sample Quantile Regression: Car Price Prediction. 7. Open https://docs.microsoft.com/en-us/azure/machine-learning/machine- learning-create-experiment. Follow the tutorial to complete the experiment.
  • 38.
    Footnotes 1. National HealthcareExpenditure Projections, 2010-2020. Centers for Medicare and Medicaid Services, Office of the Actuary. 2. Dale Sanders, Vice President, HealthCatalyst. 3. Shahid Shah, www.healthcareguy.com, How to Use Open Source Technologies in Safety- critical Health Applications.