Download to read offline


![3 from Asia: Delta Electronics Workplace Green Maps (Taiwan) AnSan’s
climate countermeasures map (Korea), and Mangrove maps (China)
!""# ! # " $ #
$%&'!() *+,-!./
0123!%&'()*+(),-./!0123-
456789:;<= 4441,-((12(
>
?@
AB
!" C!DE
FGHIJ
# K" LMNOPQRSTU
V# WX"YZ[]PQ^_`a
b" cdefghNHiRSTL
O# UVjRk"lRSmnop
qP#UD!$rLstj"uv?q"
whxyz{L|}% &~j•€U
lfxyL{UQ|•‚5‚5Q"
LNjYZ[QHƒ„i}RSQ
i…mTU#U|sX†g‡ˆ‰L
''
!$ C!Š‹
Œ•Ž••
v‘’•Ž••“”•}–—
˜™š›"œ•žŸ l¡¢£QŽ
•to"¤¥¦štoQ¥§"¨©
}5ª«¬-®¯#°Ž••±²Q
³´µ™š›¶•·¸Ž••¹1
PQŽ•º»¼½"€Ž••¾¿®
‡ÀÁ½QÂÃ"ÄÅžŸ Ælj
Ž•j#
!!
! % " #$%
HÈÉ>ÊËÌ¿ !ÍÎÏÐ
Ñ"#ÒÊÌ¿!ÓÒÔQÕÖ"#×Ì
¿!Ø×Ù"#HÚÛÛÌ¿!ÜÛB"
$$ÖÝÞßà%&'(() *+,&#áâ
ÞÃãäßà#åæfD#w•ß
àa#lãäçèÓéêë'pì'í
ÏQîB#”ïð•ŸQà¿-./0)1ñ
¿®f#”òóôõö÷ø‹ßù“
úû-üQßà(
ê ý þ a ÿ H ! Þ ß à "
2334 !#ï$ãk#ÞßàQ%&w¥'(ý
þ)*¥f# +,-~.~Š/Qïð0íÏä
1( 23%&Qßà455‡•õ†*~#678
9Qù:'߉';<rñ¿( °Þßà=•>fê
?ßQ@A BÀC5D-Q# iEFÙGõ'H
IPQHãJKL'íÏ@A 'ê*MNO 'PQ
ßùìR2SQprr( vTõ†UÌVWH
X#BÀYZ®QÞßàá•[|ßUÌ?ß]
^Qãä÷ã_àî ( `acH!
ßàg•bHcY # dej]fg
ã_QŠhŠi(
ad#)j]çk*lmï³no
Ïpqrst#bOud-vw!Þ
ßà#iE;<xFyÞßà 'z{
|}~•€•§³noêëÏ‚Ù
ÞßàJ;<ƒ„FÙÞßà#…À
X-vmï³noÏpqr{;<
xFy†;<ƒ„FÙQ퇈‰
Š‹( aŒ•)j]çk*•!Ž-X
!ß•HoX" íÏä1•kQ‘H
íÏŒ1(
Þßà…‡’’•H!ßà°“#á•ãämp
ì'ã_'íÏ'”•Q–W( —˜tjL™ãämé
QQš+( vT›œQx:#4••}žŸQÜ ¡#
¢£¤¥Q¦§#”(¨Q©ª#«¨¬-zLÖ
Qgf(
L™¦®#H!ÞßàQ鯡°#•[¤1p
Q#4±Óö÷ôB²³´µ¶·Q¸>¹•(
!"#$%&'()
!à~º»mH¼YH
ã½¾¿(À)JÁQÀ
bÀHoÂ" ‹L™ü
¿Þßàïð•Ÿñ
¿# Á™Ã:mHãa
çÄÄ-X…ÅÆjƒ
„FÙÞßàQÇ4È
5#
?@ÉÊ
Þßà
&' !"#!$ (](https://image.slidesharecdn.com/climategreenmap2014-140819192717-phpapp01/85/Climate-Green-Maps-2014-16-320.jpg)


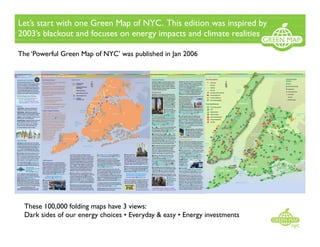
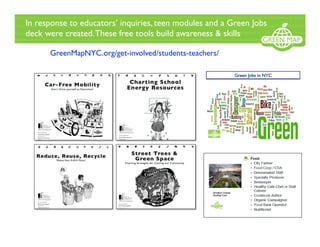
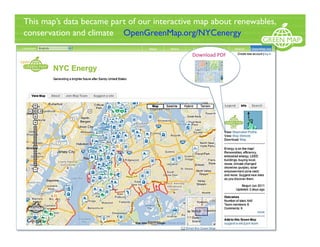
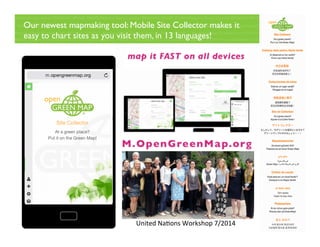
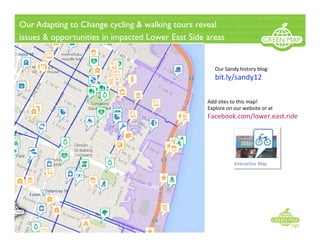
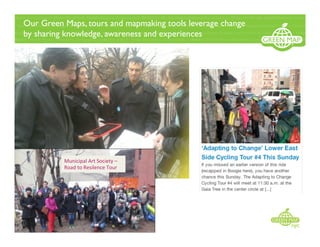
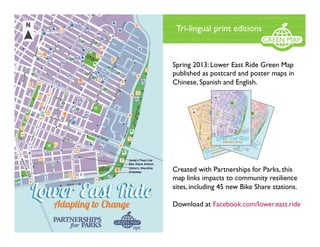
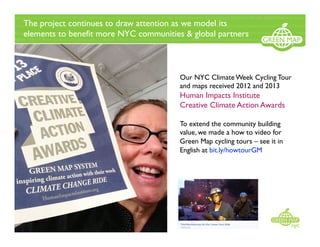
The document discusses the 'Powerful Green Map of NYC', which was created to raise awareness about energy choices and climate impacts. It highlights various tools and resources, including interactive maps and educational modules for students and teachers, that aim to promote community resilience and renewable energy. The initiative involved partnerships, cycling tours, and localized mapping efforts across 40 countries, focusing on both local and global environmental issues.


