Download as PDF, PPTX


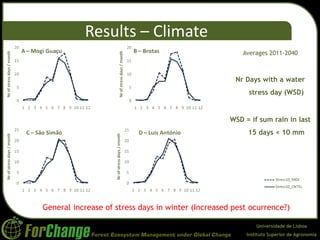


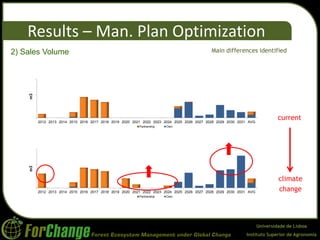


O estudo avaliou o impacto das mudanças climáticas nos planos de manejo florestal para plantações de eucalipto no Brasil, utilizando modelos de crescimento e otimização. Os resultados indicaram uma redução de 3-5% na produtividade florestal, com um aumento nos custos operacionais e uma diminuição nas áreas vendidas. Conclui-se que as mudanças climáticas poderão resultar em maiores precipitações de verão e menores no inverno, afetando significativamente os objetivos de manejo florestal.


