Download to read offline


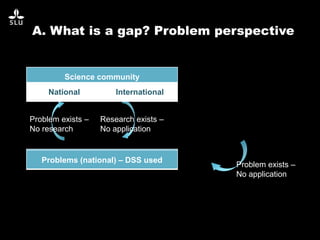
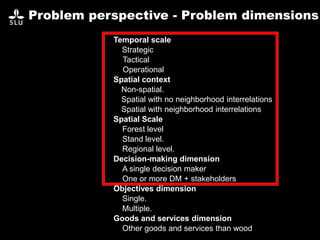


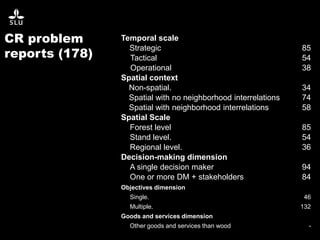


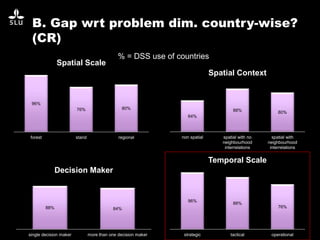

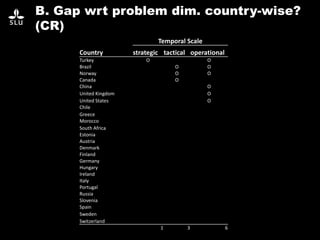
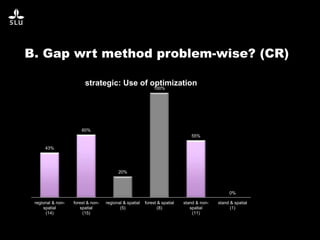
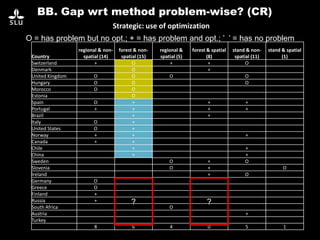

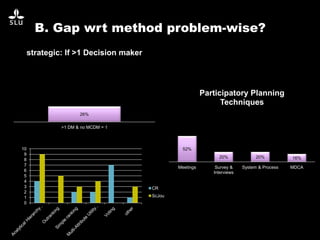
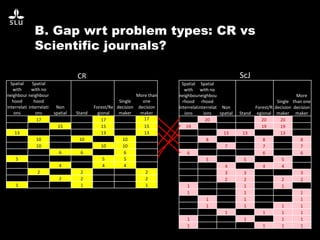
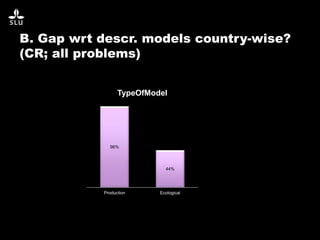


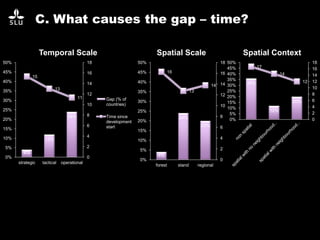

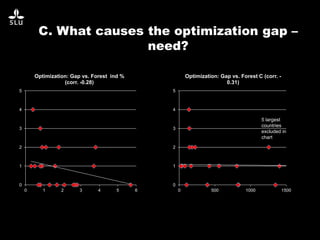


The document discusses the potential of forest decision support systems in managing the impacts of climate change on forest resources. It highlights existing gaps in research and application across various countries, analyzing the use of decision support systems in relation to temporal, spatial, and decision-making dimensions. Additionally, it explores barriers affecting the adoption of these systems, including resource availability and institutional structures.


![[Day 2] Center Presentation: ICIMOD (2/2)](https://cdn.slidesharecdn.com/ss_thumbnails/cgiar-csi-day2-1apr2009-center-icimod-pt2-090405003338-phpapp02-thumbnail.jpg?width=640&height=640&fit=bounds)


