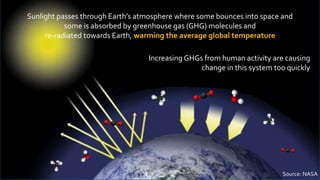
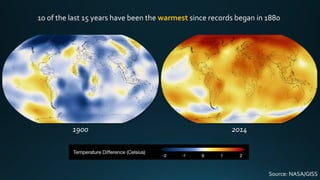
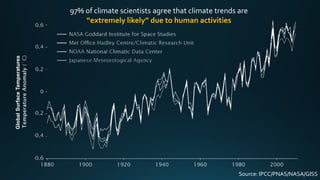
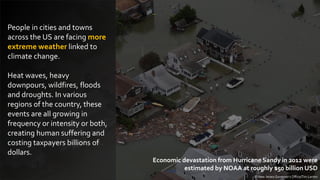
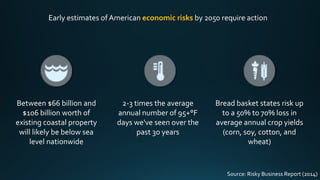
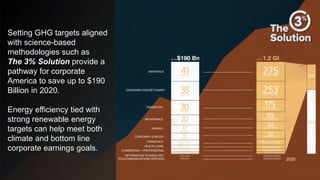
2. Sunlight passes through Earth’s atmosphere where some bounces into space and
some is absorbed by greenhouse gas (GHG) molecules and
re-radiated towards Earth, warming the average global temperature
Increasing GHGs from human activity are causing
change in this system too quickly
Source: NASA
3. 1900 2014
10 of the last 15 years have been the warmest since records began in 1880
Source: NASA/GISS
4. Source: IPCC/PNAS/NASA/GISS
97% of climate scientists agree that climate trends are
“extremely likely” due to human activitiesGlobalSurfaceTemperatures
5. Cumulative greenhouse gas levels are at historic highs and continue to climb
Roughly 62% of US emissions come from the corporate sector
Source: NOAA/WWF/CDP/McKinsey
10. Between $66 billion and
$106 billion worth of
existing coastal property
will likely be below sea
level nationwide
2-3 times the average
annual number of 95+°F
days we've seen over the
past 30 years
Bread basket states risk up
to a 50% to 70% loss in
average annual crop yields
(corn, soy, cotton, and
wheat)
Early estimates of American economic risks by 2050 require action
Source: Risky Business Report (2014)
11. Setting GHG targets aligned
with science-based
methodologies such as
The 3% Solution provide a
pathway for corporate
America to save up to $190
Billion in 2020.
Energy efficiency tied with
strong renewable energy
targets can help meet both
climate and bottom line
corporate earnings goals.
2020
MATERIALS
CONSUMER DISCRETIONARY
TRANSPORT
INDUSTRIALS
ENERGY
CONSUMER STAPLES
FINANCIALS
HEALTH CARE
COMMERCIAL + PROFESSIONAL
INFORMATION TECHNOLOGY
TELECOMMUNICATIONS SERVICES
Editor's Notes
A layer of greenhouse gases – primarily water vapor, and including much smaller amounts of carbon dioxide, methane and nitrous oxide – acts as a thermal blanket for the Earth, absorbing heat and warming the surface to a life-supporting average of 59 degrees Fahrenheit (15 degrees Celsius).
Certain gases in the atmosphere block heat from escaping. Long-lived gases that remain semi-permanently in the atmosphere and do not respond physically or chemically to changes in temperature are described as "forcing" climate change. Gases, such as water vapor, which respond physically or chemically to changes in temperature are seen as "feedbacks.“
Gases that contribute to the greenhouse effect include:
Water vapor. The most abundant greenhouse gas, but importantly, it acts as a feedback to the climate. Water vapor increases as the Earth's atmosphere warms, but so does the possibility of clouds and precipitation, making these some of the most important feedback mechanisms to the greenhouse effect.
Carbon dioxide (CO2). A minor but very important component of the atmosphere, carbon dioxide is released through natural processes such as respiration and volcano eruptions and through human activities such as deforestation, land use changes, and burning fossil fuels. Humans have increased atmospheric CO2 concentration by a third since the Industrial Revolution began. This is the most important long-lived "forcing" of climate change.
Methane. A hydrocarbon gas produced both through natural sources and human activities, including the decomposition of wastes in landfills, agriculture, and especially rice cultivation, as well as ruminant digestion and manure management associated with domestic livestock. On a molecule-for-molecule basis, methane is a far more active greenhouse gas than carbon dioxide, but also one which is much less abundant in the atmosphere.
Nitrous oxide. A powerful greenhouse gas produced by soil cultivation practices, especially the use of commercial and organic fertilizers, fossil fuel combustion, nitric acid production, and biomass burning.
Chlorofluorocarbons (CFCs). Synthetic compounds entirely of industrial origin used in a number of applications, but now largely regulated in production and release to the atmosphere by international agreement for their ability to contribute to destruction of the ozone layer. They are also greenhouse gases.
Other trace gases such as HFCs, PFCs, and SF6
Source:
NASA (2015). Available at: http://climate.nasa.gov/causes/
The images show five-year average variations of global surface temperatures of 1900 and 2014. Dark blue indicates areas cooler than average. Dark red indicates areas warmer than average.
Source:
NASA/GISS (2014). Available at: http://climate.nasa.gov/vital-signs/global-temperature/
Ninety-seven percent of climate scientists agree that climate-warming trends over the past century are very likely due to human activities, and most of the leading scientific organizations worldwide have issued public statements endorsing this position. (IPCC AR5)
Source:
IPCC/PNAS/NASA/GISS (2014). Available at: http://climate.nasa.gov/scientific-consensus/
Carbon dioxide (CO2) is an important heat-trapping (greenhouse) gas, which is released through human activities such as deforestation and burning fossil fuels, as well as natural processes such as respiration and volcanic eruptions. The chart shows CO2 levels during the last three glacial cycles, as reconstructed from ice cores.
Sources:
WWF, CDP, McKinsey, The 3% Solution (2013). Available at: www.the3percentsolution.org
NOAA/NASA (2015). Available at: http://climate.nasa.gov/vital-signs/carbon-dioxide/
Source:
PWC (2012). Available at http://www.pwc.com/gx/en/governance-risk-compliance-consulting-services/resilience/publications/business-not-as-usual.jhtml
Source:
NOAA (2012). Available at: http://www.nhc.noaa.gov/data/tcr/AL182012_Sandy.pdf
Source:
Risky Business Report (2014). Available at: www.riskybusiness.org/uploads/files/RiskyBusiness_Report_WEB_09_08_14.pdf
Sources:
WWF, CDP, McKinsey, The 3% Solution (2013). Available at: www.the3percentsolution.org