Download to read offline
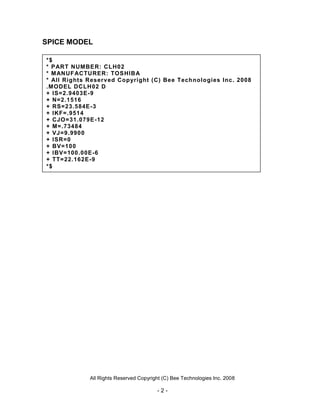
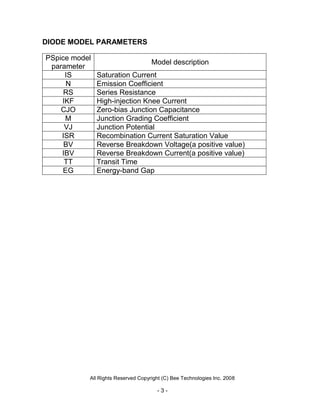
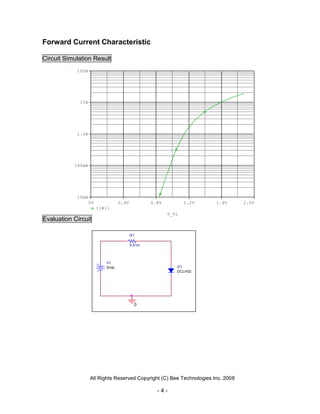
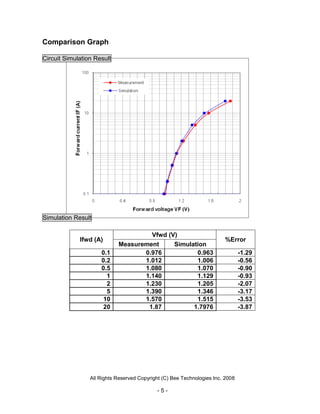
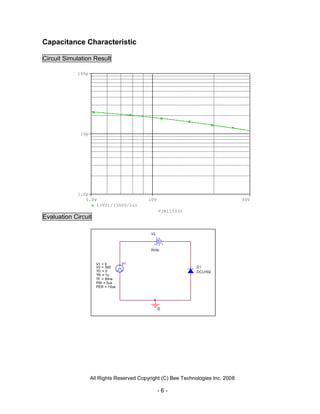
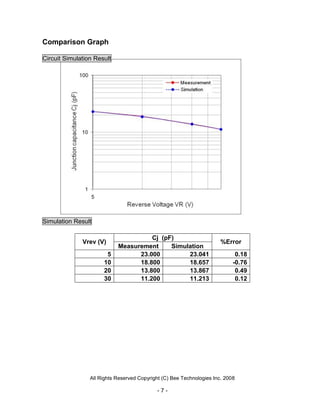
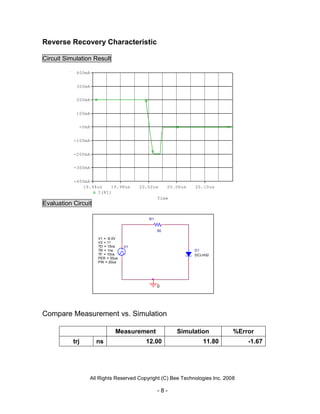
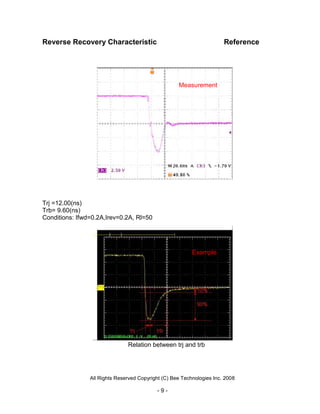

This document contains a device modeling report for the Toshiba CLH02 diode, detailing its SPICE model parameters such as saturation current, series resistance, and junction capacitance. Additionally, it includes simulation results for forward current characteristics, capacitance, and reverse recovery characteristics, comparing experimental measurements with simulation results and presenting % errors. The report highlights key performance metrics and characteristics pertinent to the diode's operation.


