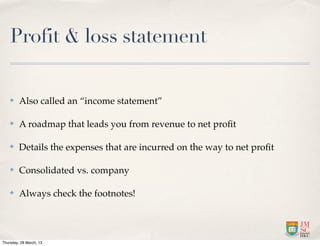
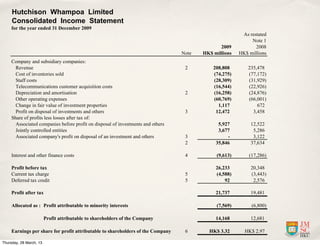
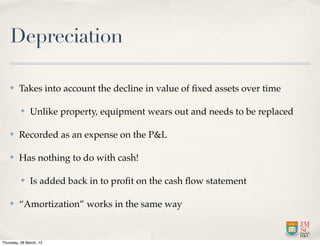
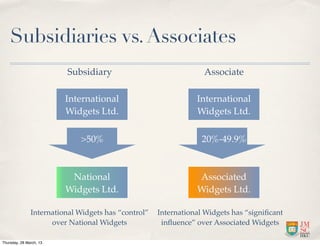
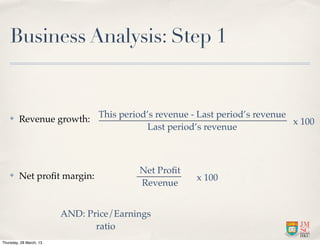
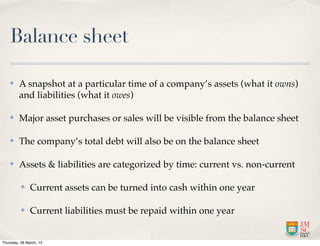
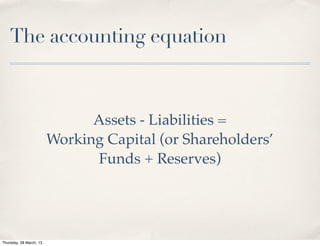
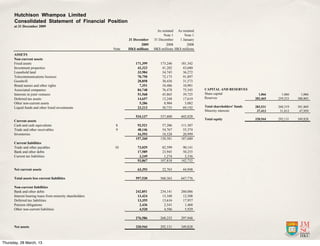
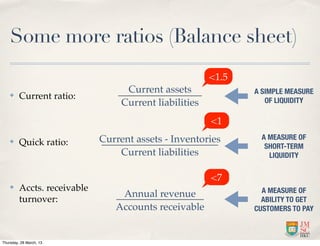
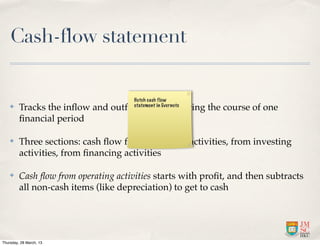
Global Financial Journalism
    Week 7: Analyzing Profit & Loss Statements

    Jeffrey Timmermans


Thursday, 28 March, 13
Corporate disclosure

    ✤    Directors’ report

    ✤    Auditor’s report

    ✤    Profit & loss (or income) statement (P&L)

    ✤    Balance sheet

    ✤    Cash-flow statement

    ✤    Footnotes


Thursday, 28 March, 13
Profit & loss statement

    ✤    Also called an “income statement”

    ✤    A roadmap that leads you from revenue to net profit

    ✤    Details the expenses that are incurred on the way to net profit

    ✤    Consolidated vs. company

    ✤    Always check the footnotes!


Thursday, 28 March, 13
Hutchison Whampoa Limited
     Consolidated Income Statement
     for the year ended 31 December 2009
                                                                                                         As restated
                                                                                                             Note 1
                                                                                                2009           2008
                                                                                  Note   HK$ millions   HK$ millions
     Company and subsidiary companies:
       Revenue                                                                     2         208,808        235,478
       Cost of inventories sold                                                              (74,275)       (77,172)
       Staff costs                                                                           (28,309)       (31,929)
       Telecommunications customer acquisition costs                                         (16,544)       (22,926)
       Depreciation and amortisation                                               2         (16,258)       (24,876)
       Other operating expenses                                                              (60,769)       (66,001)
       Change in fair value of investment properties                                           1,117            672
       Profit on disposal of investments and others                                3          12,472          3,458
     Share of profits less losses after tax of:
       Associated companies before profit on disposal of investments and others                5,927         12,522
       Jointly controlled entities                                                             3,677          5,286
       Associated company's profit on disposal of an investment and others         3               -          3,122
                                                                                   2          35,846         37,634

     Interest and other finance costs                                              4          (9,613)       (17,286)

     Profit before tax                                                                        26,233         20,348
     Current tax charge                                                            5          (4,588)        (3,443)
     Deferred tax credit                                                           5              92          2,576

     Profit after tax                                                                         21,737         19,481

     Allocated as : Profit attributable to minority interests                                 (7,569)        (6,800)

                         Profit attributable to shareholders of the Company                   14,168         12,681

     Earnings per share for profit attributable to shareholders of the Company     6       HK$ 3.32       HK$ 2.97

Thursday, 28 March, 13
The importance of cash


                         Profit is opinion, cash is fact

      COMPANIES CAN LIE, BUT CASH CAN’T


Thursday, 28 March, 13
Opinion in the P&L

    ✤    Revenue booked at time of sale

    ✤    Length of useful life of fixed assets

    ✤    Some expenses might be capitalized as assets

    ✤    Sales to related entities recorded as ordinary revenue

    ✤    Non-operating or “Other” income

    ✤    “Extraordinary” or “one-time” profit/loss; investment write-downs


Thursday, 28 March, 13
Accrual accounting


                              $4 000
                         HK


Thursday, 28 March, 13
Accrual accounting


                     Revenue     Card balance
                    +HK$4000      +HK$4000
             Accts. receivable
               +HK$4000

                Net profit
             +(HK$4000-cost)


Thursday, 28 March, 13
Accrual accounting


             Accts. receivable
                -HK$4000

                      Cash       Card balance
                    +HK$4000      -HK$4000
                    Cash
               -cost of iPhone
               Accts. payable
               -cost of iPhone
Thursday, 28 March, 13
Depreciation

    ✤    Takes into account the decline in value of fixed assets over time

          ✤    Unlike property, equipment wears out and needs to be replaced

    ✤    Recorded as an expense on the P&L

    ✤    Has nothing to do with cash!

          ✤    Is added back in to profit on the cash flow statement

    ✤    “Amortization” works in the same way


Thursday, 28 March, 13
Subsidiaries vs. Associates
                         Subsidiary                               Associate

                         International                          International
                         Widgets Ltd.                           Widgets Ltd.

                             >50%                                 20%-49.9%


                          National                              Associated
                         Widgets Ltd.                           Widgets Ltd.

               International Widgets has “control”   International Widgets has “significant
                     over National Widgets            influence” over Associated Widgets

Thursday, 28 March, 13
Minority interests


                          National
                         Widgets Ltd.


                                            20
                  80%        Profit


                                              %
                                               st
                 stake      (100%)


                                                  a
                                                  ke
                         International                 Fred’s House of
                                            20%
                         Widgets Ltd.                   Pancakes Ltd.
                                         Minority
                                         interests

Thursday, 28 March, 13
Business Analysis: Step 1


    ✤    Revenue growth: This period’s revenue - Last period’s revenue x 100
                                    Last period’s revenue


                                         Net Profit
    ✤    Net profit margin:                           x 100
                                         Revenue


                         AND: Price/Earnings
                                ratio
Thursday, 28 March, 13
Balance sheet

    ✤    A snapshot at a particular time of a company’s assets (what it owns)
         and liabilities (what it owes)

    ✤    Major asset purchases or sales will be visible from the balance sheet

    ✤    The company’s total debt will also be on the balance sheet

    ✤    Assets & liabilities are categorized by time: current vs. non-current

          ✤    Current assets can be turned into cash within one year

          ✤    Current liabilities must be repaid within one year


Thursday, 28 March, 13
The accounting equation


                               Assets - Liabilities =
                         Working Capital (or Shareholders’
                               Funds + Reserves)


Thursday, 28 March, 13
Current liabilities                     157,260       130,581      187,680
                                                                         Current liabilities                          Trade and other payables                                              10
                                                                         Trade and other payables                     Bank and other debts 10                  73,029        82,599       90,141
                                                                         Bank and other debts                         Current tax liabilities                  17,589        23,945       50,255
     Hutchison Whampoa Limited                                           Current tax liabilities                                                                3,249         1,274        2,336
     Consolidated Statement of Financial Position                                                                                                              93,867       107,818      142,732
     at 31 December 2009                                                                                              Net current assets
                                                                         Net current assets                                                                    63,393        22,763       44,948
                                                                                   As restated As restated
                                                                                        Note 1          Note 1        Total assets less current liabilities
                                                                       Total assets less current liabilities                                                  597,530       560,363      647,776
                                                                31 December     31 December         1 January
                                                                                                                       Non-current liabilities
                                                                       2009               2008
                                                                       Non-current liabilities            2008
                                                                                                                       Bank and other debts
                                                         Note   HK$ millions andHK$ millions HK$ millions
                                                                       Bank      other debts                                                                242,851         234,141      260,086
                                                                                                                       Interest bearing loans from minority shareholders
     ASSETS                                                             Interest bearing loans from minority shareholders                                    13,424          13,348       12,508
                                                                                                                       Deferred tax liabilities
     Non-current assets                                                 Deferred tax liabilities                                                             13,355          13,616       17,957
                                                                                                                       Pension obligations
                                                                        Pension obligations                                                                   2,436           2,541        1,468
     Fixed assets                                                    171,399           173,246        181,342          Other non-current liabilities
                                                                        Other non-current liabilities                                                         4,520           4,586        5,929
     Investment properties                                            42,323            41,282         43,680
     Leasehold land                                                   33,984            34,745         36,272                                               276,586         268,232      297,948
     Telecommunications licences                                      70,750            72,175         91,897
     Goodwill                                                         28,858assets
                                                                        Net             30,436         31,573          Net assets                           320,944         292,131      349,828
     Brand names and other rights                                      7,351            10,486         10,901
     Associated companies                                             84,748
                                                                        CAPITAL AND RESERVES75,545
                                                                                        76,478                         CAPITAL AND RESERVES
     Interests in joint ventures                                      51,568 capital 45,865
                                                                        Share                          39,725          Share capital                          1,066           1,066        1,066
     Deferred tax assets                                                Reserves
                                                                      14,657            13,248         17,619          Reserves                             282,465         259,253      300,803
     Other non-current assets                                          5,286              8,904         5,082
     Liquid funds and other listed investments                          Total shareholders' funds
                                                                      23,213            30,735         69,192          Total shareholders' funds            283,531         260,319      301,869
                                                                        Minority interests                             Minority interests                    37,413          31,812       47,959
                                                                     534,137            537,600      602,828
                                                                         Total equity                                 Total equity                            320,944       292,131      349,828
     Current assets
     Cash and cash equivalents                            8           92,521             57,286      111,307
     Trade and other receivables                          9           48,146             54,767       55,374
     Inventories                                                      16,593             18,528       20,999                                                                            Appendix
                                                                     157,260            130,581      187,680                                                               HWL 2009 Annual Results
     Current liabilities                                                                                                                                                              Page 3 of 27
     Trade and other payables                            10           73,029             82,599       90,141
     Bank and other debts                                             17,589             23,945       50,255
     Current tax liabilities                                           3,249              1,274        2,336
                                                                      93,867            107,818      142,732

     Net current assets                                               63,393             22,763        44,948

     Total assets less current liabilities                           597,530            560,363      647,776

     Non-current liabilities
     Bank and other debts                                            242,851            234,141      260,086
     Interest bearing loans from minority shareholders                13,424             13,348       12,508
     Deferred tax liabilities                                         13,355             13,616       17,957
     Pension obligations                                               2,436              2,541        1,468
     Other non-current liabilities                                     4,520              4,586        5,929

                                                                     276,586            268,232      297,948

     Net assets                                                      320,944            292,131      349,828

      CAPITAL AND RESERVES
      Share capital                                                    1,066              1,066        1,066
Thursday, 28 March, 13
      Reserves                                                       282,465            259,253      300,803
Some more ratios (Balance sheet)
                                                        <1.5
                                   Current assets              A SIMPLE MEASURE
    ✤    Current ratio:                                           OF LIQUIDITY
                                  Current liabilities
                                                        <1
                             Current assets - Inventories        A MEASURE OF
    ✤    Quick ratio:                                             SHORT-TERM
                                 Current liabilities               LIQUIDITY


                                                        <7
    ✤    Accts. receivable                                       A MEASURE OF
                                 Annual revenue
         turnover:                                               ABILITY TO GET
                                Accounts receivable            CUSTOMERS TO PAY


Thursday, 28 March, 13
Cash-flow statement

                                      Hutch cash flow
    ✤    Tracks the inflow and outflow of cash during the course of one
                                      statement in Evernote

         financial period

    ✤    Three sections: cash flow from operating activities, from investing
         activities, from financing activities

    ✤    Cash flow from operating activities starts with profit, and then subtracts
         all non-cash items (like depreciation) to get to cash


Thursday, 28 March, 13
And still more ratios


    ✤    Inventory turnover:                           <4
               Annual cost of goods sold                    A MEASURE OF THE
                                                            AGE OF INVENTORY
        (Beginning inventory + final inventory)/2


                                                       >1
                                   Total liabilities         A MEASURE OF
    ✤    Debt-to-equity ratio:                               INDEBTEDNESS
                                 Shareholders’ funds


Thursday, 28 March, 13
Some other red flags

    ✤    Declining trend in net and operating profit over several years

    ✤    Compare cash flow from operations with net profit

          ✤    Are both trending higher, by same general percentage?

    ✤    Off-balance sheet entities

    ✤    Presence of “non-recurring charges” year after year


Thursday, 28 March, 13
Reading List


    ✤    Taparia, J. (2004). Understanding Financial Statements : A Journalist's
         Guide. Oak Park, IL: Marion Street Press.

    ✤    Vause, B. (2009). Guide to Analysing Companies (5th ed.). New York:
         Bloomberg Press.

    ✤    Fraser, L. M., & Ormiston, A. (2010). Understanding Financial
         Statements (9th ed.). Upper Saddle River, N.J.: Prentice Hall.


Thursday, 28 March, 13

Class7

  • 1.
    Global Financial Journalism Week 7: Analyzing Profit & Loss Statements Jeffrey Timmermans Thursday, 28 March, 13
  • 2.
    Corporate disclosure ✤ Directors’ report ✤ Auditor’s report ✤ Profit & loss (or income) statement (P&L) ✤ Balance sheet ✤ Cash-flow statement ✤ Footnotes Thursday, 28 March, 13
  • 3.
    Profit & lossstatement ✤ Also called an “income statement” ✤ A roadmap that leads you from revenue to net profit ✤ Details the expenses that are incurred on the way to net profit ✤ Consolidated vs. company ✤ Always check the footnotes! Thursday, 28 March, 13
  • 4.
    Hutchison Whampoa Limited Consolidated Income Statement for the year ended 31 December 2009 As restated Note 1 2009 2008 Note HK$ millions HK$ millions Company and subsidiary companies: Revenue 2 208,808 235,478 Cost of inventories sold (74,275) (77,172) Staff costs (28,309) (31,929) Telecommunications customer acquisition costs (16,544) (22,926) Depreciation and amortisation 2 (16,258) (24,876) Other operating expenses (60,769) (66,001) Change in fair value of investment properties 1,117 672 Profit on disposal of investments and others 3 12,472 3,458 Share of profits less losses after tax of: Associated companies before profit on disposal of investments and others 5,927 12,522 Jointly controlled entities 3,677 5,286 Associated company's profit on disposal of an investment and others 3 - 3,122 2 35,846 37,634 Interest and other finance costs 4 (9,613) (17,286) Profit before tax 26,233 20,348 Current tax charge 5 (4,588) (3,443) Deferred tax credit 5 92 2,576 Profit after tax 21,737 19,481 Allocated as : Profit attributable to minority interests (7,569) (6,800) Profit attributable to shareholders of the Company 14,168 12,681 Earnings per share for profit attributable to shareholders of the Company 6 HK$ 3.32 HK$ 2.97 Thursday, 28 March, 13
  • 5.
    The importance ofcash Profit is opinion, cash is fact COMPANIES CAN LIE, BUT CASH CAN’T Thursday, 28 March, 13
  • 6.
    Opinion in theP&L ✤ Revenue booked at time of sale ✤ Length of useful life of fixed assets ✤ Some expenses might be capitalized as assets ✤ Sales to related entities recorded as ordinary revenue ✤ Non-operating or “Other” income ✤ “Extraordinary” or “one-time” profit/loss; investment write-downs Thursday, 28 March, 13
  • 7.
    Accrual accounting $4 000 HK Thursday, 28 March, 13
  • 8.
    Accrual accounting Revenue Card balance +HK$4000 +HK$4000 Accts. receivable +HK$4000 Net profit +(HK$4000-cost) Thursday, 28 March, 13
  • 9.
    Accrual accounting Accts. receivable -HK$4000 Cash Card balance +HK$4000 -HK$4000 Cash -cost of iPhone Accts. payable -cost of iPhone Thursday, 28 March, 13
  • 10.
    Depreciation ✤ Takes into account the decline in value of fixed assets over time ✤ Unlike property, equipment wears out and needs to be replaced ✤ Recorded as an expense on the P&L ✤ Has nothing to do with cash! ✤ Is added back in to profit on the cash flow statement ✤ “Amortization” works in the same way Thursday, 28 March, 13
  • 11.
    Subsidiaries vs. Associates Subsidiary Associate International International Widgets Ltd. Widgets Ltd. >50% 20%-49.9% National Associated Widgets Ltd. Widgets Ltd. International Widgets has “control” International Widgets has “significant over National Widgets influence” over Associated Widgets Thursday, 28 March, 13
  • 12.
    Minority interests National Widgets Ltd. 20 80% Profit % st stake (100%) a ke International Fred’s House of 20% Widgets Ltd. Pancakes Ltd. Minority interests Thursday, 28 March, 13
  • 13.
    Business Analysis: Step1 ✤ Revenue growth: This period’s revenue - Last period’s revenue x 100 Last period’s revenue Net Profit ✤ Net profit margin: x 100 Revenue AND: Price/Earnings ratio Thursday, 28 March, 13
  • 14.
    Balance sheet ✤ A snapshot at a particular time of a company’s assets (what it owns) and liabilities (what it owes) ✤ Major asset purchases or sales will be visible from the balance sheet ✤ The company’s total debt will also be on the balance sheet ✤ Assets & liabilities are categorized by time: current vs. non-current ✤ Current assets can be turned into cash within one year ✤ Current liabilities must be repaid within one year Thursday, 28 March, 13
  • 15.
    The accounting equation Assets - Liabilities = Working Capital (or Shareholders’ Funds + Reserves) Thursday, 28 March, 13
  • 16.
    Current liabilities 157,260 130,581 187,680 Current liabilities Trade and other payables 10 Trade and other payables Bank and other debts 10 73,029 82,599 90,141 Bank and other debts Current tax liabilities 17,589 23,945 50,255 Hutchison Whampoa Limited Current tax liabilities 3,249 1,274 2,336 Consolidated Statement of Financial Position 93,867 107,818 142,732 at 31 December 2009 Net current assets Net current assets 63,393 22,763 44,948 As restated As restated Note 1 Note 1 Total assets less current liabilities Total assets less current liabilities 597,530 560,363 647,776 31 December 31 December 1 January Non-current liabilities 2009 2008 Non-current liabilities 2008 Bank and other debts Note HK$ millions andHK$ millions HK$ millions Bank other debts 242,851 234,141 260,086 Interest bearing loans from minority shareholders ASSETS Interest bearing loans from minority shareholders 13,424 13,348 12,508 Deferred tax liabilities Non-current assets Deferred tax liabilities 13,355 13,616 17,957 Pension obligations Pension obligations 2,436 2,541 1,468 Fixed assets 171,399 173,246 181,342 Other non-current liabilities Other non-current liabilities 4,520 4,586 5,929 Investment properties 42,323 41,282 43,680 Leasehold land 33,984 34,745 36,272 276,586 268,232 297,948 Telecommunications licences 70,750 72,175 91,897 Goodwill 28,858assets Net 30,436 31,573 Net assets 320,944 292,131 349,828 Brand names and other rights 7,351 10,486 10,901 Associated companies 84,748 CAPITAL AND RESERVES75,545 76,478 CAPITAL AND RESERVES Interests in joint ventures 51,568 capital 45,865 Share 39,725 Share capital 1,066 1,066 1,066 Deferred tax assets Reserves 14,657 13,248 17,619 Reserves 282,465 259,253 300,803 Other non-current assets 5,286 8,904 5,082 Liquid funds and other listed investments Total shareholders' funds 23,213 30,735 69,192 Total shareholders' funds 283,531 260,319 301,869 Minority interests Minority interests 37,413 31,812 47,959 534,137 537,600 602,828 Total equity Total equity 320,944 292,131 349,828 Current assets Cash and cash equivalents 8 92,521 57,286 111,307 Trade and other receivables 9 48,146 54,767 55,374 Inventories 16,593 18,528 20,999 Appendix 157,260 130,581 187,680 HWL 2009 Annual Results Current liabilities Page 3 of 27 Trade and other payables 10 73,029 82,599 90,141 Bank and other debts 17,589 23,945 50,255 Current tax liabilities 3,249 1,274 2,336 93,867 107,818 142,732 Net current assets 63,393 22,763 44,948 Total assets less current liabilities 597,530 560,363 647,776 Non-current liabilities Bank and other debts 242,851 234,141 260,086 Interest bearing loans from minority shareholders 13,424 13,348 12,508 Deferred tax liabilities 13,355 13,616 17,957 Pension obligations 2,436 2,541 1,468 Other non-current liabilities 4,520 4,586 5,929 276,586 268,232 297,948 Net assets 320,944 292,131 349,828 CAPITAL AND RESERVES Share capital 1,066 1,066 1,066 Thursday, 28 March, 13 Reserves 282,465 259,253 300,803
  • 17.
    Some more ratios(Balance sheet) <1.5 Current assets A SIMPLE MEASURE ✤ Current ratio: OF LIQUIDITY Current liabilities <1 Current assets - Inventories A MEASURE OF ✤ Quick ratio: SHORT-TERM Current liabilities LIQUIDITY <7 ✤ Accts. receivable A MEASURE OF Annual revenue turnover: ABILITY TO GET Accounts receivable CUSTOMERS TO PAY Thursday, 28 March, 13
  • 18.
    Cash-flow statement Hutch cash flow ✤ Tracks the inflow and outflow of cash during the course of one statement in Evernote financial period ✤ Three sections: cash flow from operating activities, from investing activities, from financing activities ✤ Cash flow from operating activities starts with profit, and then subtracts all non-cash items (like depreciation) to get to cash Thursday, 28 March, 13
  • 19.
    And still moreratios ✤ Inventory turnover: <4 Annual cost of goods sold A MEASURE OF THE AGE OF INVENTORY (Beginning inventory + final inventory)/2 >1 Total liabilities A MEASURE OF ✤ Debt-to-equity ratio: INDEBTEDNESS Shareholders’ funds Thursday, 28 March, 13
  • 20.
    Some other redflags ✤ Declining trend in net and operating profit over several years ✤ Compare cash flow from operations with net profit ✤ Are both trending higher, by same general percentage? ✤ Off-balance sheet entities ✤ Presence of “non-recurring charges” year after year Thursday, 28 March, 13
  • 21.
    Reading List ✤ Taparia, J. (2004). Understanding Financial Statements : A Journalist's Guide. Oak Park, IL: Marion Street Press. ✤ Vause, B. (2009). Guide to Analysing Companies (5th ed.). New York: Bloomberg Press. ✤ Fraser, L. M., & Ormiston, A. (2010). Understanding Financial Statements (9th ed.). Upper Saddle River, N.J.: Prentice Hall. Thursday, 28 March, 13