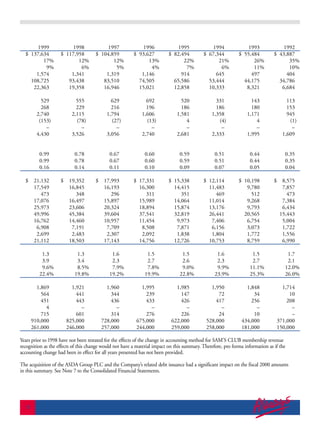
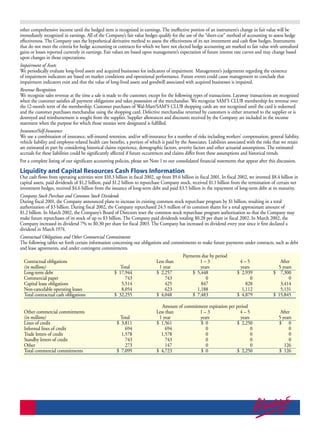
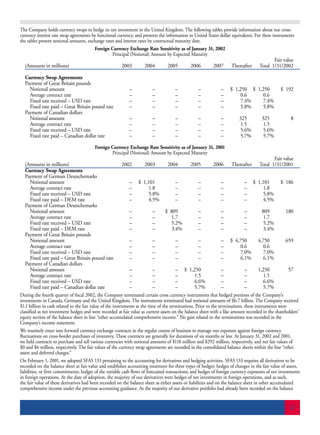
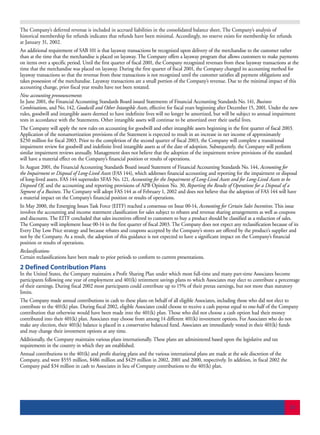
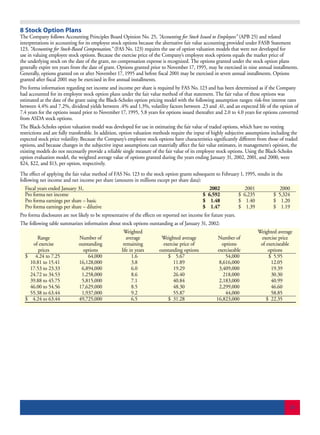
This document provides an 11-year financial summary for Walmart from 1992-2002. Some key details include:
- Net sales increased 14% in 2002 to $217.8 billion, with a 6% increase in domestic store sales. Operating expenses rose slightly as a percentage of sales.
- Earnings per share were $1.49 in 2002, up from $1.41 in 2001. Return on assets was 8.5% and return on equity was 20.1%.
- The number of U.S. stores grew to include over 1,000 Supercenters and 500 SAM'S Clubs, with international units totaling over 1,170.
This 11-year financial summary provides key financial data for Walmart from 1993 to 2003. Over this period, Walmart experienced significant growth, with net sales increasing from $55.4 billion in 1993 to $244.5 billion in 2003, a 12% increase from the prior year. This growth was driven by expansion of stores both domestically and internationally as well as increasing comparable store sales. Gross margins increased slightly from 21.23% to 21.55% from 2002 to 2003 due to lower shrinkage and markdowns. Operating expenses also increased slightly as a percentage of sales due to higher insurance and payroll costs. Overall, the financial summary shows Walmart's continued growth and expansion globally over an 11-year period.
This document provides State Street Corporation's 2002 financial review, including selected financial data and management's discussion and analysis. Key points:
1) Net income was $1.015 billion, up $387 million from 2001, driven largely by a $495 million gain from selling the corporate trust business. Adjusting for non-operating items, net income rose $32 million.
2) Earnings per share were $3.10, up from $1.90 in 2001. Excluding non-operating items, EPS rose from $2.08 to $2.20.
3) Total revenue increased $569 million to $4.396 billion, as the company expanded its product offerings and client base despite
- BB&T Corporation reported lower operating earnings for the fourth quarter of 2008 compared to the same period in 2007. Operating earnings available to common shareholders decreased 41.4% to $243 million.
- Net interest income increased 14.2% to $1,132 million due to higher interest income, but this was more than offset by a large increase in the provision for credit losses of $344 million.
- Returns and profitability ratios declined from the prior year, with the return on average common equity decreasing to 7.26% and the efficiency ratio worsening to 51.9%.
Allstate operates from a strong financial position with over $104 billion in assets and $17.5 billion in shareholders' equity. It provides insurance and financial services to over 14 million households in the US. Allstate has $104.8 billion in assets and generates most of its revenues from property-liability insurance premiums and contract charges from its financial business. For 2000, Allstate reported revenues of $29.1 billion and net income of $2.2 billion.
This document is BB&T Corporation's 2005 annual report. It provides financial highlights for 2005, noting that net income increased 6.1% to $1.654 billion and diluted earnings per share grew 7.1% to $3.00. Operating earnings rose 7.2% to $1.674 billion. Cash basis operating earnings, which exclude intangible assets and purchase accounting adjustments, increased 7.1% to $1.763 billion. The report discusses BB&T's strong loan, deposit and balance sheet growth in 2005 and notes the bank hired additional revenue producers and implemented strategies to boost organic account growth.
- The document is the consolidated financial statements of United Bank Limited and its subsidiaries for the quarter ended March 31, 2009.
- It includes the consolidated balance sheet, profit and loss account, cash flow statement, and statement of changes in equity for the quarter.
- The balance sheet shows total assets of Rs. 641.9 billion, total liabilities of Rs. 586.8 billion, and net assets of Rs. 55.2 billion as of March 31, 2009.
This document is Morgan Stanley's annual report for fiscal year 2001. It provides the following key information in 3 sentences:
Morgan Stanley's net income for 2001 was $3.6 billion, a 34% decline from 2000, with earnings per share of $3.19, down 33%. Despite the difficult market environment, Morgan Stanley achieved a strong 19% return on equity through expense control and business diversification. The report discusses Morgan Stanley's financial results, the challenges of the difficult market in 2001, and its continued focus on reorganizing around serving clients.
- Weyco Group reported a 4% decrease in first quarter sales from $61.3 million to $58.9 million and a decline in net earnings from $5.1 million to $2.5 million. Diluted earnings per share fell from $0.43 to $0.22.
- Sales were down in the wholesale and retail divisions due to lower demand and 3 fewer retail stores. The acquisition of Florsheim Australia contributed to increased foreign sales.
- Operating earnings declined from $7.6 million to $3.3 million due to lower sales volumes and margins in a difficult retail environment. Florsheim Australia had an operating loss of $360,000 from acquisition costs.
The document is the consolidated financial statements of The TJX Companies, Inc. for fiscal years 1998, 1997 and 1996. It shows that the company's net sales increased from $3.975 billion in 1996 to $6.689 billion in 1997 and $7.389 billion in 1998. Net income also increased each year, from $26.261 million in 1996 to $363.123 million in 1997 and $304.815 million in 1998. The majority of the company's sales and assets are from its off-price family apparel stores segment.
Hittite Microwave Corporation reported financial results for the first quarter of 2009 with revenue of $38.2 million, a decrease of 11.8% from the first quarter of 2008. Net income was $10.2 million, a decrease of 22% from the first quarter of 2008. Six of the company's eight markets experienced sequential declines in demand. The company expects revenue for the second quarter of 2009 to be between $38.5-39.5 million with net income of $9.5-10.5 million.
Allstate's revenues increased 4% to $27 billion in 1999. Operating income decreased 19% to $2.1 billion due to higher costs and charges from acquisitions and restructuring. Net income fell 17% to $2.7 billion. Investments grew 5% to $69.6 billion. In Property-Liability, premiums written rose 5% to $20.4 billion and underwriting income decreased 60% to $527 million due to increased losses and expenses.
- PPG Industries reported net sales of $2.87 billion for the quarter and $11.2 billion for the year, up compared to the same periods in 2006. Net income was $200 million for the quarter and $834 million for the year.
- By business segment, Performance Coatings and Industrial Coatings experienced the largest sales increases both for the quarter and full year.
- Total current assets at the end of 2007 were $7.14 billion, up from $4.86 billion at the end of 2006, mainly due to increases in cash, short-term investments, and receivables.
Omnicom reported record revenues and net income in 1997. Key highlights included:
- Worldwide billings increased 17% to $21.9 billion.
- Net income increased 26% to $222.4 million.
- Omnicom led its industry in total shareholder return over the previous five years.
- The company's major advertising networks - BBDO, DDB Needham, and TBWA - all achieved strong growth and recognition for creative excellence.
This document provides financial information for Unédic, France's unemployment insurance program, for the year 2009. It includes consolidated balance sheets, profit and loss statements, and cash flow statements. It also provides summaries of key events in 2009, including the start of Pôle Emploi, the new public employment service, and the reorganization of the unemployment insurance scheme following this change. Unédic issued new bonds worth €4 billion and commercial paper worth up to €6 billion to help finance unemployment benefits and operations.
Resumo da apostila da Outliers Professional Language School com Relatórios Contábeis em Inglês, parte resumida do Curso Relatórios Contábeis em Inglês Online: http://online.outliers.com.br/relatorios-contabeis-em-ingles
Conheça o nosso curso de Inglês para Contadores! Amplie seu vocabulário técnico de contabilidade em inglês:
http://online.outliers.com.br/relatorios-contabeis-em-ingles
Este assunto te interessa, conheça os cursos de inglês profissional da Outliers:
http://outliers.com.br
The document provides an interim financial and operational report for Rank Group. Key points include:
- Revenue and profits declined in the first half of 2008 compared to 2007 due to regulatory changes impacting the gaming industry. However, results improved compared to the second half of 2007.
- Bingo revenues declined due to lower admissions and spend per customer at Mecca Bingo. Casino revenues also fell.
- The company aims to stabilize revenue, reduce costs, grow customer visits through improved products, services and distribution, and expand selectively.
- Challenging market conditions and a cautious outlook for consumers are expected in the short-term, but gaming is seen as shifting increasingly into mainstream leisure over the medium-
- The Progressive Corporation reported financial results for January 2004, including a 16% increase in net premiums written, a 21% increase in net premiums earned, and a 47% increase in net income compared to January 2003.
- Progressive saw growth in both its Personal Lines and Commercial Auto businesses, with personal auto policies in force up 18% and commercial auto policies up 26% compared to the previous year.
- The company had favorable loss development and a combined ratio of 83.0%, contributing to strong profitability in the month.
- Bank of America reported third quarter 2006 results with total revenue of $18.961 billion, an 11% increase from third quarter 2005, and net income of $5.416 billion, a 20% increase.
- Net interest income was $8.894 billion, a 1% increase, impacted by the sale of Brazilian operations and prior year FAS 133 impact. Noninterest income increased 20% to $10.067 billion.
- Global Consumer & Small Business Banking reported net income of $2.889 billion, a 13% increase, driven by increases in cards, deposits, and debit purchase volume.
1) UAL Corporation reported significant losses in 2001 due to the impacts of September 11th terrorist attacks and the weak economy. UAL's losses totaled $2.1 billion for the year, with passenger revenues down 39% in the fourth quarter.
2) United Airlines operates a major domestic and international air transportation network, with hubs in Chicago, Denver, Los Angeles, San Francisco, and Washington D.C. It focuses on markets in North America, Pacific, Atlantic, and Latin America.
3) In response to the difficult financial conditions following 9/11, United undertook large schedule reductions and employee furloughs to reduce costs, while continuing efforts to strengthen revenues and customer service.
Comair reported a 3% increase in attributable profit to R33 million for the first half of the fiscal year, with earnings per share rising to 8.1 cents. Revenue declined due to lower ticket prices from decreased fuel costs, though passenger volumes held steady. The company maintained a strong cash position of R253 million and continued investing in its affiliated businesses. Looking ahead, Comair expects demand to follow signs of economic recovery overseas and recently ordered new aircraft to improve efficiency.
Eaton Corporation's 2001 annual report outlines the company's performance in a difficult year, with declining markets and a weakening global economy impacted further by the events of September 11th. Despite challenges, Eaton was able to outgrow its end markets, resize operations to compete at lower activity levels, strengthen its balance sheet by repaying over $560 million in debt, and end the year with a 16.9% stock return. The report emphasizes how Eaton has transformed its business model and integrated operations to better position the company for future growth opportunities.
Eaton Corporation is a global $7.3 billion diversified industrial manufacturer focused on fluid power systems, electrical power distribution and control, automotive engine air management, and intelligent truck systems. In 2001, Eaton faced challenges from a weak global economy and declining end markets, but took actions to resize operations, repay debt, and position itself for future growth when markets recover. The annual report discusses Eaton's financial performance in 2001, leadership response to challenges, and strategies for integrating operations to leverage its scale and diversity.
The document provides financial statements for MCB Bank Limited for the year ended December 31, 2009. It includes the balance sheet, profit and loss account, cash flow statement, statement of changes in equity, and statement of comprehensive income, along with accompanying notes. The balance sheet shows total assets of Rs. 509.2 billion and total liabilities of Rs. 439.5 billion. The profit and loss account reports a net profit after tax of Rs. 15.5 billion for 2009.
The consolidated statement of source and application of funds summarizes the flows of funds for Credit Suisse Group for 1999 and 1998. In 1999, funds from operations totaled CHF 12.7 billion, while equity transactions provided CHF 787 million. Investments in long-term assets required CHF 4.1 billion. Overall, there was a net inflow of funds from operations, equity transactions, and investments of CHF 8.4 billion.
The TJX Companies reported fiscal year 1999 results with the following highlights:
- Net sales increased to $7.9 billion, up 8% from the previous year. Net income increased to $424 million.
- The off-price family apparel stores segment achieved operating income of $783 million, up 32% from the prior year, and accounted for over 98% of total sales.
- The off-price home fashion stores segment had an operating loss of $5 million compared to an $9 million loss in the previous year.
- Identifiable assets for the off-price family apparel stores totaled $2.1 billion, representing over 75% of consolidated assets. Capital expenditures
This document is United Airlines' 1998 annual report. It contains the following key information:
1) Jerry Greenwald, United's CEO, provides a letter addressing the challenges of 1998, including economic problems in Asia hurting revenues. However, United still had healthy profits of $1.3 billion due to preparedness and cost controls.
2) Greenwald discusses United's progress on its "Quality Flight Plan" over the past 5 years to improve customer satisfaction, fleet, financial position, and employee relations.
3) The report includes financial highlights and operating statistics showing United's continued strong financial performance in 1998 despite challenges, as well as comments from passengers in seat 14D addressing improvements to United's fleet and customer experience
The document summarizes Henkel's financial results for the second quarter and first half of 2004 compared to the same periods in 2003. Net sales increased 9% in the second quarter and 6% year-to-date. Earnings from continuing operations rose 26% in the second quarter and 9% year-to-date due to growth across all business segments. Discontinued operations generated a large gain of $550 million from the exchange of businesses and increased earnings from discontinued operations significantly for both periods. As a result, net earnings increased substantially.
This 11-year financial summary provides key financial metrics for Walmart from 1991-2001. Some key points:
- Net sales increased each year, growing 16% in 2001 to $191 billion, driven by domestic and international expansion as well as a 5% increase in comparable store sales.
- Operating expenses increased slightly as a percentage of sales in 2001 due to higher maintenance, repair and depreciation costs. Gross margins remained relatively steady.
- Interest costs increased in 2001 and 2000 due to higher debt levels resulting from the acquisition of ASDA in 2000.
- Net income grew 16% in 2001 to $6.3 billion, with basic earnings per share reaching $1.41.
This 11-year financial summary provides key financial metrics for Walmart from 1999-2000. Net sales increased 20% in 2000 to $165 billion driven by expansion and an 8% increase in comparable store sales. Gross margins improved slightly in both 2000 and 1999 despite price rollbacks. Operating expenses increased slightly as a percentage of sales in 2000 due to increased payroll costs and a legal settlement. Segment sales growth was highest for the international segment, while SAM's Club sales declined as a percentage of total sales.
1. The document is State Street Corporation's 2002 Financial Review, which includes selected financial data from 1998-2002, management's discussion and analysis of financial results, and audited consolidated financial statements.
2. Key financial highlights from the selected data include total fee revenue increasing to $2.85 billion in 2002 from $2.01 billion in 1998, and net income increasing to $1.015 billion in 2002 from $436 million in 1998, with basic earnings per share reaching $3.14 in 2002.
3. The financial review provides operating results supplemental to the GAAP consolidated financial statements to allow for comparison of ongoing business activities and trends across periods.
Motorola reported financial results for Q1 2007, with net sales of $9.4 billion, down slightly from $9.6 billion in Q1 2006. Gross margin declined to $2.5 billion from $2.9 billion. The company had an operating loss of $366 million compared to operating earnings of $849 million in the prior year. On a segment basis, Mobile Devices sales fell 15% while Networks and Enterprise rose 20% and Connected Home Solutions increased 42%. Mobile Devices had an operating loss of $260 million versus earnings of $702 million in 2006.
- Motorola reported net earnings of $692 million for the quarter ended April 2, 2005, up from $609 million in the previous year. Net sales increased 10% to $8.161 billion.
- Gross margin was $2.67 billion compared to $2.366 billion in 2004. Operating earnings increased to $865 million from $685 million the previous year.
- The Mobile Devices segment saw a 6% increase in net sales and operating earnings of $440 million compared to $406 million in 2004.
Motorola's net sales increased 23% to $10.01 billion in the first quarter of 2006 compared to $8.16 billion in the same period in 2005. Gross margin improved to $3.02 billion in 2006 from $2.66 billion previously. Overall earnings from continuing operations were $686 million in 2006, nearly flat compared to $692 million in 2005. Mobile Devices segment sales grew 45% and operating earnings increased 60% year-over-year.
Big Lots reported financial results for fiscal year 2007 with net sales decreasing 1.8% to $4.656 billion. Income from continuing operations increased 28.8% to $145.08 million while earnings per share increased 39.6% to $1.41. Inventory turnover improved to 3.5 times from 3.4 times in 2006. Cash flow decreased to $249.17 million from $351.06 million in 2006 due to lower operating cash flow and higher capital expenditures.
- El Paso Corporation reported operating revenues of $1.598 billion and net income of $445 million for the third quarter of 2008.
- The Pipelines segment earned $278 million in earnings before interest and taxes, with throughput volumes averaging 4.605 trillion British thermal units per day on the Tennessee Gas Pipeline and 4.649 trillion British thermal units per day on the El Paso Natural Gas Pipeline.
- The Exploration and Production segment earned $528 million in operating income on average daily production volumes of 881 million cubic feet equivalent per day.
- El Paso Corporation reported financial results for the third quarter of 2008 with consolidated net income of $445 million compared to $155 million in the third quarter of 2007.
- The Pipelines segment saw earnings before interest and taxes of $278 million in the third quarter of 2008 compared to $275 million in the third quarter of 2007, while throughput increased.
- Exploration and Production saw earnings before interest and taxes increase to $528 million in the third quarter of 2008 from $228 million in the third quarter of 2007, with production volumes and realized prices increasing.
- Overall, the company reported higher earnings across most business segments in the third quarter of 2008 compared to the same period in 2007.
emerson electricl Proxy Statement for 2009 Annual Shareholders Meeting finance12
This document appears to be the consolidated financial statements of Emerson Electric Co. for the years 2006-2008. The summary provides:
1) Net sales and earnings from continuing operations increased each year from 2006 to 2008. Net earnings also increased each year.
2) Basic and diluted earnings per share from continuing operations and net earnings increased from 2006 to 2008, except for a small decrease in diluted earnings per share from 2007 to 2008.
3) Total assets increased from $19.68 billion in 2007 to $21.04 billion in 2008, with increases in current assets, property/equipment, and other assets.
Expeditors International of Washington, 4th98qerfinance39
Expeditors International of Washington reported financial results for the fourth quarter and full year of 1998. For the fourth quarter, net earnings increased 8% to $13.9 million and diluted EPS rose 10% to $0.53. For the full year, net earnings grew 23% to $47.3 million and diluted EPS increased 22% to $1.78. The company saw increases in revenues, operating income, and same store growth for both the quarter and full year. Chairman and CEO Peter Rose commented that 1998 was challenging but the company delivered solid results through its global network and core values.
In 2011, Intel's net revenue increased to $53.99 billion, gross margin was $33.76 billion, and net income was $12.94 billion. Research and development expenses increased to $8.35 billion. Total assets increased to $71.12 billion as of December 31, 2011. Intel acquired McAfee and Infineon's wireless business in 2011.
Nordnet reported increased operating income and profit after tax for 2010 compared to 2009. However, earnings per share were down slightly. For 2011, Nordnet plans cost reductions of 15% to secure goals and visions in light of decreased market activity. Measures include reducing consultants, marketing investments, and potentially reducing staff. Nordnet also reported highlights for 2010 such as successful integrations and new products, and goals to double revenues by 2013 while maintaining operating margins.
Ecolab is a leading global provider of cleaning, sanitizing, pest elimination, maintenance and repair products and services. It operates in over 40 countries directly and serves customers in over 100 countries total. Ecolab's common stock is publicly traded on the NYSE and Pacific Exchange. The document provides an overview of Ecolab's business descriptions, financial highlights for 2000-1999 including net sales, income from continuing operations, diluted income per share, and dividends declared per share. It also includes graphs showing trends in these financial metrics from 1996-2000.
The document presents consolidated balance sheet and financial statement information for Anheuser-Busch Companies for the years ended December 31, 2006 and 2005. It shows that the company had total assets of $16.4 billion in 2006 and $16.6 billion in 2005, with current assets of $1.8 billion in 2006 and $1.8 billion in 2005. It also shows that the company had total shareholders' equity of $3.9 billion in 2006 and $3.7 billion in 2005, and net income of $2.0 billion in 2006 and $1.7 billion in 2005.
- Edison Spa reported a net loss of €86 million for 2010 compared to a net profit of €423 million in 2009. Revenues increased to nearly €6 billion in 2010 from €5.2 billion in 2009.
- Total assets decreased slightly to €13.2 billion at the end of 2010 from €13.3 billion at the end of 2009. Current assets decreased to €4.2 billion from €4.4 billion.
- Total liabilities decreased to €3.6 billion from €3.7 billion. Current liabilities increased to €2.6 billion from €2.3 billion, driven by increases in short-term financial debt and bonds.
Fluor Corporation reported financial results for 2003 with revenues of $8.8 billion, earnings from continuing operations of $179 million, and net earnings of $157 million. Key highlights included a 6% increase in earnings from continuing operations compared to 2002. New awards in 2003 totaled nearly $10 billion and backlog remained strong at over $10 billion. The document also discussed Fluor's shift away from power projects as that market declined, with the dissolution of its Duke/Fluor Daniel joint venture in power announced in July 2003.
Allstate operates a Property-Liability business and a Allstate Financial business. The Property-Liability business saw a decrease in operating income to $1.05 billion due to higher claims expenses, lower investment income, and higher restructuring costs, partially offset by higher premiums and lower catastrophe losses. Net income for Allstate's overall business declined to $1.16 billion due to realized capital losses compared to gains the previous year and the decrease in operating income. Revenues declined slightly to $28.87 billion due to realized capital losses, though this was offset by increased premiums and investment income.
JPMorgan Chase Financial highlights and trendsfinance2
JPMorgan Chase reported total net revenue of $71.4 billion for 2007, an increase of 15% from 2006. Net income was $15.4 billion, up 6% from the previous year. Earnings per share increased from $3.93 to $4.51. Total assets grew 15% to $1.6 trillion over the period.
The document provides operating statistics and financial results for El Paso Corporation for the fourth quarter and full year of 2007. Key highlights include:
- Consolidated net income for Q4 2007 was $160 million compared to a net loss of $166 million in Q4 2006. For the full year, net income was $1.11 billion compared to $475 million in 2006.
- The Pipelines segment saw earnings before interest and taxes of $277 million in Q4 2007, up from $270 million in Q4 2006. For the full year, earnings were $1.11 billion, up from $1.06 billion in 2006.
- Exploration and Production earnings before interest and taxes were $252
This document provides financial and operational results for AT&T's wireless segment. Some key highlights include:
- Wireless operating revenues for 2008 were $49.3 billion, up 15.6% from 2007. Segment income was $10.8 billion for 2008, up 58.5% from 2007.
- As of December 31, 2008, AT&T had 77 million wireless customers, up 10.4% from a year earlier. Postpaid subscribers totaled 60.1 million in Q4 2008.
- Wireless data revenues in Q4 2008 were $3.1 billion, up 51.7% year-over-year, reflecting increased data usage and adoption of smartphones.
AT&T reported strong first quarter 2008 results with consolidated revenue growth of 4.6% year-over-year, led by improved results in wireless and enterprise services. Wireless revenues increased 18.3% due to strong subscriber gains and growth in wireless data services, and AT&T added 1.3 million wireless subscribers. Enterprise revenues grew led by a 22.9% increase in IP-based data services. Adjusted earnings per share grew 13.8% over the first quarter of 2007, highlighting AT&T's 12th consecutive quarter of double-digit earnings growth.
AT&T reported solid second quarter results in 2008, with key highlights including:
- Wireless revenues grew 15.8% driven by subscriber gains and 52% growth in wireless data services. Total wireless subscribers increased by over 1.3 million.
- Wholesale customer revenue declines improved, with revenues down just 0.2% versus a year ago.
- EPS was $0.63, up from $0.47 a year ago, while adjusted EPS was $0.76, up from $0.70 a year ago.
AT&T reported strong third quarter results in 2008, highlighted by growth in wireless subscribers and revenues. They gained 2 million new wireless subscribers total, with a record 1.7 million postpaid additions. This growth was powered by 2.4 million activations of the new iPhone 3G and rapid adoption of wireless data services. AT&T also grew its U-verse TV subscriber base to 781,000 and saw stable trends in business services. However, earnings were reduced by costs associated with the iPhone launch and hurricane-related expenses.
AT&T reported fourth quarter and full year 2008 results, highlighting strong wireless subscriber gains, accelerated growth of U-verse TV subscribers passing 1 million, and continued double-digit growth in IP data services. Wireless revenues grew 13.2% in Q4 2008 led by a 51.2% increase in wireless data revenues. AT&T added 2.1 million wireless subscribers in Q4 2008 and accelerated its U-verse TV ramp with 264,000 new subscribers. For the full year 2008, AT&T reported revenues of $124 billion, net income of $12.9 billion, and earnings per share increased 11.3% over 2007.
This document provides financial and operational results for AT&T across several business segments. Key highlights include:
- Wireless operating revenues increased 6% to $49.3 billion in 2008, with segment income increasing 58% to $10.8 billion. The number of wireless customers grew 5% to over 77 million.
- Wireline operating revenues declined 2% to $69.9 billion while segment income declined 7% to $11.2 billion in 2008 compared to 2007.
- Advertising & Publishing operating revenues declined 6% to $5.5 billion in 2008, with segment income declining 20% to $1.7 billion.
This document is a notice and proxy statement for the 2000 Annual Meeting of Share Owners of General Electric Company. It provides information on items to be voted on at the meeting, including the election of 16 directors, appointment of independent auditors, a proposal to increase authorized shares for a 3-for-1 stock split, and 11 shareholder proposals. Brief biographies of the 16 nominees for director positions are also included.
This document is a notice and proxy statement for General Electric Company's 2001 Annual Meeting. It provides information on the date, time, and location of the meeting, as well as details on voting procedures. Shareholders will vote on electing directors, appointing independent auditors, and seven shareholder proposals relating to issues such as cumulative voting, workplace codes of conduct, and nuclear power reporting. Biographies of the 19 nominees for director positions are also included.
The document is a notice and proxy statement for General Electric's 2002 Annual Meeting. It provides details about the meeting such as the date, time, and location in Waukesha, Wisconsin. It also lists the items to be voted on including the election of directors, appointment of auditors, executive compensation plans, and eight shareholder proposals. Biographies are provided for the 16 nominees up for election to the board of directors.
The document is a notice and proxy statement for General Electric's 2003 annual shareholder meeting. It provides details on the meeting such as date, time, location, and items to be voted on including election of directors and appointment of auditors. It also includes biographies of the 17 nominees for election to the board of directors.
The document is a notice and proxy statement for General Electric's 2004 Annual Meeting. It notifies shareholders that the meeting will be held on April 28, 2004 in Louisville, Kentucky at 10:00am to vote on the election of directors, ratification of the independent auditor selection, adding a revenue measurement to executive performance goals, and 15 shareholder proposals. Shareholders of record as of March 1, 2004 are entitled to vote.
The document is a notice and proxy statement for General Electric's 2005 Annual Meeting. It provides information on the date, time, and location of the meeting in Cincinnati, Ohio. It lists 15 nominees for election to the board of directors and provides brief biographies for each nominee. It also lists several matters that will be voted on at the meeting, including the election of directors, ratification of the independent auditor, and seven shareholder proposals.
The document is a notice and proxy statement for General Electric's 2006 Annual Meeting. It provides details on the meeting such as the date, time, and location in Philadelphia. It lists 15 nominees for election to the board of directors and provides brief biographies for each. It also lists several matters that will be voted on including the election of directors, ratification of the independent auditor, and six shareholder proposals.
This document provides preliminary financial highlights and operating metrics for ConocoPhillips for the first quarter of 2004 compared to the first quarter of 2003. Some key figures include:
- Total revenues of $30.2 billion for the first quarter of 2004, up from $27.1 billion in the same period of 2003.
- Net income of $1.6 billion for the first quarter of 2004, up from $1.2 billion in the first quarter of 2003.
- Oil and gas production of 941 thousand barrels per day for the first quarter of 2004, up slightly from 935 thousand barrels per day in the same period of 2003.
ConocoPhillips reported financial highlights for the second quarter of 2004 including revenues of $31.9 billion and net income of $2.1 billion. Earnings per share were $3.01 for the quarter. The company experienced higher crude oil and natural gas sales prices and volumes compared to the prior year. However, costs and expenses also increased, including purchases of crude oil and products, production and operating expenses, and taxes.
- ConocoPhillips reported revenues of $34.7 billion for Q3 2004, up from $26.5 billion in Q3 2003, and net income of $2 billion, up from $1.3 billion.
- Earnings per share for Q3 2004 were $2.86, up from $1.90 in Q3 2003.
- Oil and gas production volumes were up slightly from Q3 2003, with crude oil production of 733 thousand barrels per day consolidated and 844 thousand barrels per day total.
- ConocoPhillips reported significantly higher revenues and net income for both the fourth quarter and full year 2004 compared to the same periods in 2003, driven by higher oil and gas prices and increased production volumes.
- Revenues for the fourth quarter of 2004 were $40.1 billion, up 54% from $26 billion in the fourth quarter of 2003. Net income for the fourth quarter was $2.4 billion, up 138% from $1 billion.
- For the full year 2004, revenues were $136.9 billion compared to $105.1 billion in 2003. Net income was $8.1 billion compared to $4.7 billion in 2003.
This document provides financial highlights and selected financial data for ConocoPhillips for the first quarter of 2005 compared to the first quarter of 2004. Some key figures include:
- Net income for Q1 2005 was $2.912 billion compared to $1.616 billion in Q1 2004.
- Income from continuing operations was $2.923 billion in Q1 2005 compared to $1.603 billion in Q1 2004.
- Total worldwide crude oil and natural gas production was 942 thousand barrels of oil equivalent per day in Q1 2005.
- Total revenues for Q1 2005 were $38.918 billion compared to $30.217 billion in Q1 2004.
ConocoPhillips reported financial results for the third quarter and first nine months of 2005:
- Revenues for the quarter increased to $49.7 billion, up from $34.7 billion in the same period last year, driven by higher oil and gas prices. Net income was $3.8 billion compared to $2 billion last year.
- For the first nine months of the year, revenues were $131.2 billion compared to $96.8 billion last year. Net income was $9.85 billion compared to $5.7 billion in the same period of 2004.
- Oil and gas production for the quarter averaged 790 thousand barrels of oil equivalent per day for
This document provides financial highlights and selected financial data for ConocoPhillips for the three month and twelve month periods ending December 31, 2005 and 2004. Some key details include:
- Revenues for the three months ending December 31, 2005 were $52.2 billion compared to $40.1 billion for the same period in 2004.
- Net income for the twelve months ending December 31, 2005 was $13.5 billion compared to $8.1 billion for the same period in 2004.
- Earnings per share (diluted) for continuing operations for the twelve months ending December 31, 2005 were $9.63 compared to $5.79 for the same period in 2004.
Fabular Frames and the Four Ratio ProblemMajid Iqbal
Digital, interactive art showing the struggle of a society in providing for its present population while also saving planetary resources for future generations. Spread across several frames, the art is actually the rendering of real and speculative data. The stereographic projections change shape in response to prompts and provocations. Visitors interact with the model through speculative statements about how to increase savings across communities, regions, ecosystems and environments. Their fabulations combined with random noise, i.e. factors beyond control, have a dramatic effect on the societal transition. Things get better. Things get worse. The aim is to give visitors a new grasp and feel of the ongoing struggles in democracies around the world.
Stunning art in the small multiples format brings out the spatiotemporal nature of societal transitions, against backdrop issues such as energy, housing, waste, farmland and forest. In each frame we see hopeful and frightful interplays between spending and saving. Problems emerge when one of the two parts of the existential anaglyph rapidly shrinks like Arctic ice, as factors cross thresholds. Ecological wealth and intergenerational equity areFour at stake. Not enough spending could mean economic stress, social unrest and political conflict. Not enough saving and there will be climate breakdown and ‘bankruptcy’. So where does speculative design start and the gambling and betting end? Behind each fabular frame is a four ratio problem. Each ratio reflects the level of sacrifice and self-restraint a society is willing to accept, against promises of prosperity and freedom. Some values seem to stabilise a frame while others cause collapse. Get the ratios right and we can have it all. Get them wrong and things get more desperate.
OJP data from firms like Vicinity Jobs have emerged as a complement to traditional sources of labour demand data, such as the Job Vacancy and Wages Survey (JVWS). Ibrahim Abuallail, PhD Candidate, University of Ottawa, presented research relating to bias in OJPs and a proposed approach to effectively adjust OJP data to complement existing official data (such as from the JVWS) and improve the measurement of labour demand.
Discover the Future of Dogecoin with Our Comprehensive Guidance36 Crypto
Learn in-depth about Dogecoin's trajectory and stay informed with 36crypto's essential and up-to-date information about the crypto space.
Our presentation delves into Dogecoin's potential future, exploring whether it's destined to skyrocket to the moon or face a downward spiral. In addition, it highlights invaluable insights. Don't miss out on this opportunity to enhance your crypto understanding!
https://36crypto.com/the-future-of-dogecoin-how-high-can-this-cryptocurrency-reach/
The Universal Account Number (UAN) by EPFO centralizes multiple PF accounts, simplifying management for Indian employees. It streamlines PF transfers, withdrawals, and KYC updates, providing transparency and reducing employer dependency. Despite challenges like digital literacy and internet access, UAN is vital for financial empowerment and efficient provident fund management in today's digital age.
Optimizing Net Interest Margin (NIM) in the Financial Sector (With Examples).pdfshruti1menon2
NIM is calculated as the difference between interest income earned and interest expenses paid, divided by interest-earning assets.
Importance: NIM serves as a critical measure of a financial institution's profitability and operational efficiency. It reflects how effectively the institution is utilizing its interest-earning assets to generate income while managing interest costs.
Falcon stands out as a top-tier P2P Invoice Discounting platform in India, bridging esteemed blue-chip companies and eager investors. Our goal is to transform the investment landscape in India by establishing a comprehensive destination for borrowers and investors with diverse profiles and needs, all while minimizing risk. What sets Falcon apart is the elimination of intermediaries such as commercial banks and depository institutions, allowing investors to enjoy higher yields.
Solution Manual For Financial Accounting, 8th Canadian Edition 2024, by Libby...Donc Test
Solution Manual For Financial Accounting, 8th Canadian Edition 2024, by Libby, Hodge, Verified Chapters 1 - 13, Complete Newest Version Solution Manual For Financial Accounting, 8th Canadian Edition by Libby, Hodge, Verified Chapters 1 - 13, Complete Newest Version Solution Manual For Financial Accounting 8th Canadian Edition Pdf Chapters Download Stuvia Solution Manual For Financial Accounting 8th Canadian Edition Ebook Download Stuvia Solution Manual For Financial Accounting 8th Canadian Edition Pdf Solution Manual For Financial Accounting 8th Canadian Edition Pdf Download Stuvia Financial Accounting 8th Canadian Edition Pdf Chapters Download Stuvia Financial Accounting 8th Canadian Edition Ebook Download Stuvia Financial Accounting 8th Canadian Edition Pdf Financial Accounting 8th Canadian Edition Pdf Download Stuvia
In a tight labour market, job-seekers gain bargaining power and leverage it into greater job quality—at least, that’s the conventional wisdom.
Michael, LMIC Economist, presented findings that reveal a weakened relationship between labour market tightness and job quality indicators following the pandemic. Labour market tightness coincided with growth in real wages for only a portion of workers: those in low-wage jobs requiring little education. Several factors—including labour market composition, worker and employer behaviour, and labour market practices—have contributed to the absence of worker benefits. These will be investigated further in future work.
Economic Risk Factor Update: June 2024 [SlideShare]Commonwealth
May’s reports showed signs of continued economic growth, said Sam Millette, director, fixed income, in his latest Economic Risk Factor Update.
For more market updates, subscribe to The Independent Market Observer at https://blog.commonwealth.com/independent-market-observer.
Enhancing Asset Quality: Strategies for Financial Institutionsshruti1menon2
Ensuring robust asset quality is not just a mere aspect but a critical cornerstone for the stability and success of financial institutions worldwide. It serves as the bedrock upon which profitability is built and investor confidence is sustained. Therefore, in this presentation, we delve into a comprehensive exploration of strategies that can aid financial institutions in achieving and maintaining superior asset quality.
2. 11-Year Financial Summary
(Dollar amounts in millions except per share data) 2002 2001 2000
Net sales $ 217,799 $ 191,329 $ 165,013
Net sales increase 14% 16% 20%
Domestic comparative store sales increase 6% 5% 8%
Other income-net 2,013 1,966 1,796
Cost of sales 171,562 150,255 129,664
Operating, selling and general and administrative expenses 36,173 31,550 27,040
Interest costs:
Debt 1,052 1,095 756
Capital leases 274 279 266
Provision for income taxes 3,897 3,692 3,338
Minority interest and equity in unconsolidated subsidiaries (183) (129) (170)
Cumulative effect of accounting change, net of tax – – (198)
Net income 6,671 6,295 5,377
Per share of common stock:
Basic net income 1.49 1.41 1.21
Diluted net income 1.49 1.40 1.20
Dividends 0.28 0.24 0.20
Financial Position
Current assets $ 28,246 $ 26,555 $ 24,356
Inventories at replacement cost 22,749 21,644 20,171
Less LIFO reserve 135 202 378
Inventories at LIFO cost 22,614 21,442 19,793
Net property, plant and equipment and capital leases 45,750 40,934 35,969
Total assets 83,451 78,130 70,349
Current liabilities 27,282 28,949 25,803
Long-term debt 15,687 12,501 13,672
Long-term obligations under capital leases 3,045 3,154 3,002
Shareholders’ equity 35,102 31,343 25,834
Financial Ratios
Current ratio 1.0 0.9 0.9
Inventories/working capital 23.5 (9.0) (13.7)
Return on assets* 8.5% 8.7% 9.5%***
Return on shareholders’ equity** 20.1% 22.0% 22.9%
Other Year-End Data
Number of U.S. Wal-Mart stores 1,647 1,736 1,801
Number of U.S. Supercenters 1,066 888 721
Number of U.S. SAM’S CLUBS 500 475 463
Number of U.S. Neighborhood Markets 31 19 7
International units 1,170 1,071 1,004
Number of Associates 1,383,000 1,244,000 1,140,000
Number of Shareholders of record (as of March 31) 324,000 317,000 307,000
* Net income before minority interest, equity in unconsolidated subsidiaries and cumulative effect of accounting
change/average assets
** Net income/average shareholders’ equity
*** Calculated giving effect to the amount by which a lawsuit settlement exceeded established reserves. If this settlement were not
considered, the return would have been 9.8%.
14
3. 1999 1998 1997 1996 1995 1994 1993 1992
$ 137,634 $ 117,958 $ 104,859 $ 93,627 $ 82,494 $ 67,344 $ 55,484 $ 43,887
17% 12% 12% 13% 22% 21% 26% 35%
9% 6% 5% 4% 7% 6% 11% 10%
1,574 1,341 1,319 1,146 914 645 497 404
108,725 93,438 83,510 74,505 65,586 53,444 44,175 34,786
22,363 19,358 16,946 15,021 12,858 10,333 8,321 6,684
529 555 629 692 520 331 143 113
268 229 216 196 186 186 180 153
2,740 2,115 1,794 1,606 1,581 1,358 1,171 945
(153) (78) (27) (13) 4 (4) 4 (1)
– – – – – – – –
4,430 3,526 3,056 2,740 2,681 2,333 1,995 1,609
0.99 0.78 0.67 0.60 0.59 0.51 0.44 0.35
0.99 0.78 0.67 0.60 0.59 0.51 0.44 0.35
0.16 0.14 0.11 0.10 0.09 0.07 0.05 0.04
$ 21,132 $ 19,352 $ 17,993 $ 17,331 $ 15,338 $ 12,114 $ 10,198 $ 8,575
17,549 16,845 16,193 16,300 14,415 11,483 9,780 7,857
473 348 296 311 351 469 512 473
17,076 16,497 15,897 15,989 14,064 11,014 9,268 7,384
25,973 23,606 20,324 18,894 15,874 13,176 9,793 6,434
49,996 45,384 39,604 37,541 32,819 26,441 20,565 15,443
16,762 14,460 10,957 11,454 9,973 7,406 6,754 5,004
6,908 7,191 7,709 8,508 7,871 6,156 3,073 1,722
2,699 2,483 2,307 2,092 1,838 1,804 1,772 1,556
21,112 18,503 17,143 14,756 12,726 10,753 8,759 6,990
1.3 1.3 1.6 1.5 1.5 1.6 1.5 1.7
3.9 3.4 2.3 2.7 2.6 2.3 2.7 2.1
9.6% 8.5% 7.9% 7.8% 9.0% 9.9% 11.1% 12.0%
22.4% 19.8% 19.2% 19.9% 22.8% 23.9% 25.3% 26.0%
1,869 1,921 1,960 1,995 1,985 1,950 1,848 1,714
564 441 344 239 147 72 34 10
451 443 436 433 426 417 256 208
4 – – – – – – –
715 601 314 276 226 24 10 –
910,000 825,000 728,000 675,000 622,000 528,000 434,000 371,000
261,000 246,000 257,000 244,000 259,000 258,000 181,000 150,000
Years prior to 1998 have not been restated for the effects of the change in accounting method for SAM’S CLUB membership revenue
recognition as the effects of this change would not have a material impact on this summary. Therefore, pro forma information as if the
accounting change had been in effect for all years presented has not been provided.
The acquisition of the ASDA Group PLC and the Company’s related debt issuance had a significant impact on the fiscal 2000 amounts
in this summary. See Note 7 to the Consolidated Financial Statements.
15
4. Management’s Discussion and Analysis
Wal-Mart is a large but straightforward business. In the United States, our operations are centered around retail stores and membership warehouse clubs.
Internationally, our operations are centered on retail stores, warehouse clubs and restaurants. We have built our business by offering our customers
quality merchandise at low prices. We are able to lower the cost of merchandise through our negotiations with suppliers and by efficiently managing our
distribution network. The key to our success is our ability to grow our base business. In the U.S. we grow our base business by aggressively building new
stores and by increasing sales in our existing stores. Internationally, we grow our business by building new stores, increasing sales in our existing stores
and through acquisitions. We intend to continue to expand both domestically and internationally.
Because we are a large company, we do enter into some complex transactions. One complex area is our derivatives program. We do not use derivative
instruments for speculation or for the purpose of creating additional revenues; however, we do enter into derivative transactions to limit our exposure
to known business risks. Examples of these business risks include changes in interest rates and movements in foreign currency exchange rates. The
discussion of our derivative transactions has been given a great deal of space in the financial section of this Annual Report. The Market Risk section
of this Management’s Discussion and Analysis and Note 4 to the Consolidated Financial Statements give you more information on these transactions.
Please remember that the accounting and disclosure rules for derivative transactions are very specific and any discussion of them requires the use of
technical terminology.
Net Sales
The Company and each of its operating segments had net sales (in millions) for the three fiscal years ended January 31, 2002 as follows:
Fiscal Year Wal-Mart Stores SAM’S CLUB International Other Total Company Total Company Increase
from Prior Fiscal Year
2002 $ 139,131 $ 29,395 $ 35,485 $ 13,788 $ 217,799 14%
2001 121,889 26,798 32,100 10,542 191,329 16%
2000 108,721 24,801 22,728 8,763 165,013 20%
Our net sales grew by 14% in fiscal 2002 when compared with fiscal 2001. That increase resulted from our domestic and international expansion
programs, and a domestic comparative store sales increase of 6% when compared with fiscal 2001. The sales increase of 16% in fiscal 2001, when
compared with fiscal 2000, resulted from our domestic and international expansion programs, and a domestic comparative store sales increase of 5%.
The Wal-Mart Stores and SAM’S CLUB segments include domestic units only. Wal-Mart stores and SAM’S CLUBS located outside the United States
are included in the International segment.
Costs and Expenses
For fiscal 2002, our cost of sales increased as a percentage of total net sales when compared to fiscal 2001, resulting in an overall decrease of 0.24%
in the Company’s gross margin from 21.47% in the fiscal year 2001 to a gross margin of 21.23% in fiscal 2002. This decrease in gross margin
occurred primarily due to a shift in customer buying patterns to products that carry lower margins and an increase in food sales as a percent of our
total sales. Food products generally carry lower margins than general merchandise. Management expects our gross margins to continue to decrease as
food sales continue to increase as a percentage of total Company sales both domestically and internationally. Management also expects the Company’s
program to convert many of our Wal-Mart discount stores to Supercenters, which have full-line food departments, and the opening of additional
Neighborhood Markets to result in continuing increases in the percentage that food sales contribute to our total net sales. Partially offsetting the
overall decrease in gross margin in fiscal 2002, the Company reduced cost of sales by $67 million as a result of a LIFO inventory adjustment. A LIFO
inventory adjustment that reduces cost of sales indicates that the current economic environment is deflationary, meaning that on average, identical
products that we sold in both fiscal 2002 and 2001 decreased in price from fiscal 2001 to 2002. The balance in the LIFO reserve on the Company’s
balance sheet is attributable to food inventories and other inventories held by our subsidiary, McLane Company, Inc. Management believes that these
categories will not be disinflationary in the near future and that future gross margins may not benefit from a LIFO adjustment, such as that which
occurred in fiscal 2002.
Our total cost of sales as a percentage of our total net sales decreased for fiscal 2001 when compared to fiscal 2000, resulting in increases in gross margin
of 0.05% for fiscal 2001 to 21.47% from 21.42% in fiscal 2000. This improvement in gross margin resulted primarily from a $176 million LIFO
inventory adjustment that reduced our cost of sales. This LIFO adjustment was offset by continued price rollbacks and increased International sales
and increased food sales.
Our operating, selling, general and administrative expenses increased 0.12% as a percentage of total net sales to 16.61% in fiscal 2002 when compared
with fiscal 2001. This increase was primarily due to increased utility and insurance costs, including Associate medical, property and casualty insurance.
Management believes that the trend of increasing insurance costs will continue for at least the near future. Operating, selling, general and administrative
expenses increased 0.10% as a percentage of sales in fiscal 2001 when compared with fiscal 2000. This increase was primarily due to increased
maintenance and repair costs and depreciation charges incurred during the year.
Interest Costs
Our interest costs for corporate debt decreased 0.09% as a percentage of net sales from 0.57% in fiscal 2001 to 0.48% in fiscal 2002. This decrease
resulted from lower interest rates, less need for debt financing of the Company’s operations due to the Company’s inventory reduction efforts and
the positive impacts of the Company’s fixed rate to variable rate interest rate swap program. For fiscal 2002, total Company inventory increased
approximately 5% on a total Company sales increase of 14%. Interest costs increased 0.11% as a percentage of sales from 0.46% in fiscal 2000 to
0.57% in fiscal 2001. This increase resulted from additional debt issuances made to finance a part of the ASDA acquisition costs, but was somewhat
offset by reductions in debt resulting from the Company’s inventory control efforts. See the Market Risk section of this discussion for further detail
regarding the Company’s fixed to floating interest rate swaps.
16
5. Net Income
In fiscal 2002, we earned net income of $6,671 billion, a 6.0% increase over the aggregate net income of the Company in fiscal 2001. Our net income
did not grow in fiscal 2002 by the same percentage as our total net sales grew in fiscal 2002 largely as a result of the reduction in the overall gross
margin and increased costs and expenses of the Company in fiscal 2002 as discussed above. In fiscal 2001, we earned net income of $6,295 billion, a
17.1% increase over the Company’s net income in 2000. This increase resulted primarily from the growth in the Company’s total net sales and a slight
improvement in the Company’s overall gross margin.
During July 2001, we acquired the outstanding minority interest in Wal-Mart.com, Inc. from Accel Partners and a small group of other investors.
A reorganization resulting from the acquisition resulted in a charge against the earnings of the Company during fiscal 2002 of slightly less than
$0.01 per share.
Wal-Mart Stores Segment
Segment sales increase Segment operating Segment operating income Operating income as a
Fiscal year from prior fiscal year income (in billions) increase from prior year percentage of segment sales
2002 14.1% $ 10.3 6.0% 7.4%
2001 12.1% 9.7 11.5% 8.0%
2000 14.0% 8.7 20.2% 8.0%
The Wal-Mart Stores segment sales amounted to 63.9% of total Company sales in fiscal 2002, which compares to 63.7% and 65.9% in fiscal 2001 and
2000, respectively.
The segment sales increases in fiscal 2002 and fiscal 2001 from the prior fiscal years resulted from comparative store sales increases and our expansion
program in the Wal-Mart Stores segment. Segment expansion during fiscal 2002 included the opening of 33 Wal-Mart stores, 12 Neighborhood
Markets and 178 Supercenters (including the conversion of 121 existing Wal-Mart stores into Supercenters). Segment expansion during fiscal 2001
included the opening of 41 Wal-Mart stores, 12 Neighborhood Markets and 167 Supercenters (including the conversion of 104 existing Wal-Mart
stores into Supercenters).
A reduction in gross margin and an increase in operating expenses caused the decrease in segment operating income as a percent of segment sales in
fiscal 2002. The gross margin reduction was driven primarily by an increase in lower-margin food sales as a percentage of total segment sales, a change
in customer buying patterns to lower-margin merchandise and competitive pressures. Segment expenses in fiscal 2002 as a percent of sales were higher
than fiscal 2001 due primarily to increased Associate wages, utility, repairs and maintenance expenses and insurance costs. The increase in segment
operating income for fiscal 2001 was driven by margin improvements that resulted from decreased markdowns and improved inventory shrinkage
experience during the fiscal year. Offsetting these margin improvements were increased distribution costs, resulting from higher fuel, utility and
payroll charges and overall payroll costs that were higher as a percentage of fiscal 2001 sales which were adversely affected by a fiscal 2001 holiday
season with lower than anticipated sales. Operating income information for fiscal years 2000 and 2001 has been reclassified to conform to the current
year presentation.
SAM’S CLUB Segment
Segment sales increase Segment operating Segment operating income Operating income as a
Fiscal year from prior fiscal year income (in billions) increase from prior year percentage of segment sales
2002 9.7% $ 1,028 9.1% 3.5%
2001 8.1% 942 10.8% 3.5%
2000 8.4% 850 22.7% 3.4%
The SAM’S CLUB segment net sales amounted to 13.5% of total Company net sales in fiscal 2002, which compares to 14.0% and 15.0% in fiscal
2001 and 2000, respectively. The decrease in this segment’s sales as a percent of total Company sales in fiscal 2002 and 2001 when compared to fiscal
2000 resulted primarily from the increased International segment sales generated by our ASDA subsidiary that we acquired in the third quarter of fiscal
2000, as well as, for fiscal 2002, domestic growth in the Wal-Mart Stores segment.
Growth in net sales and operating income for the SAM’S CLUB segment in fiscal 2002 and fiscal 2001 resulted from comparative club sales increases
and our expansion program. Segment expansion during fiscal 2002 and 2001 consisted of the opening of 25 and 13 new clubs, respectively.
This segment gross margin increased slightly during fiscal 2002; however, an increase in operating expense as a percent of sales offset this margin
increase, leaving segment operating income as a percent of sales unchanged from fiscal 2001. The main expense pressures in fiscal 2002 in the SAM’S
CLUB segment occurred in the areas of utility and maintenance and repair costs. Operating income for the segment in fiscal 2001 increased slightly
due to margin improvements.
International Segment
Segment sales increase Segment operating Segment operating income Operating income as a
Fiscal year from prior fiscal year income (in billions) increase from prior year percentage of segment sales
2002 10.5% $ 1,458 31.1% 4.1%
2001 41.2% 1,112 36.1% 3.5%
2000 85.6% 817 48.8% 3.6%
Our International segment is comprised of wholly-owned operations in Argentina, Canada, Germany, South Korea, Puerto Rico and the United
Kingdom; operations through joint ventures in China; and operations through majority-owned subsidiaries in Brazil and Mexico. International sales
accounted for approximately 16.3% of total Company sales in fiscal 2002 compared with 16.8% in fiscal 2001 and 13.8% in fiscal 2000.
17
6. The fiscal 2002 increase in international sales and operating income primarily resulted from both improved operating results and our international
expansion program. In fiscal 2002, the International segment opened 107 units. Partially offsetting the impact of the expansion program, changes
in foreign currency exchange rates negatively affected the translation of International segment sales into U.S. dollars by an aggregate of $1.1 billion in
fiscal 2002. The largest portion of the increase in the International segment’s net sales in fiscal 2001 primarily resulted from the International segment’s
expansion that consisted of the opening of 77 units. Also affecting the comparison between fiscal 2002 and 2001 and fiscal 2000 was the acquisition of
the ASDA Group PLC, which consisted of 229 stores when its acquisition was completed during the third quarter of fiscal 2000. Sales included in the
Company’s consolidated income statement for ASDA during fiscal 2002, 2001 and 2000 were $15.3 billion, $14.5 billion and $7.2 billion, respectively.
The positive effects of the expansion program on the International segment’s net sales in fiscal 2001 were partially offset by changes in foreign currency
exchange rates which negatively affected the translation of International segment sales into U.S. dollars by $1.3 billion in fiscal 2001.
The fiscal 2002 increase in segment operating profit as a percentage of segment sales resulted from an improvement in gross margin and a reduction
in operating expenses as a percentage of segment sales in fiscal 2002. The decrease in the International segment’s operating income as a percentage
of segment sales in fiscal 2001 resulted primarily from the continued negative impact of store remodeling costs, costs related to the start-up of a new
distribution system, excess inventory and transition related expenses in the Company’s Germany units. Partially offsetting these negative effects were
operating profit increases in Mexico, Canada and the United Kingdom in fiscal 2001 compared with fiscal 2000.
Our financial results from our foreign operations could be affected by factors such as changes in foreign currency exchange rates or weak economic
conditions in the foreign markets in which the Company does business. The Company minimizes exposure to the risk of devaluation of foreign
currencies by operating in local currencies and through buying forward currency contracts, where feasible, for certain known funding requirements.
The economic environment in Argentina has deteriorated during the last fiscal year, including the devaluation of the Argentine peso. We will continue
to monitor the economic situation but do not believe the Company’s investment in operations in Argentina, which is not significant, has been impaired.
In fiscal 2002, the foreign currency translation adjustment changed from the fiscal 2001 level by $472 million to $2.2 billion in fiscal 2002 primarily
due to a strengthening in the United States dollar against the local currencies of the countries in which the company has operations with the exception
of Mexico where the peso strengthened against the dollar. In fiscal 2001, the foreign currency translation adjustment changed from the fiscal 2000 level
by $1.1 billion, primarily due to the dollar strengthening against the British pound and the German mark.
Other
Segment sales increase Segment operating Segment operating income Operating income as a
Fiscal year from prior fiscal year income (in billions) increase from prior year percentage of segment sales
2002 30.8% ($ 714) (147.9%) (5.2%)
2001 20.3% (288) (9.5%) (2.7%)
2000 23.2% (263) 37.2% (3.0%)
Sales in the Other category comprise sales to third parties by the Company’s wholly-owned subsidiary McLane Company, Inc., a wholesale distributor.
McLane offers a wide variety of grocery and non-grocery products, which it sells to a variety of retailers including the Company’s Wal-Mart Stores and
SAM’S CLUB segments. McLane’s sales to other Wal-Mart companies are not included in the total sales of the Company.
McLane net sales to unaffiliated purchasers account for approximately 6.3% of total Company sales in fiscal 2002 compared with 5.5% in fiscal 2001
and 5.3% in fiscal 2000. The increase in McLane sales is the result of its acquisition of AmeriServe Food Distribution, Inc. (AmeriServe), which was
completed late in fiscal 2001.
Losses for the segment in each of the fiscal years presented primarily resulted from corporate overhead expenses including insurance costs, corporate
bonuses and various other expenses, which are partially offset by McLane operating income and the favorable impact of the LIFO adjustment of
$67 and $176 million in fiscal 2002 and 2001, respectively. The segment operating loss increased from fiscal 2001 due to an increase in insurance costs,
bonuses and a reduction in the LIFO benefit in comparison to the prior year.
Summary of Significant Accounting Policies
Management strives to report the financial results of the Company in a clear and understandable manner, even though in some cases accounting
and disclosure rules are complex and require technical terminology. We follow generally accepted accounting principles in the U.S. in preparing our
consolidated financial statements, which require us to make certain estimates and apply judgements that affect our financial position and results of
operations. Management continually reviews its accounting policies, how they are applied and how they are reported and disclosed in the financial
statements. Following is a summary of our more significant accounting policies and how they are applied in preparation of the financial statements.
Inventories
We use the retail last-in, first-out (LIFO) inventory accounting method for the Wal-Mart Stores segment, cost LIFO for the SAM’S CLUB segment and
other cost methods, including the retail first-in, first-out (FIFO) and average cost methods, for the International segment. Inventories are not recorded
in excess of market value. Historically, we have rarely experienced significant occurrences of obsolescence or slow moving inventory. However, future
changes in circumstances, such as changes in customer merchandise preference or unseasonable weather patterns, could cause the Company’s inventory
to be exposed to obsolescence or slow moving merchandise.
Financial Instruments
We use derivative financial instruments for purposes other than trading to reduce our exposure to fluctuations in foreign currencies and to minimize
the risk and cost associated with financial and global operating activities. Generally, the contract terms of a hedge instrument closely mirror those of
the item being hedged providing a high degree of risk reduction and correlation. Contracts that are highly effective at meeting the risk reduction and
correlation criteria are recorded using hedge accounting. On February 1, 2001, we adopted Financial Accounting Standards Board (FASB) Statements
No. 133, 137 and 138 (collectively “SFAS 133”) pertaining to the accounting for derivatives and hedging activities. SFAS 133 requires all derivatives,
which are financial instruments used by the Company to protect (hedge) itself from certain risks, to be recorded on the balance sheet at fair value and
establishes accounting treatment for hedges. If a derivative instrument is a hedge, depending on the nature of the hedge, changes in the fair value of the
instrument will either be offset against the change in fair value of the hedged assets, liabilities, or firm commitment through earnings or recognized in
18
7. other comprehensive income until the hedged item is recognized in earnings. The ineffective portion of an instrument’s change in fair value will be
immediately recognized in earnings. All of the Company’s fair value hedges qualify for the use of the “short-cut” method of accounting to assess hedge
effectiveness. The Company uses the hypothetical derivative method to assess the effectiveness of its net investment and cash flow hedges. Instruments
that do not meet the criteria for hedge accounting or contracts for which we have not elected hedge accounting are marked to fair value with unrealized
gains or losses reported currently in earnings. Fair values are based upon management’s expectation of future interest rate curves and may change based
upon changes in those expectations.
Impairment of Assets
We periodically evaluate long-lived assets and acquired businesses for indicators of impairment. Management’s judgements regarding the existence
of impairment indicators are based on market conditions and operational performance. Future events could cause management to conclude that
impairment indicators exist and that the value of long-lived assets and goodwill associated with acquired businesses is impaired.
Revenue Recognition
We recognize sales revenue at the time a sale is made to the customer, except for the following types of transactions. Layaway transactions are recognized
when the customer satisfies all payment obligations and takes possession of the merchandise. We recognize SAM’S CLUB membership fee revenue over
the 12-month term of the membership. Customer purchases of Wal-Mart/SAM’S CLUB shopping cards are not recognized until the card is redeemed
and the customer purchases merchandise using the shopping card. Defective merchandise returned by customers is either returned to the supplier or is
destroyed and reimbursement is sought from the supplier. Supplier allowances and discounts received by the Company are included in the income
statement when the purpose for which those monies were designated is fulfilled.
Insurance/Self-Insurance
We use a combination of insurance, self-insured retention, and/or self-insurance for a number of risks including workers’ compensation, general liability,
vehicle liability and employee-related health care benefits, a portion of which is paid by the Associates. Liabilities associated with the risks that we retain
are estimated in part by considering historical claims experience, demographic factors, severity factors and other actuarial assumptions. The estimated
accruals for these liabilities could be significantly affected if future occurrences and claims differ from these assumptions and historical trends.
For a complete listing of our significant accounting policies, please see Note 1 to our consolidated financial statements that appear after this discussion.
Liquidity and Capital Resources Cash Flows Information
Our cash flows from operating activities were $10.3 billion in fiscal 2002, up from $9.6 billion in fiscal 2001. In fiscal 2002, we invested $8.4 billion in
capital assets, paid dividends of $1.2 billion, paid $1.2 billion to repurchase Company stock, received $1.1 billion from the termination of certain net
investment hedges, received $4.6 billion from the issuance of long-term debt and paid $3.5 billion in the repayment of long-term debt at its maturity.
Company Stock Purchase and Common Stock Dividends
During fiscal 2001, the Company announced plans to increase its existing common stock repurchase program by $1 billion, resulting in a total
authorization of $3 billion. During fiscal 2002, the Company repurchased 24.5 million of its common shares for a total approximate amount of
$1.2 billion. In March 2002, the Company’s Board of Directors reset the common stock repurchase program authorization so that the Company may
make future repurchases of its stock of up to $3 billion. The Company paid dividends totaling $0.28 per share in fiscal 2002. In March 2002, the
Company increased its dividend 7% to $0.30 per share for fiscal 2003. The Company has increased its dividend every year since it first declared a
dividend in March 1974.
Contractual Obligations and Other Commercial Commitments
The following tables set forth certain information concerning our obligations and commitments to make future payments under contracts, such as debt
and lease agreements, and under contingent commitments.
Payments due by period
Contractual obligations Less than 1–3 4–5 After
(in millions) Total 1 year years years 5 years
Long-term debt $ 17,944 $ 2,257 $ 5,448 $ 2,939 $ 7,300
Commercial paper 743 743 0 0 0
Capital lease obligations 5,514 425 847 828 3,414
Non-cancelable operating leases 8,054 623 1,188 1,112 5,131
Total contractual cash obligations $ 32,255 $ 4,048 $ 7,483 $ 4,879 $ 15,845
Amount of commitment expiration per period
Other commercial commitments Less than 1–3 4–5 After
(in millions) Total 1 year years years 5 years
Lines of credit $ 3,811 $ 1,561 $0 $ 2,250 $0
Informal lines of credit 694 694 0 0 0
Trade letters of credit 1,578 1,578 0 0 0
Standby letters of credit 743 743 0 0 0
Other 273 147 0 0 126
Total commercial commitments $ 7,099 $ 4,723 $0 $ 2,250 $ 126
19
8. The Company has entered into lease commitments for land and buildings for 20 future locations. These lease commitments with real estate developers
provide for minimum rentals for 10 to 20 years, excluding renewal options, which, if consummated based on current cost estimates, will approximate
$25 million annually over the lease terms.
Management believes that cash flows from operations and proceeds from the sale of commercial paper will be sufficient to finance any seasonal buildups
in merchandise inventories and meet other cash requirements. If the operating cash flow we generate is not sufficient to pay dividends and to fund all
capital expenditures, the Company anticipates funding any shortfall in these expenditures with a combination of commercial paper and long-term debt.
We plan to refinance existing long-term debt as it matures. We may also desire to obtain additional long-term financing for other corporate purposes.
We anticipate no difficulty in obtaining long-term financing in view of an excellent credit rating and favorable experiences in the debt market in the
recent past. During fiscal 2002, the Company issued $4.6 billion of long-term debt. The proceeds from the issuance of this debt were used to reduce
short-term borrowings, to refinance existing debt, financing expansion activities and other corporate purposes.
At January 31, 2002, the Company’s ratio of debt to total capitalization, including commercial paper borrowings, was 38.4%. This is in line with
management’s objective to maintain a debt to total capitalization ratio of approximately 40%.
In March 2002, the Company sold notes totaling $500 million under its existing shelf registration statement. These notes bear interest at 4.15% and are
due in June 2005. The proceeds from the sale of these notes will be used for general corporate purposes, which could include financing the repurchase
of shares of our common stock pursuant to our existing stock repurchase program. After consideration of this debt issuance and the debt issued in fiscal
2002, the Company is permitted to sell up to $2 billion of public debt under a shelf registration statement previously filed with the United States
Securities and Exchange Commission.
Expansion
In the United States, we plan to open approximately 50 new Wal-Mart stores and approximately 180 to 185 new Supercenters in fiscal 2003.
Relocations or expansions of existing discount stores will account for 110 to 115 of the new Supercenters, with the balance being new locations. We
also plan to further expand our Neighborhood Market concept by adding 15 to 20 units during fiscal 2003. The SAM’S CLUB segment plans to
open 50 to 55 Clubs during fiscal 2003, approximately half of which will be relocations or expansions of existing clubs. The SAM’S CLUB segment
will also continue its remodeling program, with approximately 100 projects expected to be completed during fiscal 2003. In order to serve these and
future developments, the Company plans to construct seven new distribution centers in the next fiscal year. Internationally, the Company plans to
open 120 to 130 new units. Projects are scheduled to open within the international operating group and will include new stores and clubs as well as
relocations of a few existing units. The units also include several restaurants, department stores and supermarkets in Mexico. In addition, the Company’s
German operation will continue to remodel its supercenter units. Total planned growth represents approximately 46 million square feet of net additional
retail space. Not included in the planned expansion discussed above is the Company’s recently announced Puerto Rico supermarket chain acquisition.
In February 2002, we announced our intent to purchase 35 Supermercado Amigo supermarkets in Puerto Rico. The transaction is scheduled to be
completed once necessary regulatory approval is obtained. Also not included in the above discussion is the Company’s planned acquisition of 6.1%
of the stock of The Seiyu Ltd. (Seiyu), a Japanese retail chain. Under the terms of the proposed purchase agreement, which was announced in March
2002, Wal-Mart will pay 6 billion yen or $46 million for an initial 6.1% ownership interest and will have the ability to invest up to 260 billion yen or
$2 billion in Seiyu which would increase our ownership to 66.7% over time. The transaction is subject to approval from Seiyu’s shareholders and other
approvals. Total planned capital expenditures for fiscal 2003 approximate $10.2 billion. We plan to finance expansion primarily with a combination of
commercial paper and the issuance of long-term debt.
Market Risk
Market risks relating to our operations include changes in interest rates and changes in foreign exchange rates. We enter into interest rate swaps to
minimize the risk and costs associated with financing activities, as well as to attain an appropriate mix of fixed and floating rate debt. The swap
agreements are contracts to exchange fixed or variable rates for variable or fixed interest rate payments periodically over the life of the instruments. The
following tables provide information about our derivative financial instruments and other financial instruments that are sensitive to changes in interest
rates. For debt obligations, the table presents principal cash flows and related weighted-average interest rates by expected maturity dates. For interest rate
swaps, the table presents notional amounts and interest rates by contractual maturity dates. The applicable floating rate index is included for variable
rate instruments. All amounts are stated in United States dollar equivalents.
Interest Rate Sensitivity as of January 31, 2002
Principal (Notional) Amount by Expected Maturity
Average Interest (Swap) Rate
Fair value
(Amounts in millions) 2003 2004 2005 2006 2007 Thereafter Total 1/31/02
Liabilities
U.S. dollar denominated long-term debt
including current portion
Fixed rate debt $ 2,164 $ 3,445 $ 1,874 $ 704 $ 2,235 $ 5,850 $ 16,272 $ 17,201
Average interest rate – USD rate 6.3% 6.0% 6.7% 6.7% 6.7% 7.2% 6.8%
Great Britain pound denominated long-term
debt including current portion
Fixed rate debt 93 129 – – – 1,450 1,672 1,718
Average interest rate 9.6% 3.8% 7.3% 6.9%
20
9. Interest Rate Sensitivity as of January 31, 2002
Principal (Notional) Amount by Expected Maturity
Average Interest (Swap) Rate
Fair value
(Amounts in millions) 2003 2004 2005 2006 2007 Thereafter Total 1/31/02
Interest Rate Derivative Financial
Instruments Related to Debt
Interest rate swap – Pay variable/receive fixed $ 500 – – – – – $ 500 $ 28
Average rate paid – Rate A minus 0.15%
Fixed rate received – USD rate 6.9% – – – – – 6.9%
Interest rate swap – Pay variable/receive fixed – – $ 500 – – – 500 17
Average rate paid – Rate B plus 2.35%
Fixed rate received – USD rate – – 7.5% – – – 7.5%
Interest rate swap – Pay variable/receive fixed – – – $ 597 – – 597 29
Average rate paid – Rate B plus 0.32%
Fixed rate received – USD rate – – – 5.9% – – 5.9%
Interest rate swap – Pay variable/receive fixed – – – – $ 250 – 250 14
Average rate paid – Rate B plus 2.27%
Fixed rate received – USD rate – – – – 8.0% – 8.0%
Interest rate swap – Pay variable/receive fixed – – – – – $ 445 445 18
Average rate paid – Rate B plus 1.01%
Fixed rate received – USD rate – – – – – 7.3% 7.3%
Interest rate swap – Pay variable/receive fixed – – – – 1,500 – 1,500 66
Average rate paid – Rate B plus 0.63%
Fixed rate received – USD rate – – – – 5.5% – 5.5%
Interest rate basis swap – – – – – 500 500 1
Average rate paid – Rate C
Average rate received – Rate A minus 0.06%
Rate A – one-month U.S. LIBOR
Rate B – three-month U.S. LIBOR
Rate C – U.S. commercial paper
Interest Rate Sensitivity as of January 31, 2001
Principal (Notional) Amount by Expected Maturity
Average Interest (Swap) Rate
Fair value
(Amounts in millions) 2002 2003 2004 2005 2006 Thereafter Total 1/31/01
Liabilities
U.S. dollar denominated long-term debt
including current portion
Fixed rate debt $ 4,223 $ 1,126 $ 809 $ 1,926 $ 750 $ 6,229 $ 15,063 $ 15,596
Average interest rate – USD rate 6.8% 6.8% 6.9% 6.9% 6.9% 6.9% 6.9%
Great Britain pound denominated Long-term
debt including current portion
Fixed rate debt 11 236 – – – 1,425 1,672 1,670
Average interest rate 8.4% 8.4% 7.2% 7.2%
Interest Rate Derivative Financial
Instruments Related to Debt
Interest rate swap – Pay variable/receive fixed 500 – – – – 500 28
Average rate paid – Rate A
Fixed rate received – USD rate 6.9% – – – – 6.9%
Interest rate swap – Pay variable/receive fixed 59 63 68 72 78 41 381 17
Average rate paid – Rate B
Fixed rate received – USD rate 7.0% 7.0% 7.0% 7.0% 7.0% 7.0% 7.0%
Interest rate basis swap 500 500 0
Average rate paid – Rate C
Average rate received – Rate A minus 0.06%
Rate A – one-month U.S. LIBOR minus 0.15%
Rate B – 30-day U.S. dollar commercial paper non-financial
Rate C – U.S. commercial paper
21
10. The Company holds currency swaps to hedge its net investment in the United Kingdom. The following tables provide information about our cross-
currency interest rate swap agreements by functional currency, and presents the information in United States dollar equivalents. For these instruments
the tables present notional amounts, exchange rates and interest rates by contractual maturity date.
Foreign Currency Exchange Rate Sensitivity as of January 31, 2002
Principal (Notional) Amount by Expected Maturity
Fair value
(Amounts in millions) 2003 2004 2005 2006 2007 Thereafter Total 1/31/2002
Currency Swap Agreements
Payment of Great Britain pounds
Notional amount – – – – – $ 1,250 $ 1,250 $ 192
Average contract rate – – – – – 0.6 0.6
Fixed rate received – USD rate – – – – – 7.4% 7.4%
Fixed rate paid – Great Britain pound rate – – – – – 5.8% 5.8%
Payment of Canadian dollars
Notional amount – – – – – 325 325 8
Average contract rate – – – – – 1.5 1.5
Fixed rate received – USD rate – – – – – 5.6% 5.6%
Fixed rate paid – Canadian dollar rate – – – – – 5.7% 5.7%
Foreign Currency Exchange Rate Sensitivity as of January 31, 2001
Principal (Notional) Amount by Expected Maturity
Fair value
(Amounts in millions) 2002 2003 2004 2005 2006 Thereafter Total 1/31/2001
Currency Swap Agreements
Payment of German Deutschemarks
Notional amount – $ 1,101 – – – – $ 1,101 $ 186
Average contract rate – 1.8 – – – – 1.8
Fixed rate received – USD rate – 5.8% – – – – 5.8%
Fixed rate paid – DEM rate – 4.5% – – – – 4.5%
Payment of German Deutschemarks
Notional amount – – $ 809 – – – 809 180
Average contract rate – – 1.7 – – – 1.7
Fixed rate received – USD rate – – 5.2% – – – 5.2%
Fixed rate paid – DEM rate – – 3.4% – – – 3.4%
Payment of Great Britain pounds
Notional amount – – – – – $ 4,750 4,750 659
Average contract rate – – – – – 0.6 0.6
Fixed rate received – USD rate – – – – – 7.0% 7.0%
Fixed rate paid – Great Britain pound rate – – – – – 6.1% 6.1%
Payment of Canadian dollars
Notional amount – – – $ 1,250 – – 1,250 57
Average contract rate – – – 1.5 – – 1.5
Fixed rate received – USD rate – – – 6.6% – – 6.6%
Fixed rate paid – Canadian dollar rate – – – 5.7% – – 5.7%
During the fourth quarter of fiscal 2002, the Company terminated certain cross currency instruments that hedged portions of the Company’s
investments in Canada, Germany and the United Kingdom. The instruments terminated had notional amounts of $6.7 billion. The Company received
$1.1 billion in cash related to the fair value of the instruments at the time of the terminations. Prior to the terminations, these instruments were
classified as net investment hedges and were recorded at fair value as current assets on the balance sheet with a like amount recorded in the shareholders’
equity section of the balance sheet in line “other accumulated comprehensive income.” No gain related to the terminations was recorded in the
Company’s income statement.
We routinely enter into forward currency exchange contracts in the regular course of business to manage our exposure against foreign currency
fluctuations on cross-border purchases of inventory. These contracts are generally for durations of six months or less. At January 31, 2002 and 2001,
we held contracts to purchase and sell various currencies with notional amounts of $118 million and $292 million, respectively, and net fair values of
$0 and $6 million, respectively. The fair values of the currency swap agreements are recorded in the consolidated balance sheets within the line “other
assets and deferred charges.”
On February 1, 2001, we adopted SFAS 133 pertaining to the accounting for derivatives and hedging activities. SFAS 133 requires all derivatives to be
recorded on the balance sheet at fair value and establishes accounting treatment for three types of hedges: hedges of changes in the fair value of assets,
liabilities, or firm commitments; hedges of the variable cash flows of forecasted transactions; and hedges of foreign currency exposures of net investments
in foreign operations. At the date of adoption, the majority of our derivatives were hedges of net investments in foreign operations, and as such,
the fair value of these derivatives had been recorded on the balance sheet as either assets or liabilities and on the balance sheet in other accumulated
comprehensive income under the previous accounting guidance. As the majority of our derivative portfolio had already been recorded on the balance
22
11. sheet, adoption of SFAS 133 did not materially impact our Consolidated Financial Statements taken as a whole. However, certain swap cash flows
amounting to $86 million in fiscal 2002, which would have been recorded in the income statement under the previous accounting guidance, were
recorded on the balance sheet in other accumulated comprehensive income. In fiscal 2001, prior to the adoption of SFAS 133, the Company recorded
$112 million of earnings benefit in the income statement from the receipt of similar cash flows. Under Statement 133, cash flows from fixed to variable
interest rate swaps continue to be recorded in the interest expense line of the income statement. For fiscal 2002, the effects of fixed to variable interest
rate swaps reduced interest expense by $62 million. Management is uncertain of the future impacts of the Company’s fixed to variable interest rate
swaps on interest expense.
With the adoption of SFAS 133 and the termination of a significant portion of Company’s net investment hedges, the Company is currently
reevaluating its hedging strategy regarding its net investment in overseas operations.
New Accounting Pronouncements
In June 2001, the Financial Accounting Standards Board issued Statements of Financial Accounting Standards No. 141, Business Combinations, and
No. 142, Goodwill and Other Intangible Assets, effective for fiscal years beginning after December 15, 2001. Under the new rules, goodwill and
intangible assets deemed to have indefinite lives will no longer be amortized but will be subject to annual impairment tests in accordance with those
Statements. Other intangible assets will continue to be amortized over their useful lives.
We will apply the new rules on accounting for goodwill and other intangible assets beginning in the first quarter of fiscal 2003. Application of the
nonamortization provisions of the Statement is expected to result in an increase in net income of approximately $250 million for fiscal 2002. Prior to
the completion of the second quarter of fiscal 2003, we will complete a transitional impairment review for goodwill and indefinite lived intangible assets
as of the date of adoption. Subsequently, we will perform similar impairment reviews on an annual basis. Management does not believe that the
adoption of the impairment review provisions of the statement will have a material effect on the earnings and financial position of the Company.
In August 2001, the Financial Accounting Standards Board issued Statement of Financial Accounting Standards No. 144, Accounting for the
Impairment or Disposal of Long-Lived Assets (SFAS 144), which addresses financial accounting and reporting for the impairment or disposal of long-
lived assets and supersedes SFAS No. 121, Accounting for the Impairment of Long-Lived Assets and for Long-Lived Assets to be Disposed Of, and the
accounting and reporting provisions of APB Opinion No. 30, Reporting the Results of Operations for a Disposal of a Segment of a Business. SFAS 144
is effective for fiscal years beginning after December 15, 2001, with earlier application encouraged. We will adopt SFAS 144 as of February 1, 2002 and
do not believe that the adoption of SFAS 144 will have a material impact on our financial position or results of operations.
In May 2000, the Emerging Issues Task Force (EITF) reached a consensus on Issue 00-14, Accounting for Certain Sales Incentives. This issue involves
the accounting and income statement classification for sales subject to rebates and revenue sharing arrangements as well as coupons and discounts. The
EITF concluded that sales incentives offered to customers to buy a product should be classified as a reduction of sales. This issue is effective for fiscal
quarters beginning after December 15, 2001. We anticipate implementing this issue in the first quarter of fiscal 2003; however, we do not expect any
reclassification because of our Every Day Low Price Strategy and because rebates and coupons accepted by the Company’s stores are offered by the
product supplier and not by the Company. As a result, the adoption of this guidance is not expected to have a significant impact on the Company’s
financial position or results of operations.
Forward-Looking Statements
The Private Securities Litigation Reform Act of 1995 provides a safe harbor for forward-looking statements made by or on behalf of the Company.
Certain statements contained in this Management’s Discussion and Analysis, in other parts of this report and in our other filings are forward-looking
statements. These statements discuss, among other things, expected growth, future revenues, future cash flows and future performance, the anticipation
and expectations of the Company and its management for future occurrences. The forward-looking statements are subject to risks, uncertainties and
other factors, including: the cost of goods, competitive pressures, inflation, consumer debt levels, currency exchange fluctuations, trade restrictions,
changes in tariff and freight rates, interest rate fluctuations and other capital market conditions, and other risks that the Company discusses more fully
in its filings with the SEC, including the Company’s Annual Report on Form 10-K. We filed our Annual Report on Form 10-K for our fiscal year 2002
with the SEC on or about April 15, 2002. Actual results may materially differ from anticipated results described in these statements as a result of
changes in facts, assumptions not being realized or other circumstances.
23
12. Consolidated Statements of Income
(Amounts in millions except per share data)
Fiscal years ended January 31, 2002 2001 2000
Revenues
Net sales $ 217,799 $ 191,329 $ 165,013
Other income-net 2,013 1,966 1,796
219,812 193,295 166,809
Costs and Expenses
Cost of sales 171,562 150,255 129,664
Operating, selling and general and administrative expenses 36,173 31,550 27,040
Interest Costs
Debt 1,052 1,095 756
Capital leases 274 279 266
209,061 183,179 157,726
Income Before Income Taxes, Minority Interest and
Cumulative Effect of Accounting Change 10,751 10,116 9,083
Provision for Income Taxes
Current 3,712 3,350 3,476
Deferred 185 342 (138)
3,897 3,692 3,338
Income Before Minority Interest and
Cumulative Effect of Accounting Change 6,854 6,424 5,745
Minority Interest (183) (129) (170)
Income Before Cumulative Effect of Accounting Change 6,671 6,295 5,575
Cumulative Effect of Accounting Change, net of tax benefit of $119 – – (198)
Net Income $ 6,671 $ 6,295 $ 5,377
Net Income Per Common Share:
Basic Net Income Per Common Share:
Income before cumulative effect of accounting change $ 1.49 $ 1.41 $ 1.25
Cumulative effect of accounting change, net of tax – – (0.04)
Net Income Per Common Share $ 1.49 $ 1.41 $ 1.21
Average Number of Common Shares 4,465 4,465 4,451
Diluted Net Income Per Common Share:
Income before cumulative effect of accounting change $ 1.49 $ 1.40 $ 1.25
Cumulative effect of accounting change, net of tax – – (0.04)
Net Income Per Common Share $ 1.49 $ 1.40 $ 1.20
Average Number of Common Shares 4,481 4,484 4,474
See accompanying notes.
24
13. Consolidated Balance Sheets
(Amounts in millions)
January 31, 2002 2001
Assets
Current Assets
Cash and cash equivalents $ 2,161 $ 2,054
Receivables 2,000 1,768
Inventories
At replacement cost 22,749 21,644
Less LIFO reserve 135 202
Inventories at LIFO cost 22,614 21,442
Prepaid expenses and other 1,471 1,291
Total Current Assets 28,246 26,555
Property, Plant and Equipment, at Cost
Land 10,241 9,433
Building and improvements 28,527 24,537
Fixtures and equipment 14,135 12,964
Transportation equipment 1,089 879
53,992 47,813
Less accumulated depreciation 11,436 10,196
Net property, plant and equipment 42,556 37,617
Property Under Capital Lease
Property under capital lease 4,626 4,620
Less accumulated amortization 1,432 1,303
Net property under capital leases 3,194 3,317
Other Assets and Deferred Charges
Net goodwill and other acquired intangible assets 8,595 9,059
Other assets and deferred charges 860 1,582
Total Assets $ 83,451 $ 78,130
Liabilities and Shareholders’ Equity
Current Liabilities
Commercial paper $ 743 $ 2,286
Accounts payable 15,617 15,092
Accrued liabilities 7,174 6,355
Accrued income taxes 1,343 841
Long-term debt due within one year 2,257 4,234
Obligations under capital leases due within one year 148 141
Total Current Liabilities 27,282 28,949
Long-Term Debt 15,687 12,501
Long-Term Obligations Under Capital Leases 3,045 3,154
Deferred Income Taxes and Other 1,128 1,043
Minority Interest 1,207 1,140
Shareholders’ Equity
Preferred stock ($0.10 par value; 100 shares authorized, none issued)
Common stock ($0.10 par value; 11,000 shares authorized, 4,453
and 4,470 issued and outstanding in 2002 and 2001, respectively) 445 447
Capital in excess of par value 1,484 1,411
Retained earnings 34,441 30,169
Other accumulated comprehensive income (1,268) (684)
Total Shareholders’ Equity 35,102 31,343
Total Liabilities and Shareholders’ Equity $ 83,451 $ 78,130
See accompanying notes.
25
14. Consolidated Statements of Shareholders’ Equity
Other
Capital in accumulated
Number Common excess of Retained comprehensive
(Amounts in millions) of shares stock par value earnings income Total
Balance – January 31, 1999 4,448 $ 445 $ 435 $ 20,741 ($ 509) $21,112
Comprehensive Income
Net income 5,377 5,377
Other accumulated comprehensive income
Foreign currency translation adjustment (182) (182)
Hedge accounting adjustment 236 236
Total Comprehensive Income 5,431
Cash dividends ($.20 per share) (890) (890)
Purchase of Company stock (2) (2) (99) (101)
Stock options exercised and other 11 1 281 282
Balance – January 31, 2000 4,457 446 714 25,129 (455) 25,834
Comprehensive Income
Net income 6,295 6,295
Other accumulated comprehensive income
Foreign currency translation adjustment (1,126) (1,126)
Hedge accounting adjustment 897 897
Total Comprehensive Income 6,066
Cash dividends ($.24 per share) (1,070) (1,070)
Purchase of Company stock (4) (8) (185) (193)
Issuance of Company stock 11 1 580 581
Stock options exercised and other 6 125 125
Balance – January 31, 2001 4,470 447 1,411 30,169 (684) 31,343
Comprehensive Income
Net income 6,671 6,671
Other accumulated comprehensive income
Foreign currency translation adjustment (472) (472)
Hedge accounting adjustment (112) (112)
Total Comprehensive Income 6,087
Cash dividends ($.28 per share) (1,249) (1,249)
Purchase of Company stock (24) (2) (62) (1,150) (1,214)
Stock options exercised and other 7 135 135
Balance – January 31, 2002 4,453 $ 445 $ 1,484 $ 34,441 ($ 1,268) $ 35,102
26
15. Consolidated Statements of Cash Flows
(Amounts in millions)
Fiscal years ended January 31, 2002 2001 2000
Cash flows from operating activities
Net Income $ 6,671 $ 6,295 $ 5,377
Adjustments to reconcile net income to net cash
provided by operating activities:
Depreciation and amortization 3,290 2,868 2,375
Cumulative effect of accounting change, net of tax – – 198
Increase in accounts receivable (210) (422) (255)
Increase in inventories (1,235) (1,795) (2,088)
Increase in accounts payable 368 2,061 1,849
Increase in accrued liabilities 1,125 11 1,015
Deferred income taxes 185 342 (138)
Other 66 244 (139)
Net cash provided by operating activities 10,260 9,604 8,194
Cash flows from investing activities
Payments for property, plant and equipment (8,383) (8,042) (6,183)
Investment in international operations (net of cash acquired,
$195 million in Fiscal 2000) – (627) (10,419)
Proceeds from termination of net investment hedges 1,134 – –
Other investing activities 103 (45) (244)
Net cash used in investing activities (7,146) (8,714) (16,846)
Cash flows from financing activities
Increase/(decrease) in commercial paper (1,533) (2,022) 4,316
Proceeds from issuance of long-term debt 4,591 3,778 6,000
Purchase of Company stock (1,214) (193) (101)
Dividends paid (1,249) (1,070) (890)
Payment of long-term debt (3,519) (1,519) (863)
Payment of capital lease obligations (167) (173) (133)
Proceeds from issuance of Company stock – 581 –
Other financing activities 113 176 224
Net cash provided by (used in) financing activities (2,978) (442) 8,553
Effect of exchange rate changes on cash (29) (250) 76
Net increase/(decrease) in cash and cash equivalents 107 198 (23)
Cash and cash equivalents at beginning of year 2,054 1,856 1,879
Cash and cash equivalents at end of year $ 2,161 $ 2,054 $ 1,856
Supplemental disclosure of cash flow information
Income tax paid $ 3,196 $ 3,509 $ 2,780
Interest paid 1,312 1,319 849
Capital lease obligations incurred 225 576 378
Property, plant and equipment acquired with debt – – 65
ASDA acquisition cost satisfied with debt – – 264
ASDA acquisition cost satisfied with Company stock – – 175
See accompanying notes.
27
16. Notes to Consolidated Financial Statements
1 Summary of Accounting Policies
Consolidation
The consolidated financial statements include the accounts of subsidiaries. Significant intercompany transactions have been eliminated
in consolidation.
Cash and cash equivalents
The Company considers investments with a maturity of three months or less when purchased to be cash equivalents.
Inventories
The Company uses the retail last-in, first-out (LIFO) method for the Wal-Mart Stores segment, cost LIFO for the SAM’S CLUB segment,
and other cost methods, including the retail first-in, first-out (FIFO) and average cost methods, for the International segment. Inventories
are not recorded in excess of market value.
Financial Instruments
The Company uses derivative financial instruments for purposes other than trading to reduce its exposure to fluctuations in foreign
currencies and to minimize the risk and cost associated with financial and global operating activities. Generally, contract terms of a hedge
instrument closely mirror those of the item it hedges providing a high degree of risk reduction and correlation. Contracts that are highly
effective at meeting the risk reduction and correlation criteria are recorded using hedge accounting. On February 1, 2001, the Company
adopted Financial Accounting Standards Board (FASB) Statements No. 133, 137 and 138 (collectively “SFAS 133”) pertaining to accounting
for derivatives and hedging activities. SFAS 133 requires all derivatives to be recorded on the balance sheet at fair value and establishes
accounting treatment for hedges. If a derivative instrument is a hedge, depending on the nature of the hedge, changes in the fair value of
the instrument will either be offset against the change in fair value of the hedged assets, liabilities, or firm commitment through earnings or
recognized in other comprehensive income until the hedged item is recognized in earnings. The ineffective portion, if any, of an instrument’s
change in fair value will be immediately recognized in earnings. All of the Company’s fair value hedges qualify for the use of the “short-cut”
method of accounting to assess hedge effectiveness. The Company uses the hypothetical derivative method to assess the effectiveness of its net
investment and cash flow hedges. Instruments that do not meet the criteria for hedge accounting and contracts for which the Company has
not elected hedge accounting are marked to fair value with unrealized gains or losses reported currently in earnings. At February 1, 2001, the
majority of the Company’s derivatives were hedges of net investments in foreign operations. As such, the fair value of these derivatives had
already been recorded on the balance sheet as either assets or liabilities and in other comprehensive income under the previous accounting
guidance. As the majority of the Company’s derivative portfolio was already recorded on the balance sheet, the adoption of SFAS 133 did
not have a material impact on the Company’s consolidated financial statements.
Interest during construction
For interest costs to properly reflect only that portion relating to current operations, interest on borrowed funds during the construction of
property, plant and equipment is capitalized. Interest costs capitalized were $130 million, $93 million and $57 million in 2002, 2001 and
2000, respectively.
Long-lived assets
The Company periodically reviews long-lived assets. If indicators of impairments exist and if the value of the assets is impaired, an
impairment loss would be recognized.
Goodwill and other acquired intangible assets
Goodwill and other acquired intangible assets are amortized on a straight-line basis over the periods that expected economic benefits will
be provided. These amortization periods range from 20 to 40 years. Management estimates these periods of economic benefit using factors
such as entry barriers in certain countries, operating rights and estimated lives of other operating assets acquired. The realizability of
goodwill and other intangibles is evaluated periodically when events or circumstances indicate a possible inability to recover the carrying
amount. These evaluations are based on undiscounted cash flow and profitability projections that incorporate the impact of existing
Company businesses. The analyses require significant management judgment to evaluate the capacity of an acquired business to perform
within projections. Historically, the Company has generated sufficient returns from acquired businesses to recover the cost of the goodwill
and other intangible assets.
Foreign currency translation
The assets and liabilities of all foreign subsidiaries are translated at current exchange rates. Related translation adjustments are recorded as
a component of other accumulated comprehensive income.
Revenue Recognition
The Company recognizes sales revenue at the time it sells merchandise to the customer, except for layaway transactions. The Company
recognizes layaway transactions when the customer satisfies all payment obligations and takes possession of the merchandise. The Company
recognizes SAM’S CLUB membership fee revenue over the 12-month term of the membership. Customer purchases of Wal-Mart/SAM’S
CLUB shopping cards are not recognized until the card is redeemed and the customer purchases merchandise by using the shopping card.
Defective merchandise returned by customers is either returned to the supplier or is destroyed and reimbursement is sought from the supplier.
28
17. Supplier rebates and discounts received by the Company are included in the income statement when the purpose for which those monies
were designated is fulfilled.
Operating, selling and general and administrative expenses
Buying, warehousing and occupancy costs are included in operating, selling and general and administrative expenses.
Advertising costs
Advertising costs are expensed as incurred and were $618 million, $574 million and $523 million in 2002, 2001 and 2000, respectively.
Advertising costs consist primarily of expenditures for print and television advertisements.
Pre-opening costs
The costs of start-up activities, including organization costs, are expensed as incurred.
Insurance/Self-Insurance
The Company uses a combination of insurance, self-insured retention, and self-insurance for a number of risks including workers’
compensation, general liability, vehicle liability and employee related health care benefits, a portion of which is paid by the Associates.
Liabilities associated with these risks are estimated in part by considering historical claims experience, demographic factors, severity factors
and other actuarial assumptions.
Depreciation and amortization
Depreciation and amortization for financial statement purposes are provided on the straight-line method over the estimated useful lives of the
assets. Depreciation expense, including amortization of properties under capital leases, for the years 2002, 2001 and 2000 was $2.7 billion,
$2.4 billion and $2.0 billion, respectively. For income tax purposes, accelerated methods are used with recognition of deferred income taxes
for the resulting temporary differences. Estimated useful lives for financial statements purposes are as follows:
Building and improvements 5 – 50 years
Fixtures and equipment 5 – 12 years
Transportation equipment 2 – 5 years
Internally developed software 3 years
Net income per share
Basic net income per share is based on the weighted average outstanding common shares. Diluted net income per share is based on the
weighted average outstanding shares adjusted for the dilutive effect of stock options (16 million, 19 million and 23 million shares in 2002,
2001 and 2000, respectively). The Company had approximately 3.5 million, 2.0 million and 0.5 million option shares outstanding at January
31, 2002, 2001 and 2000, respectively, that were not included in the dilutive earnings per share calculation because the effect would have
been antidilutive.
Estimates and assumptions
The preparation of consolidated financial statements in conformity with generally accepted accounting principles requires management to
make estimates and assumptions. These estimates and assumptions affect the reported amounts of assets and liabilities. They also affect the
disclosure of contingent assets and liabilities at the date of the consolidated financial statements and the reported amounts of revenues and
expenses during the reporting period. Actual results may differ from these estimates.
Accounting principle change
In December 1999, the Securities and Exchange Commission issued Staff Accounting Bulletin No. 101, “Revenue Recognition in Financial
Statements” (SAB 101). SAB 101 dealt with revenue recognition issues, several of which are common within the retail industry. As a result of
the issuance of SAB 101, the Company changed its method of accounting for SAM’S CLUB membership fee revenue both domestically and
internationally in fiscal 2000. Previously, the Company had recognized membership fee revenues when received. Under the new accounting
method, the Company recognizes membership fee revenues over the term of the membership, which is 12 months. The Company recorded a
non-cash charge of $198 million (after reduction for income taxes of $119 million), or $.04 per share, to reflect the cumulative effect of the
accounting change as of the beginning of the fiscal year. The effect of this change on the year ended January 31, 2000, before the cumulative
effect of the accounting change was to decrease net income $12 million.
The following table provides unearned revenues, membership fees received from members and the amount of revenues recognized in earnings
for each of the fiscal years ended 2000, 2001 and 2002 as if the accounting change had been in effect for each of those years (in millions):
Deferred revenue January 31, 1999 $ 317
Membership fees received 646
Membership revenue recognized (626)
Deferred revenue January 31, 2000 337
Membership fees received 706
Membership revenue recognized (674)
Deferred revenue January 31, 2001 369
Membership fees received 748
Membership revenue recognized (730)
Deferred revenue January 31, 2002 $ 387
29
18. The Company’s deferred revenue is included in accrued liabilities in the consolidated balance sheet. The Company’s analysis of
historical membership fee refunds indicates that refunds have been minimal. Accordingly, no reserve exists for membership fee refunds
at January 31, 2002.
An additional requirement of SAB 101 is that layaway transactions be recognized upon delivery of the merchandise to the customer rather
than at the time that the merchandise is placed on layaway. The Company offers a layaway program that allows customers to make payments
on items over a specific period. Until the first quarter of fiscal 2001, the Company recognized revenues from these layaway transactions at the
time that the merchandise was placed on layaway. During the first quarter of fiscal 2001, the Company changed its accounting method for
layaway transactions so that the revenue from these transactions is not recognized until the customer satisfies all payment obligations and
takes possession of the merchandise. Layaway transactions are a small portion of the Company’s revenue. Due to the minimal impact of this
accounting change, prior fiscal year results have not been restated.
New accounting pronouncements
In June 2001, the Financial Accounting Standards Board issued Statements of Financial Accounting Standards No. 141, Business
Combinations, and No. 142, Goodwill and Other Intangible Assets, effective for fiscal years beginning after December 15, 2001. Under the new
rules, goodwill and intangible assets deemed to have indefinite lives will no longer be amortized, but will be subject to annual impairment
tests in accordance with the Statements. Other intangible assets will continue to be amortized over their useful lives.
The Company will apply the new rules on accounting for goodwill and other intangible assets beginning in the first quarter of fiscal 2003.
Application of the nonamortization provisions of the Statement is expected to result in an increase in net income of approximately
$250 million for fiscal 2003. Prior to the completion of the second quarter of fiscal 2003, the Company will complete a transitional
impairment review for goodwill and indefinite lived intangible assets as of the date of adoption. Subsequently, the Company will perform
similar impairment reviews annually. Management does not believe that the adoption of the impairment review provisions of the standard
will have a material effect on the Company’s financial position or results of operations.
In August 2001, the Financial Accounting Standards Board issued Statement of Financial Accounting Standards No. 144, Accounting for
the Impairment or Disposal of Long-Lived Assets (FAS 144), which addresses financial accounting and reporting for the impairment or disposal
of long-lived assets. FAS 144 supersedes SFAS No. 121, Accounting for the Impairment of Long-Lived Assets and for Long-Lived Assets to be
Disposed Of, and the accounting and reporting provisions of APB Opinion No. 30, Reporting the Results of Operations for a Disposal of a
Segment of a Business. The Company will adopt FAS 144 as of February 1, 2002 and does not believe that the adoption of FAS 144 will have
a material impact on the Company’s financial position or results of operations.
In May 2000, the Emerging Issues Task Force (EITF) reached a consensus on Issue 00-14, Accounting for Certain Sales Incentives. This issue
involves the accounting and income statement classification for sales subject to rebates and revenue sharing arrangements as well as coupons
and discounts. The EITF concluded that sales incentives offered to customers to buy a product should be classified as a reduction of sales.
The Company will implement Issue 00-14 in the first quarter of fiscal 2003. The Company does not expect any reclassification because of its
Every Day Low Price strategy and because rebates and coupons accepted by the Company’s stores are offered by the product’s supplier and
not by the Company. As a result, the adoption of this guidance is not expected to have a significant impact on the Company’s financial
position or results of operations.
Reclassifications
Certain reclassifications have been made to prior periods to conform to current presentations.
2 Defined Contribution Plans
In the United States, the Company maintains a Profit Sharing Plan under which most full-time and many part-time Associates become
participants following one year of employment and 401(k) retirement savings plans to which Associates may elect to contribute a percentage
of their earnings. During fiscal 2002 most participants could contribute up to 15% of their pretax earnings, but not more than statutory
limits.
The Company made annual contributions in cash to these plans on behalf of all eligible Associates, including those who did not elect to
contribute to the 401(k) plan. During fiscal 2002, eligible Associates could choose to receive a cash payout equal to one-half of the Company
contribution that otherwise would have been made into the 401(k) plan. Those who did not choose a cash option had their money
contributed into their 401(k) plan. Associates may choose from among 14 different 401(k) investment options. For Associates who do not
make any election, their 401(k) balance is placed in a conservative balanced fund. Associates are immediately vested in their 401(k) funds
and may change their investment options at any time.
Additionally, the Company maintains various plans internationally. These plans are administered based upon the legislative and tax
requirements in the country in which they are established.
Annual contributions to the 401(k) and profit sharing plans and the various international plans are made at the sole discretion of the
Company, and were $555 million, $486 million and $429 million in 2002, 2001 and 2000, respectively. In addition, in fiscal 2002 the
Company paid $34 million in cash to Associates in lieu of Company contributions to the 401(k) plan.
30