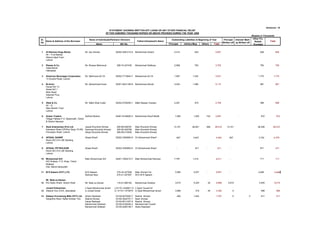
Downloaded 15 times
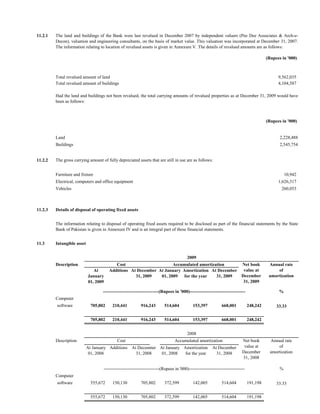
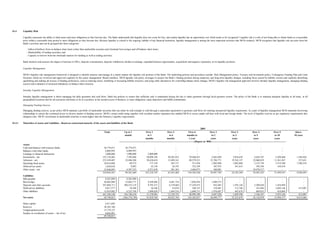
![2009 2008
(Rupees in '000)
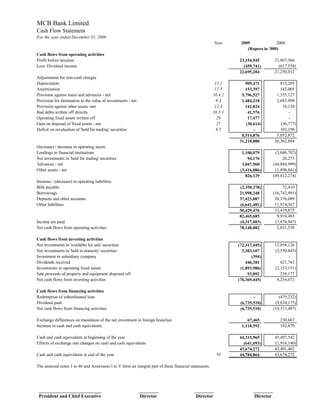
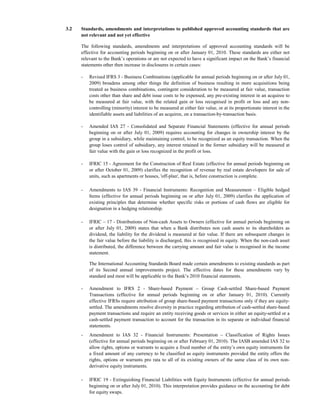
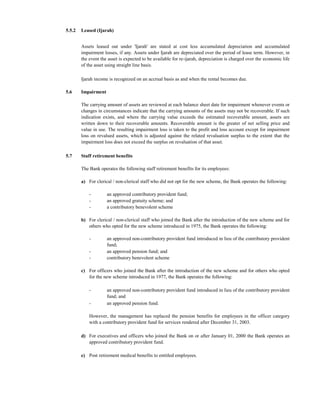
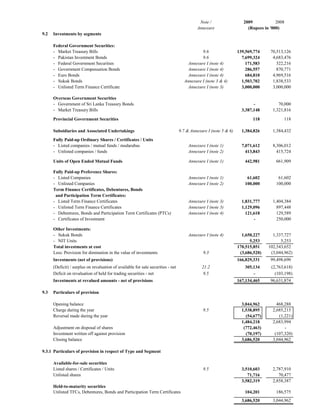
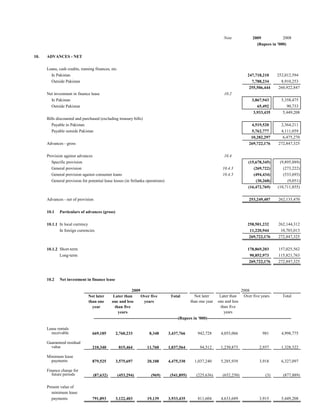
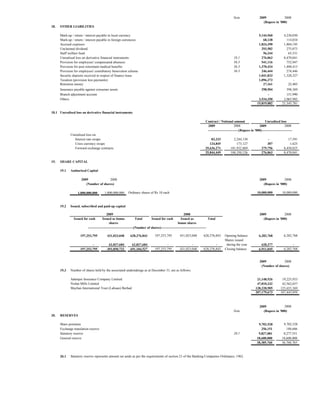
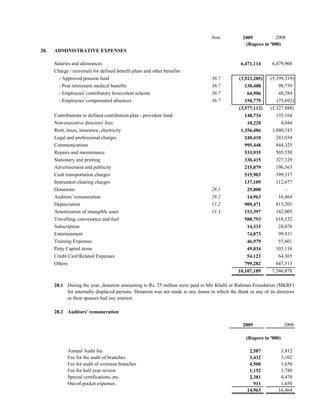
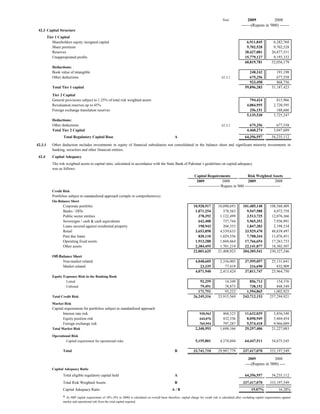
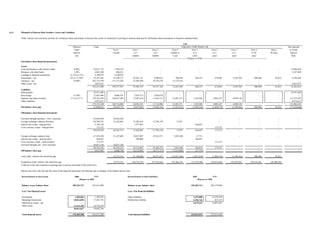
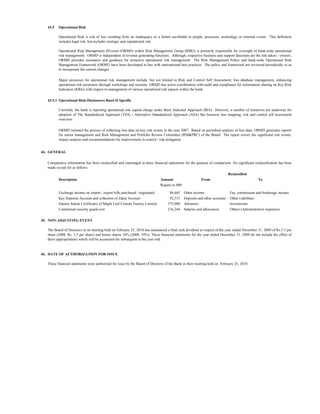
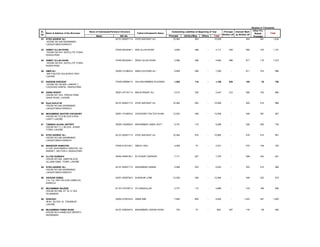
29. OTHER CHARGES
Fixed assets written off 17,477 -
Penalties of State Bank of Pakistan 30,000 300,000
Workers welfare fund 463,099 437,351
VAT Sri Lanka 103,707 80,473
Others 75,867 -
690,150 817,824
30. TAXATION
For the year
Current 7,703,305 7,341,257
Deferred 298,807 16,533
8,002,112 7,357,790
Prior years
Current (2,232,226) (864,824)
Deferred 1,889,762 -
(342,464) (864,824)
7,659,648 6,492,966
30.1 Relationship between tax expense and accounting profit
Accounting profit for the year 23,154,945 21,867,566
Tax rate 35% 35%
Tax on income 8,104,231 7,653,648
Tax effect on separate block of income (taxable at reduced rate) (114,935) (234,934)
Tax effect of permanent differences 24,836 (49,444)
Tax effect of prior years provisions / reversals (342,464) (864,824)
Reversal of deferred tax liability on incremental depreciation (12,020) (11,480)
Tax charge for the year 7,659,648 6,492,966
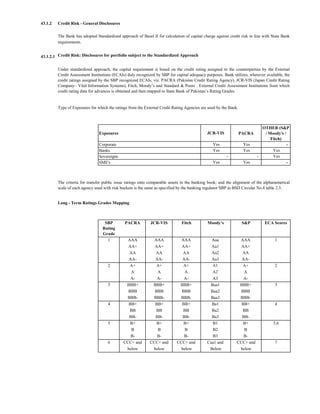
31. CREDIT RATING
PACRA through its notification in June 2009, has maintained long term credit rating of AA+ [double A plus]
and short-term credit rating of A1+ [A one plus] to the Bank (2008: AA+ [Double A plus] for long term and
A1+ [A one plus] for short term rating).](https://image.slidesharecdn.com/annual2009-110524204946-phpapp02/85/Annual2009-41-320.jpg)
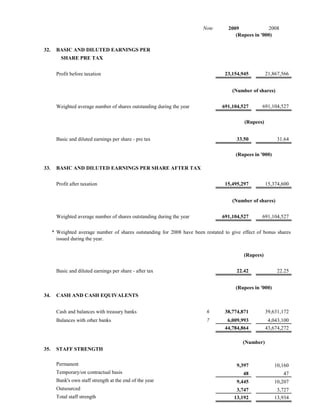
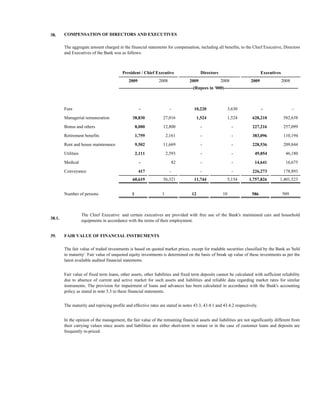
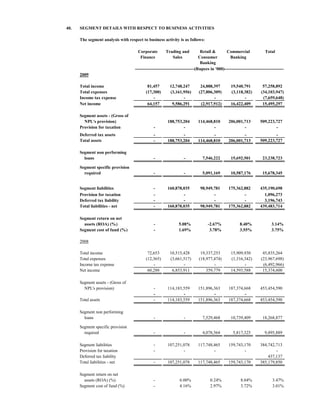
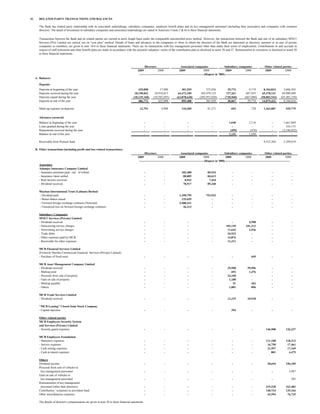
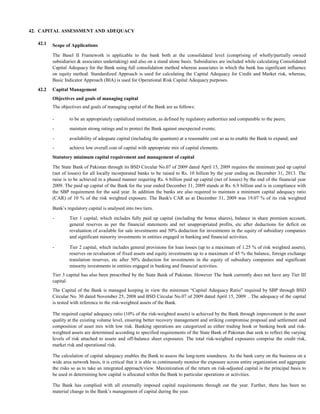
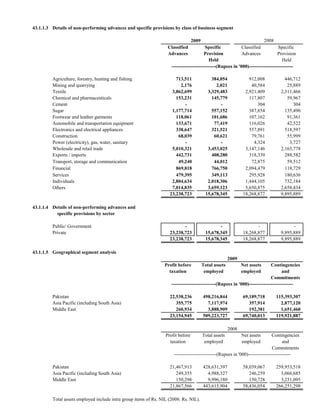
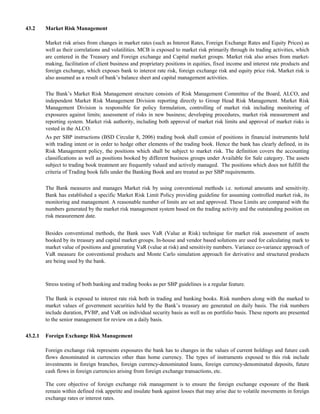
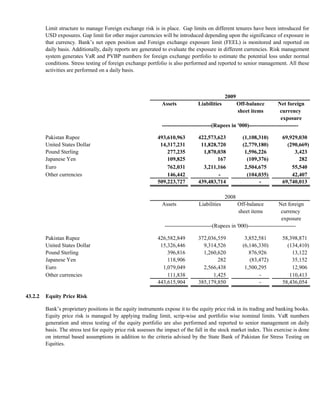
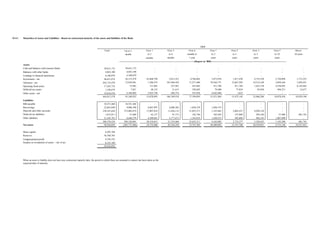
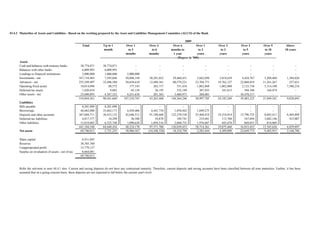
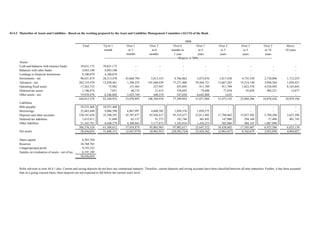
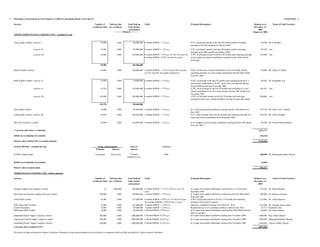
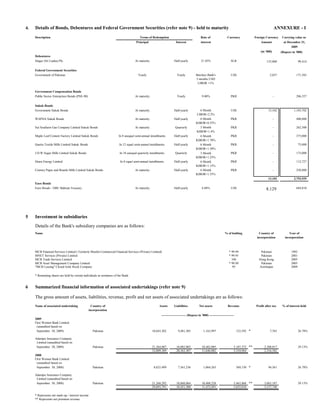

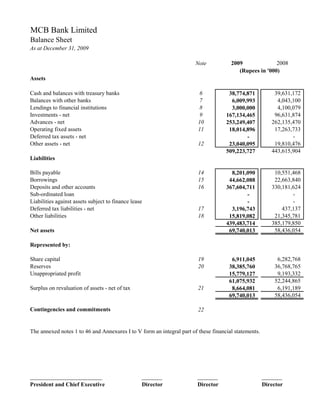
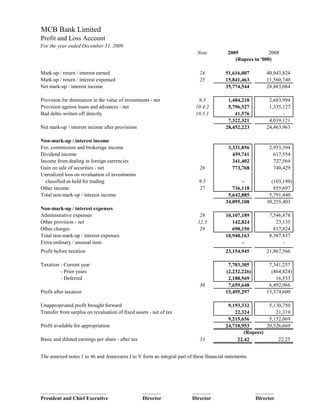
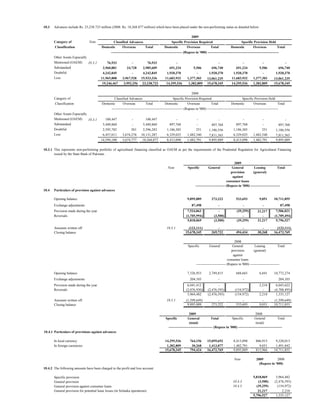
The document provides financial statements for MCB Bank Limited for the year ended December 31, 2009. It includes the balance sheet, profit and loss account, cash flow statement, statement of changes in equity, and statement of comprehensive income, along with accompanying notes. The balance sheet shows total assets of Rs. 509.2 billion and total liabilities of Rs. 439.5 billion. The profit and loss account reports a net profit after tax of Rs. 15.5 billion for 2009.


