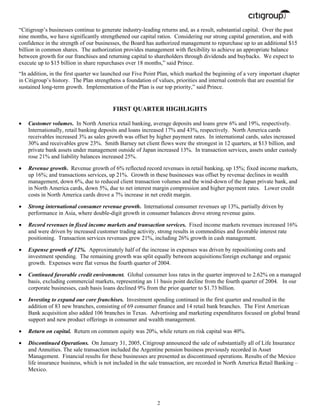
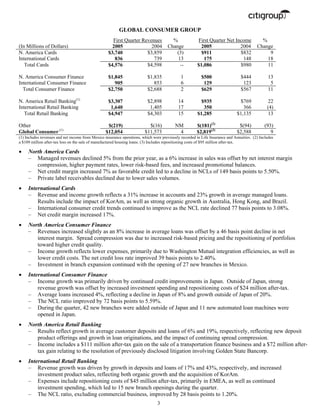
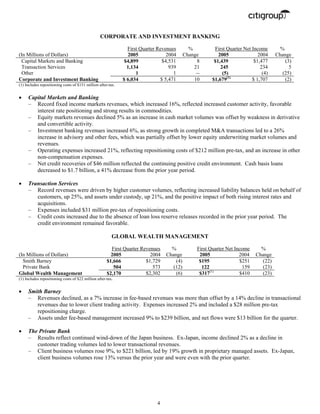
Citigroup reported record first quarter net income of $5.44 billion, up 3% from the same period last year. Revenue increased 6% to $21.5 billion. The Board authorized up to an additional $15 billion in share repurchases. Several business segments saw revenue and income increases, including Global Consumer and Corporate and Investment Banking. However, Global Wealth Management saw declines in revenue and income.
Citigroup reported second quarter net income of $5.07 billion, up from $1.14 billion in the same period last year. Revenue was $20.2 billion. Key highlights included growth in customer volumes across most business segments, strong growth in international consumer businesses, and record revenues in transaction services. However, capital markets revenues declined due to difficult market conditions. Expenses declined due to prior year charges, but increased due to investment spending and acquisitions. Credit quality remained stable.
Citigroup reported record earnings from continuing operations for the first quarter of 2006, with net income of $5.64 billion, up 4% from the previous year. International earnings grew 47% due to record international revenues increasing 19%. Several business segments saw record results, including corporate and investment banking with revenues up 21% and international revenues in that segment up 34%. The company opened 238 new branches during the quarter as it continued expanding its distribution internationally.
Citi reported record quarterly revenues of $25.5 billion, up 15%, and net income of $5.01 billion, down 10% from the prior year. Net income was reduced by an $871 million after-tax charge related to a structural expense review. Excluding this charge, net income was $5.88 billion, down 9% due to higher credit costs and a lower tax benefit. Revenues grew across most business segments, led by a 23% increase in Markets & Banking revenues. Credit costs increased $1.26 billion due to higher net losses and increases to loan loss reserves.
Citigroup reported a net loss of $8.29 billion for Q4 2008 and $18.72 billion for the full year. Revenues declined due to write-downs and losses in securities and banking from the economic downturn. Credit costs increased significantly due to higher net credit losses and additions to loan loss reserves across most business segments, especially in North America. Despite cost cutting measures, expenses remained elevated. However, Citigroup strengthened its capital and liquidity positions through initiatives like issuing preferred stock to the U.S. Treasury.
Citigroup reported quarterly financial results, with net income of $3.92 billion for 3Q 2002, a 23% increase over 3Q 2001. Core income, which excludes certain items, was $3.79 billion for 3Q 2002, up 17% from the prior year. Diluted earnings per share on net income were $0.76 for the quarter, rising 25% year-over-year, while diluted EPS on core income increased 19% to $0.74. Citigroup operates as a global financial services company with over 200 million customer accounts in more than 100 countries.
This document provides quarterly financial data for Citigroup, including:
1) Income statements for Citigroup's major business segments broken down by product and region, showing revenues, expenses, profits.
2) Key metrics for Citigroup as a whole, including revenues, income, earnings per share, assets, equity.
3) Specific data on performance of Citigroup's Global Consumer credit card business, including revenues, expenses, profits, and effects of securitization activities.
Citigroup reported record net income of $15.28 billion for 2002, an 8% increase over 2001. Net income per share also rose 8% to $2.94. Core income for the year was a record $13.65 billion, or $2.63 per share. However, fourth quarter net income declined 37% to $2.43 billion due to a $1.55 billion legal settlement charge. Core income fell 32% to $2.44 billion. Revenue grew 7% for the full year to $75.76 billion but was flat in the fourth quarter at $18.93 billion.
El Paso Corporation reported financial and operational results for the first quarter of 2006. Key highlights included:
- EBIT of $888 million, up significantly from $463 million in the first quarter of 2005.
- Pipelines segment EBIT of $478 million, up 16% year-over-year, driven by growth projects and acquisitions.
- Exploration and Production segment EBIT of $199 million, in line with prior year despite lower production volumes impacted by hurricanes.
- $1.3 billion in gross debt reduction year-to-date through asset sales and cash flow. Balance sheet metrics continue to improve.
- 130 Bcf of 2007 production hedged to provide
- Citi reported revenues of $24.8 billion for Q1 2009, nearly double the prior year level, driven by strong results in institutional clients. However, net income was $1.6 billion, with most other businesses negatively impacted by the difficult economic environment.
- Expenses declined 23% from Q1 2008 to $12.1 billion, due to ongoing cost cutting efforts. Credit costs increased 76% to $10.3 billion, as net credit losses and loan loss reserves rose, primarily in consumer banking and cards.
- While results improved from the prior year, most businesses still struggled due to the weak economy. Management remains focused on reducing risks and expenses to strengthen the franchise during a challenging period.
Citigroup reported financial results for the first quarter of 2006. Income from continuing operations increased 9% compared to the first quarter of 2005 to $5.6 billion. Global Consumer revenues decreased 1% to $12 billion, with U.S. Consumer revenues decreasing 9% due to declines in cards, retail distribution, and consumer lending. Corporate and Investment Banking revenues increased with Capital Markets and Banking revenues up 20% and Transaction Services up 22%. Overall, Citigroup revenues remained strong with continuing growth in international markets helping to offset declines in the U.S.
Bank Of America Fourth Quarter 2008 Resultsearningsreport
Bank of America reported a loss of $1.8 billion for the fourth quarter of 2008. The results were negatively impacted by $4.6 billion in capital markets dislocation charges and a $8.5 billion provision for credit losses, which included a $3 billion increase in loan loss reserves. Despite the loss, pre-provision profits were up in most primary businesses from the third quarter of 2008. Total average deposits grew by $34.3 billion since the prior quarter. The company also raised capital through a common equity offering and funds from the Troubled Asset Relief Program.
- Bank of America reported $4.2 billion in net income for Q1 2009, down from the previous quarter but up from the same period last year. Revenue was $36.1 billion, a record high.
- Results included Merrill Lynch revenues and expenses following the acquisition. Global Markets reported record results despite $1.7 billion in capital markets disruption charges.
- Mortgage banking income was $3.3 billion, up significantly year-over-year, driven by higher home loan production volumes from Countrywide and low interest rates.
PACCAR is a diversified, multinational company that manufactures heavy-duty trucks under brands like Kenworth, Peterbilt, DAF, and Foden. It competes in both the North American and European truck markets, and also provides financing and parts. In 2003, PACCAR achieved record profits and revenues due to strong product quality, geographic diversity, and innovative use of technology. It continues investing in new products, manufacturing improvements, and information systems to support its business and customers.
- KeyCorp reported a net loss of $488 million or $1.09 per share for Q1 2009, compared to net income of $218 million or $0.54 per share for Q1 2008. The loss was primarily due to an increase in loan loss provisions and an impairment charge for intangible assets.
- The loan loss provision increased to $875 million for Q1 2009, exceeding net charge-offs by $383 million. The allowance for loan losses increased to $2.186 billion or 2.97% of total loans.
- A non-cash impairment charge of $187 million was recorded for the National Banking reporting unit due to continued weakness in financial markets. This did not
- BB&T Corporation reported lower operating earnings for the fourth quarter of 2008 compared to the same period in 2007. Operating earnings available to common shareholders decreased 41.4% to $243 million.
- Net interest income increased 14.2% to $1,132 million due to higher interest income, but this was more than offset by a large increase in the provision for credit losses of $344 million.
- Returns and profitability ratios declined from the prior year, with the return on average common equity decreasing to 7.26% and the efficiency ratio worsening to 51.9%.
This document is BB&T Corporation's 2005 annual report. It provides financial highlights for 2005, noting that net income increased 6.1% to $1.654 billion and diluted earnings per share grew 7.1% to $3.00. Operating earnings rose 7.2% to $1.674 billion. Cash basis operating earnings, which exclude intangible assets and purchase accounting adjustments, increased 7.1% to $1.763 billion. The report discusses BB&T's strong loan, deposit and balance sheet growth in 2005 and notes the bank hired additional revenue producers and implemented strategies to boost organic account growth.
Capital Product Partners Fourth Quarter 2008 Earningsearningsreport
Capital Product Partners L.P. reported strong fourth quarter 2008 results with net income of $14.3 million and operating surplus of $17.4 million. They announced a non-recurring exceptional cash distribution of $1.05 per unit, returning profit sharing revenues earned in 2008. Despite a weak shipping market outlook, the company has long-term contracts with reputable counterparties and adequate financial reserves to weather uncertain market conditions.
Raytheon reported strong financial results for Q3 2006, with EPS up 41% and bookings of $6.1 billion. The company increased full-year 2006 guidance for EPS, bookings, operating cash flow and ROIC. Segments such as IDS, MS and RAC saw higher sales and improved operating performance compared to Q3 2005. Raytheon also provided initial guidance for 2007 with projected continued growth.
Dover Corporation reported financial results for the first quarter of 2006 with the following highlights:
- Revenue increased 22% to a record $1.67 billion compared to $1.37 billion in the prior year.
- Earnings from continuing operations increased 40% to $133.5 million or $0.65 per share from $95.4 million or $0.47 per share in the previous year.
- Net earnings were $203.8 million or $0.99 per share, which includes discontinued operations income of $70.3 million or $0.34 per share.
This document contains financial statements and sales data for Baxter International for the first quarter of 2006 compared to the first quarter of 2005. Specifically:
- Net sales increased 1% to $2.4 billion. Operating income grew 10% and income from continuing operations increased 26%.
- Sales of BioScience products grew 11% to $1 billion, with recombinant products and antibody therapies experiencing strong growth.
- Medication Delivery sales fell 6% to $916 million due to declines in infusion systems and anesthesia products.
- Renal sales declined slightly by 2% to $493 million, with growth in PD therapy offset by lower HD therapy sales.
Olympic Steel reported financial results for the first quarter of 2009 with a net loss of $25.5 million compared to net income of $13.2 million in the first quarter of 2008. Net sales decreased 48.8% to $140.9 million due to a 45.6% decrease in tons sold. The results were negatively impacted by a $30.6 million inventory write-down and weaker demand and pricing due to the economic downturn. The company expects results to improve as market conditions stabilize but approved a reduced quarterly dividend.
El Paso Corporation reported second quarter 2006 diluted EPS from continuing operations of $0.21, which included a $0.02 gain from production hedges. The company achieved $487 million in EBIT and $1.4 billion in cash flow from operations. El Paso reduced gross debt by $3 billion through July 2006 through strong cash flow and asset sales, bringing net debt down to $14.45 billion. The company made continued progress on legacy legal issues while pipelines, exploration and production, and other businesses performed well during the quarter.
Expeditors International of Washington, 1st06qerfinance39
Expeditors International of Washington, Inc. announced a 70% increase in net income for the first quarter of 2006 compared to the same period in 2005. Net revenues increased 28% while operating income increased 69%. The company saw increases in airfreight tonnage and new business which offset a marginal decrease in airfreight yields. Strong performance was achieved despite implementing a new accounting rule requiring stock options to be expensed.
This document provides Bank of America's financial results for the full year and fourth quarter of 2007. Some key points:
- Net income for 2007 was $15 billion, down 29% from 2006, driven by higher credit costs and losses from subprime exposures.
- Revenue declined 8% for the year due to lower noninterest income. Credit costs rose significantly.
- In the fourth quarter, the company reported a net profit of $268 million compared to a $5.3 billion profit in 2006, with losses from subprime exposures weighing heavily.
- Global Consumer & Small Business Banking saw lower profits for the year and quarter due to rising credit costs, particularly in credit cards.
Citigroup reported quarterly financial results for 4Q08. Net income decreased 16% to $8.3 billion compared to 4Q07. Total revenues decreased 13% to $5.6 billion due to declines in principal transactions and other revenue. The provision for loan losses increased 66% to $12.7 billion, reflecting higher net charge-offs. Total assets declined 11% to $1.9 trillion as trading account assets fell 29% and loans decreased 11%.
Raytheon reported strong financial results for the fourth quarter and full year 2006. Quarterly sales increased 12% to $5.7 billion due to growth at Integrated Defense Systems, Missile Systems, and Network Centric Systems. Earnings per share from continuing operations increased 27% to $0.65 for the quarter. For the full year, sales increased 7% to $20.3 billion and earnings per share from continuing operations increased 37% to $2.46. Raytheon also provided guidance for 2007, forecasting earnings per share from continuing operations between $2.85 to $3.00 on sales between $21.4 to $21.9 billion.
Microsoft Corporation reported financial results for the quarter and fiscal year ended June 30, 2004. Revenue increased 15% to $9.3 billion for the quarter and 14% to $36.8 billion for the fiscal year. Net income increased 82% to $2.7 billion for the quarter and 9% to $8.2 billion for the fiscal year. Earnings per share increased 79% to $0.25 for the quarter and 9% to $0.76 for the fiscal year. The company's largest segments by revenue were Client, Server and Tools, and Information Worker.
Microsoft had a strong fiscal year 2004 with 14% revenue growth to $36.8 billion. The company delivered many new products across its business lines. Microsoft plans to return $75 billion to shareholders over the next 4 years through dividends and stock buybacks. The company will continue to focus on integrated innovation across its businesses in areas like security, productivity software, business solutions, online services, mobile devices, and entertainment to drive future growth.
1) Fiscal 2006 was a year of significant achievement and transformation for Microsoft, with record revenue and operating income. Microsoft launched several major new products and services and made strategic acquisitions.
2) Microsoft realigned its organizational structure into three divisions and announced leadership changes to ensure strong leadership for future innovation and growth.
3) Microsoft remains focused on research and development, investing over $6.6 billion to develop new products and technologies that will help drive future growth in key business areas and new markets.
Citigroup updated its second quarter 2005 financial disclosure to reflect discontinued operations from the sale of its asset management business and other changes. Significant changes included classifying the asset management business as discontinued operations, moving the Mexico asset management and Latin America retirement services lines to different segments, adjusting cards purchase sales and accounts definitions, combining private bank client asset lines, and repositioning the consolidated financial statements. The financial supplement provides segment income statements and other financial details reflecting these changes.
This document is Microsoft Corporation's Form 10-K annual report filed with the Securities and Exchange Commission for the fiscal year ended June 30, 2002. It includes an index and four parts: Part I discusses Microsoft's business including products such as Windows, Office, Xbox, MSN services and more. Part II covers items like financial data and market risk. Part III incorporates the proxy statement with items like directors and executive compensation. Part IV lists exhibits and other filing details.
The document summarizes Microsoft's fiscal year 2002 performance. It discusses strong revenue growth despite economic challenges. Key products like Windows XP and Office saw strong demand. It highlights plans to launch new products in the coming year and increase R&D spending. Trustworthy Computing and building a reliable environment is emphasized as a top priority going forward.
This document is Google Inc.'s Form 10-Q quarterly report filed with the SEC for the quarter ended June 30, 2005. The summary includes:
1) Google reported revenues of $1.38 billion for the quarter, up from $700 million in the same quarter last year. Net income was $342.8 million compared to $79.1 million last year.
2) Costs and expenses increased to $908.8 million from $529.3 million due primarily to increases in costs of revenues, research and development, sales and marketing, and general and administrative expenses.
3) Cash provided by operating activities was $1.15 billion, and cash and marketable securities totaled
Microsoft had a very successful fiscal year 2007, with revenue reaching $51.12 billion, a 15% increase over 2006. Operating income totaled $18.52 billion, up $2.05 billion from the previous year. The company saw strong sales of new versions of Windows Vista and Microsoft Office 2007. Microsoft also made its largest acquisition ever, purchasing digital marketing company aQuantive for $6 billion to strengthen its online advertising platform. Looking ahead, Microsoft aims to build on its success by expanding into new markets like consumer technology and cloud-based services.
Insider trading regulations in the US and Turkey are summarized and compared. The US has the most comprehensive regulations including Section 16, Rule 10b-5 (classical and misappropriation theories), and Rule 14e-3. Turkey's only specific regulation is in the Capital Markets Law. Differences include the US focus on fiduciary duty breaches while Turkey views it as public fraud. Proposals for Turkey include clarifying materiality in laws, allowing cases without profit/loss, and adopting rules similar to bounties and Regulation FD.
- Microsoft's 2003 annual report discusses its focus on innovation, customers, and realizing full potential through technology. It details Microsoft's investments in research and development to create integrated solutions for businesses and consumers.
- The report outlines Microsoft's business plan to strengthen its platform through breakthrough innovation, responsiveness to customers, support for developers, simple experiences and services, enthusiasm for the brand, and building its talent pool. It provides examples of new products that deliver on this vision like Windows Server 2003 and Windows XP Tablet PC Edition.
citigroup January 13, 2006 - Reformatted Quarterly Financial Data Supplement ...QuarterlyEarningsReports
Citigroup announced a reorganization of its Global Consumer Group, reorganizing North America Cards, Consumer Finance, and Retail Banking. It provided a reformatted quarterly financial data supplement reflecting the changes. The changes included moving Mexico consumer results from North America to International, and reorganizing U.S. consumer operations into U.S. Cards, Retail Distribution, Consumer Lending, and Commercial Business. The document included descriptions of each new U.S. consumer business and a diagram mapping the old and new disclosure structures.
- Yahoo reported Q3 2008 revenue of $1.786 billion, up 1% year-over-year. Revenue excluding traffic acquisition costs was $1.325 billion, down 2% quarter-over-quarter.
- Operating cash flow for Q3 2008 was $410 million, down 12% year-over-year and 4% quarter-over-quarter. Operating cash flow as a percentage of revenue excluding TAC was 31%.
- Free cash flow for Q3 2008 was $231 million, down from $647 million in Q1 2008. Cash and marketable securities totaled $3.299 billion at the end of Q3 2008.
Microsoft's revenue grew 16% in 2000, 10% in 2001, and 12% in 2002. Revenue growth in 2002 was led by Xbox and Windows XP sales. Revenue growth in 2001 was driven by Windows 2000 and .NET servers. Revenue growth in 2000 was driven by Windows 2000, Windows NT, Office 2000, and SQL Server. Operating expenses increased in 2002 due to Xbox costs and legal fees, in 2001 due to marketing and headcount costs, and in 2000 due to marketing and headcount costs.
This document summarizes Microsoft's accounting policies and procedures. It discusses how the company prepares its financial statements according to generally accepted accounting principles in the US. It also describes Microsoft's policies for revenue recognition, cost of revenue, research and development costs, advertising costs, income taxes, financial instruments, and use of derivatives.
- Microsoft's 2003 annual report discusses its focus on innovation, customers, and realizing full potential through technology. It details Microsoft's investments in research and development to create integrated solutions for businesses and consumers.
- The report outlines Microsoft's business plan to strengthen its platform through breakthrough innovation, responsiveness to customers, support for developers, simple experiences and services, enthusiasm for the brand, and building its talent pool. It provides examples of new products that deliver on this strategy.
This document is Microsoft Corporation's annual report on Form 10-K for the fiscal year ended June 30, 2004 filed with the US Securities and Exchange Commission. It provides an overview of Microsoft's business segments and their products. The segments are Client, Server and Tools, Information Worker, Microsoft Business Solutions, MSN, Mobile and Embedded Devices, and Home and Entertainment. For each segment, the document describes the related products, markets, and revenue sources.
Yahoo's 1998 annual report highlights how the company connects people through shared interests and experiences online. It describes a few examples of how Yahoo users reconnected with an old friend in an auction and how a father found instructions on tying a bowtie for his son's wedding using Yahoo's search. The report discusses how Yahoo users can shop, buy, and sell globally on Yahoo's comprehensive platform. It emphasizes Yahoo's independence and vision for continuing to evolve and pioneer new ways to enhance users' online experiences as internet usage grows.
This document is Microsoft Corporation's annual report (Form 10-K) filed with the SEC for the fiscal year ended June 30, 2007. It provides information on Microsoft's business operations, operating segments, products, competition, and financial statements. The main points are:
- Microsoft has five operating segments: Client, Server and Tools, Online Services Business, Microsoft Business Division, and Entertainment and Devices Division.
- The Client segment includes Windows operating systems for personal computers. Server and Tools develops software server products and services. Online Services Business provides online services like search and portals.
- Microsoft faces strong competition across its business segments from companies offering alternative software platforms, online offerings, and devices.
- Financial
Citigroup reported fourth quarter net income of $6.93 billion and EPS of $1.37. Income from continuing operations was $4.97 billion with EPS of $0.98. Revenues were $20.78 billion. Strong customer volume growth drove double digit revenue increases in several areas. However, a challenging interest rate environment and competitive pricing partially offset this. The company continued expanding its distribution network globally.
Citigroup reported a 60% decline in third quarter net income to $2.21 billion compared to the prior year. Revenues increased 5% to $22.4 billion driven by 29% growth in international revenues, however this was more than offset by a $2.98 billion increase in credit costs. The revenue growth was primarily due to strong international consumer and wealth management results, while fixed income revenues declined significantly due to losses related to dislocations in the mortgage-backed securities and credit markets. Higher credit costs were the primary driver of the net income decline.
This document provides quarterly financial data for Citigroup, including:
1) Income statements for Citigroup's major business segments by both product view and regional view, showing income from continuing operations for 2003 and 2002.
2) Key financial metrics for Citigroup such as revenues, assets, capital ratios, and earnings per share for 2003 and 2002.
3) Supplementary financial details including statements of income, financial position, loan delinquency and more for Citigroup.
The document contains detailed quarterly performance information for Citigroup to allow analysis of results and trends by major business and geographic segments.
Citi reported a $5.1 billion net loss for Q1 2008, driven by write-downs in fixed income due to sub-prime exposures and losses in highly leveraged finance. Revenues fell 48% to $13.2 billion due to these losses, though transaction services grew 42% and wealth management grew 16%. Credit costs increased $3 billion as consumer delinquencies rose in the weakening US economy. Management is taking actions to strengthen the balance sheet through capital raises and divestitures of non-core assets.
Citigroup reported financial results for the 4th quarter of 2008. Net income decreased 16% to a loss of $8.3 billion compared to a loss of $9.8 billion in 4th quarter 2007. Total revenues declined 13% to $5.6 billion. The provision for loan losses increased 66% to $12.7 billion due to higher credit costs. Total assets decreased 11% to $1.9 trillion and book value per share declined 35% to $14.70.
Citigroup reported a net loss of $5.1 billion for the first quarter of 2008, compared to net income of $5 billion for the first quarter of 2007. Revenues declined 48% to $13.2 billion for the quarter. The global consumer business reported a net income of $1.4 billion, down 45% from the prior year, with the U.S. consumer business reporting net income of $279 million, down 84%. Markets and Banking reported a net loss of $5.7 billion for the quarter compared to net income of $2.7 billion in the prior year.
Citi reported a $9.83 billion net loss for Q4 2007, driven by $18.1 billion in write-downs on subprime exposures and a $4.1 billion increase in credit costs for US consumer loans. For the full year, Citi earned $3.62 billion in net income on $81.7 billion in revenues. While most business segments saw strong revenue growth, losses were concentrated in fixed income markets and US consumer lending due to deteriorating credit quality. Citi outlined steps to strengthen its capital position and improve risk management in response to the poor results.
Citigroup reported financial results for the third quarter of 2008. Net income decreased significantly compared to the third quarter of 2007, dropping from $2.2 billion to a $2.8 billion loss. Total revenues declined 23% versus the prior year. The provision for loan losses increased 86% to $9.1 billion due to higher credit costs. Expenses rose modestly while assets and loans declined year-over-year. Overall, Citigroup experienced weak results across business segments as the financial crisis impacted performance.
- Bank of America reported second quarter 2006 results, with net income of $5.58 billion excluding merger charges, up 4% from the second quarter of 2005.
- The Global Consumer & Small Business Bank saw strong growth, with net income up 42% to $3.11 billion driven by increases in cards and deposits.
- The Global Corporate & Investment Bank reported net income of $1.72 billion, flat compared to the second quarter of 2005.
Citigroup reported financial results for the second quarter of 2007. Net income increased 18% year-over-year to $6.226 billion. Revenue grew across most business segments, led by a 64% increase in Markets & Banking revenue. Income from continuing operations rose 18% to $11.238 billion for the first half of the year. However, capital ratios declined slightly due to asset growth outpacing capital increases. Overall, Citigroup achieved strong revenue growth and higher profits compared to the previous year.
Citigroup reported financial results for the first quarter of 2007, with the following highlights:
- Net income decreased 11% to $5.012 billion compared to $5.639 billion in the first quarter of 2006.
- Revenues increased 15% to $25.459 billion from $22.183 billion, driven by growth in Markets & Banking and Global Consumer segments.
- Markets & Banking revenues increased 23% to $8.957 billion, while Global Consumer revenues grew 10% to $13.106 billion.
- Results were impacted by a $871 million after-tax restructuring charge related to expense reduction initiatives.
Citigroup reported financial results for the third quarter of 2007. Net income was $2.2 billion, down 60% from the third quarter of 2006. Total assets reached $2.36 trillion at the end of the quarter, up 35% year-over-year. However, key capital ratios such as Tier 1 capital and leverage declined compared to the prior year. Earnings per share from continuing operations were $0.44, down 58% from the previous year. While several business segments saw revenue declines, Global Consumer revenues remained strong, particularly in U.S. Cards.
El Paso Corporation reported financial and operational results for the first quarter of 2006. Key highlights included:
- EBIT of $888 million, up significantly from $463 million in the first quarter of 2005.
- Pipelines segment EBIT of $478 million, up 16% year-over-year, driven by growth projects and acquisitions.
- Exploration and Production segment EBIT of $199 million, in line with prior year despite lower production volumes impacted by hurricanes.
- $1.3 billion in gross debt reduction year-to-date through asset sales and cash flow. Balance sheet metrics continue to improve.
- 130 Bcf of 2007 production hedged to provide
Bank of America reported third quarter 2005 results with the following key points:
1) Diluted EPS was up 12% year-over-year but down 4% quarter-over-quarter due to higher credit costs and lower securities gains.
2) Revenue grew 16% year-over-year and 4% quarter-over-quarter driven by strong growth across all business segments.
3) Credit costs increased from very low levels in previous quarters as charge-offs moved off recent lows.
Citigroup reported its quarterly financial results. Total income from continuing operations increased 12% compared to the second quarter of 2002 to $4.3 billion. Revenues increased across most business segments, with Global Consumer up 18% and Global Corporate and Investment Bank up 2%. The Global Consumer segment saw strong growth in retail banking revenues of 63%. Total assets increased to $1.187 trillion in the second quarter of 2003, up from $1.083 trillion in the second quarter of 2002.
- Bank of America reported third quarter 2006 results with total revenue of $18.961 billion, an 11% increase from third quarter 2005, and net income of $5.416 billion, a 20% increase.
- Net interest income was $8.894 billion, a 1% increase, impacted by the sale of Brazilian operations and prior year FAS 133 impact. Noninterest income increased 20% to $10.067 billion.
- Global Consumer & Small Business Banking reported net income of $2.889 billion, a 13% increase, driven by increases in cards, deposits, and debit purchase volume.
This document provides quarterly financial data for Citigroup, including income statements, balance sheets, ratios, and other metrics. Some key details:
- For Q3 2003, income from continuing operations was $4.691 billion, up 27% from Q3 2002. Net income was $4.691 billion, up 20% from a year ago.
- Capital ratios like Tier 1 and Total Capital were all above requirements at the end of Q3 2003, with Tier 1 at 9.5% and Total Capital at 12.6%.
- Total assets increased to over $1.208 trillion in Q3 2003, up 17% from a year ago. Stockholders' equity rose
- Morgan Stanley Dean Witter reported net income of $1.075 billion for Q1 2001, down 30% from $1.544 billion in Q1 2000. Diluted earnings per share were $0.94, down 30% from $1.34 in Q1 2000.
- Revenues decreased 14% to $6.385 billion due to difficult markets negatively impacting several businesses, though fixed income and equity trading performed well.
- Return on equity was 23% and the company remains focused on reducing expenses while maintaining client services in challenging market conditions.
El Paso Corporation reported second quarter 2006 earnings of $0.21 per diluted share from continuing operations. Key highlights included $3 billion in gross debt reduction through July 31, year-to-date capital expenditures of $1.024 billion, and continued strong operating cash flow of $1.421 billion for the first half of 2006. The company's pipelines business continued to outperform while exploration and production achieved a second consecutive quarter of organic production growth.
Bank of America reported a loss of $1.8 billion for Q4 2008. This was due to capital markets dislocation charges of $4.6 billion and a $8.5 billion provision for credit losses, which included a $3 billion increase in loan loss reserves. Despite the loss, pre-provision profits were up in most primary businesses from Q3 2008. Total average deposits grew by $34.3 billion. The company also raised common equity and received capital from the TARP program. Credit costs were higher due to the deteriorating economy and rising unemployment.
Similar to citigroup April 15, 2005 - First Quarter Press Release (20)
Citibanking North America reported a 14% increase in total revenues and a 92% increase in core income for Q1 2000 compared to Q1 1999. Key drivers included an 86% increase in core income before taxes due to higher non-interest revenue and lower loan loss provisions. Average loans declined 5% while average deposits grew 5%. Asset quality improved with delinquencies and net credit losses declining.
Citigroup reported record earnings for the first quarter of 2000, with core income rising 49% to $3.6 billion compared to the same period last year. Several of Citigroup's business lines saw double-digit earnings growth, including Global Consumer (up 23%), Global Corporate and Investment Bank (up 36%), and Global Investment Management (up 26%). Strong performance across all regions and business segments was driven by favorable global market conditions. Return on equity was 30% and the company repurchased $1.2 billion in stock during the quarter.
Citigroup reported financial results for the second quarter of 2000. Core income increased 21% compared to the second quarter of 1999 to $3.007 billion. Total revenues for the quarter were $16.373 billion, a 10% increase year-over-year. Most of Citigroup's business segments saw revenue and core income growth compared to the previous year. Global Consumer revenues were $7.473 billion, up 6% from the second quarter of 1999. Global Corporate and Investment Bank revenues were $7.855 billion, a 13% increase. Citigroup's preliminary Tier 1 capital ratio was 8.6% for the second quarter of 2000.
This document provides quarterly financial data for Citigroup, including:
- Consolidated financial summaries showing metrics like core income, net income, earnings per share, capital ratios, assets, and returns on equity.
- Segment net revenues and core income broken down by Citigroup's main business segments - Global Consumer, Global Corporate and Investment Bank, and Global Investment Management.
- More detailed financial results for the major businesses within Global Consumer like North America Cards, Mortgage Banking, and International.
- Supplemental financial details including consolidated statements of income, earnings analysis, loan delinquency amounts, and insurance investment portfolio information.
The document contains quarterly and year-to-
Citigroup reported strong financial results for the second quarter and first half of 2000. Core income rose 21% to $3.0 billion for the second quarter and 35% to $6.6 billion for the first half of the year. All of Citigroup's major business segments experienced double-digit income growth, led by the Global Consumer Group and Global Corporate and Investment Bank. Citigroup continued making acquisitions and investments to expand its global businesses and presence on the internet. Chairman and CEO Sanford Weill stated the results demonstrated the impact of the company's market share gains and consistent growth across its businesses.
Citigroup reported its third quarter 2000 financial results. Key highlights include:
- Core income for 3Q 2000 was $3.11 billion, up 27% from 3Q 1999. Year-to-date core income through 3Q 2000 was $9.72 billion, up 32% from the same period in 1999.
- Net income for 3Q 2000 was $3.088 billion, up 27% from 3Q 1999. Year-to-date net income through 3Q 2000 was $9.683 billion, up 34% from the same period in 1999.
- Basic earnings per share for core income in 3Q 2000 was $0.69, up 28% from 3Q 1999.
- Citigroup reported quarterly financial results for 3Q 2000, with net income of $3.088 billion, up 27% from 3Q 1999. Core income was $3.111 billion for the quarter, also up 27% year-over-year.
- Total revenues for Citigroup's Global Consumer segment were $7.515 billion in 3Q 2000, up 5% from 3Q 1999. The Global Corporate and Investment Bank segment reported revenues of $8.097 billion, a 26% increase.
- Total assets reached $805 billion in 3Q 2000, up from $686.8 billion in 3Q 1999. Book value per share increased to $11.55 from $9
Citigroup reported strong third quarter results for 2000, with core income rising 27% to $3.1 billion compared to the third quarter of 1999. Key highlights included:
- Global Consumer core income rose 17% to $1.32 billion, driven by growth in North American cards, mortgage banking, and Asia.
- Global Corporate and Investment Bank core income increased 40% to $1.59 billion, with strong performances from Salomon Smith Barney and emerging markets banking.
- Global Investment Management and Private Banking core income grew 14% to $176 million, with increased revenues across asset management, private banking, and retirement services.
Citigroup reported its quarterly financial results. Some key highlights:
- Core income for Q4 2000 was $3.331 billion, up 11% from Q4 1999.
- Net income for Q4 2000 was $2.84 billion, down 6% from Q4 1999 due to restructuring charges.
- Global Consumer segment revenues grew 9% to $10.243 billion in Q4 2000.
- Global Corporates and Institutions segment revenues grew 16% to $8.464 billion in Q4 2000.
Citigroup reported strong 4th quarter and full-year 2000 earnings. 4th quarter core income was $3.33 billion, an 11% increase, and full-year core income was a record $14.14 billion, up 25%. All of Citigroup's major business segments saw growth in the 4th quarter, led by the Global Consumer Group at 25% growth. For the full year, net income was $13.52 billion. Chairman and CEO Sanford Weill cited the company's global strength and leadership across business lines. Citigroup continued investments in growing markets and internet capabilities.
Citigroup reported its quarterly financial results. Core income decreased 7% from the prior year quarter to $3.66 billion. Total revenues declined across most business segments, with the exception of the Global Consumer segment which increased revenues slightly. Overall, Citigroup saw lower earnings due to weaker market conditions impacting its trading and investment banking businesses. Capital ratios and credit quality metrics remained strong however, positioning Citigroup well despite the challenging environment.
Citigroup reported its financial results for the first quarter of 2001. Net income decreased 8% compared to the first quarter of 2000. Core income, which excludes restructuring and accounting items, decreased 7%. Within its Global Consumer segment, Banking/Lending revenues increased 14% driven by growth in North America Cards, CitiFinancial, and Mortgage Banking. Core income for Banking/Lending increased 21% led by gains in North America Cards, CitiFinancial, and Citibanking North America. Overall, Citigroup's Global Consumer business saw revenues increase 10% and core income rise 18% compared to the first quarter of the prior year.
Citigroup reported core income of $3.66 billion for Q1 2001, a 7% decrease from Q1 2000. Excluding investment activities, core income rose 7% year-over-year. Global Consumer saw core income increase 18% to $1.78 billion driven by growth in US banking and lending. Global Corporate core income declined 7% to $1.75 billion due to weaker investment markets, though revenues grew 11%. Overall, Citigroup achieved solid results despite challenging markets due to the strength and diversity of its businesses.
Citigroup, the largest global financial services company, reported quarterly financial results. Core income decreased 7% year-over-year to $3.66 billion, while net income decreased 8% to $3.54 billion. Revenues increased 6% to $21.05 billion driven by strong growth in North America Cards, Corporate Finance, and emerging markets. Citibanking North America revenues increased 6% to $613 million with core income before taxes up 24% to $271 million.
Citigroup reported its financial results for the first quarter of 2001. Net income decreased 8% compared to the first quarter of 2000. Core income, which excludes restructuring and accounting items, decreased 7%. Within Global Consumer, Banking/Lending revenues increased 14% driven by growth in North America Cards, CitiFinancial, and Mortgage Banking. Core income for Banking/Lending increased 21% led by gains in North America Cards, CitiFinancial, and Citibanking North America.
Citigroup reported a 13% increase in core income to $3.79 billion for Q2 2001 compared to Q2 2000. Revenue grew 8% to $20.3 billion led by 12% growth in the Global Consumer segment. Core EPS grew 14% to $0.74 per share. Several business segments saw strong growth including 40% growth for CitiFinancial, 17% for North America Cards, and 18% for the Private Bank. Despite difficult market conditions, Corporate Finance delivered 12% earnings growth through increased market share.
Citigroup reported quarterly financial data for 3Q 2001. Some key highlights:
- Core income was $3.262 billion for 3Q 2001, down 8% from 3Q 2000. Year-to-date core income was $10.707 billion, down 1% from the same period in 2000.
- Total revenues for 3Q 2001 were $20.294 billion, up 5% from 3Q 2000. Year-to-date total revenues were $61.656 billion, up 6% from the same period in 2000.
- Global Consumer revenues grew 19% to $11.661 billion in 3Q 2001, driven by strength in North America Cards and Banking/L
Citigroup reported financial results for the third quarter of 2001. Citigroup is a global financial services company with operations in over 100 countries. Some key highlights:
- Core income for 3Q 2001 was $3.26 billion, down 8% from 3Q 2000. Year-to-date core income was $10.7 billion, down 1% from the same period in 2000.
- Total revenues for Global Consumer operations were $11.66 billion for 3Q 2001, up 19% from 3Q 2000, driven by growth in North America Cards and Mortgage Banking.
- Revenues for Global Corporate were $8.01 billion for 3Q 2001, down 5% from 3
Citigroup reported third quarter core income of $3.26 billion, down 7% from the prior year due to $700 million in losses from the September 11th attacks. Revenue grew 5% to $20.29 billion while expenses declined 2%. The diversification of Citigroup's businesses allowed growth in many areas, including a 45% increase in CitiFinancial income and a 25% rise in Citibanking income, despite challenges in the market environment from the attacks. Sanford Weill, CEO, expressed confidence that Citigroup would deliver 15% earnings growth in the fourth quarter assuming a stable market.
Citigroup reported its quarterly financial results. Net income for 4Q 2001 was $3.875 billion, up 36% from 4Q 2000. Core income, which excludes certain items, was $3.862 billion for 4Q 2001, up 16% from the prior year. Total revenues for Global Consumer increased 20% to $11.207 billion compared to 4Q 2000, driven by growth in North America Cards, Citibanking North America, and Mortgage Banking. Revenues for Global Corporate were relatively flat compared to the prior year.
how to sell pi coins effectively (from 50 - 100k pi)DOT TECH
Anywhere in the world, including Africa, America, and Europe, you can sell Pi Network Coins online and receive cash through online payment options.
Pi has not yet been launched on any exchange because we are currently using the confined Mainnet. The planned launch date for Pi is June 28, 2026.
Reselling to investors who want to hold until the mainnet launch in 2026 is currently the sole way to sell.
Consequently, right now. All you need to do is select the right pi network provider.
Who is a pi merchant?
An individual who buys coins from miners on the pi network and resells them to investors hoping to hang onto them until the mainnet is launched is known as a pi merchant.
debuts.
I'll provide you the what'sapp number.
+12349014282
Abhay Bhutada, the Managing Director of Poonawalla Fincorp Limited, is an accomplished leader with over 15 years of experience in commercial and retail lending. A Qualified Chartered Accountant, he has been pivotal in leveraging technology to enhance financial services. Starting his career at Bank of India, he later founded TAB Capital Limited and co-founded Poonawalla Finance Private Limited, emphasizing digital lending. Under his leadership, Poonawalla Fincorp achieved a 'AAA' credit rating, integrating acquisitions and emphasizing corporate governance. Actively involved in industry forums and CSR initiatives, Abhay has been recognized with awards like "Young Entrepreneur of India 2017" and "40 under 40 Most Influential Leader for 2020-21." Personally, he values mindfulness, enjoys gardening, yoga, and sees every day as an opportunity for growth and improvement.
Lecture slide titled Fraud Risk Mitigation, Webinar Lecture Delivered at the Society for West African Internal Audit Practitioners (SWAIAP) on Wednesday, November 8, 2023.
STREETONOMICS: Exploring the Uncharted Territories of Informal Markets throug...sameer shah
Delve into the world of STREETONOMICS, where a team of 7 enthusiasts embarks on a journey to understand unorganized markets. By engaging with a coffee street vendor and crafting questionnaires, this project uncovers valuable insights into consumer behavior and market dynamics in informal settings."
Seminar: Gender Board Diversity through Ownership NetworksGRAPE
Seminar on gender diversity spillovers through ownership networks at FAME|GRAPE. Presenting novel research. Studies in economics and management using econometrics methods.
where can I find a legit pi merchant onlineDOT TECH
Yes. This is very easy what you need is a recommendation from someone who has successfully traded pi coins before with a merchant.
Who is a pi merchant?
A pi merchant is someone who buys pi network coins and resell them to Investors looking forward to hold thousands of pi coins before the open mainnet.
I will leave the what'sapp contact of my personal pi merchant to trade with
+12349014282
Independent Study - College of Wooster Research (2023-2024) FDI, Culture, Glo...AntoniaOwensDetwiler
"Does Foreign Direct Investment Negatively Affect Preservation of Culture in the Global South? Case Studies in Thailand and Cambodia."
Do elements of globalization, such as Foreign Direct Investment (FDI), negatively affect the ability of countries in the Global South to preserve their culture? This research aims to answer this question by employing a cross-sectional comparative case study analysis utilizing methods of difference. Thailand and Cambodia are compared as they are in the same region and have a similar culture. The metric of difference between Thailand and Cambodia is their ability to preserve their culture. This ability is operationalized by their respective attitudes towards FDI; Thailand imposes stringent regulations and limitations on FDI while Cambodia does not hesitate to accept most FDI and imposes fewer limitations. The evidence from this study suggests that FDI from globally influential countries with high gross domestic products (GDPs) (e.g. China, U.S.) challenges the ability of countries with lower GDPs (e.g. Cambodia) to protect their culture. Furthermore, the ability, or lack thereof, of the receiving countries to protect their culture is amplified by the existence and implementation of restrictive FDI policies imposed by their governments.
My study abroad in Bali, Indonesia, inspired this research topic as I noticed how globalization is changing the culture of its people. I learned their language and way of life which helped me understand the beauty and importance of cultural preservation. I believe we could all benefit from learning new perspectives as they could help us ideate solutions to contemporary issues and empathize with others.
5 Tips for Creating Standard Financial ReportsEasyReports
Well-crafted financial reports serve as vital tools for decision-making and transparency within an organization. By following the undermentioned tips, you can create standardized financial reports that effectively communicate your company's financial health and performance to stakeholders.
What price will pi network be listed on exchangesDOT TECH
The rate at which pi will be listed is practically unknown. But due to speculations surrounding it the predicted rate is tends to be from 30$ — 50$.
So if you are interested in selling your pi network coins at a high rate tho. Or you can't wait till the mainnet launch in 2026. You can easily trade your pi coins with a merchant.
A merchant is someone who buys pi coins from miners and resell them to Investors looking forward to hold massive quantities till mainnet launch.
I will leave the what's app number of my personal pi vendor to trade with.
+12349014282
2. Elemental Economics - Mineral demand.pdfNeal Brewster
After this second you should be able to: Explain the main determinants of demand for any mineral product, and their relative importance; recognise and explain how demand for any product is likely to change with economic activity; recognise and explain the roles of technology and relative prices in influencing demand; be able to explain the differences between the rates of growth of demand for different products.
citigroup April 15, 2005 - First Quarter Press Release
1. FIRST QUARTER NET INCOME INCREASES 3% TO A RECORD $5.44 BILLION
FIRST QUARTER EPS INCREASES 3% TO A RECORD $1.04
INCOME FROM CONTINUING OPERATIONS INCREASES 3% TO $5.17 BILLION
EPS FROM CONTINUING OPERATIONS INCREASES 3% TO $0.99
REVENUES INCREASE 6% TO $21.5 BILLION
BOARD AUTHORIZES UP TO ADDITIONAL $15 BILLION IN SHARE REPURCHASES
New York, NY, April 15, 2005 — Citigroup Inc. (NYSE:C) today reported record net income for the first quarter of 2005
of $5.44 billion, or $1.04 per share, both increasing 3% from the first quarter of 2004. Income from continuing operations
was $5.17 billion, or $0.99 per share, both increasing 3% from the first quarter of 2004. Income from continuing
operations excludes the results of substantially all of Life Insurance and Annuities and the Argentine pension business,
which are subject to a pending sale transaction.
First quarter results include a $272 million after-tax charge for repositioning costs, comprised of $151 million in
Corporate and Investment Banking, $95 million in Global Consumer, $22 million in Global Wealth Management and $4
million in Asset Management. Results also include a $109 million after-tax loss on the sale of manufactured housing
loans, a $111 million after-tax gain on the sale of a transportation finance business and a $72 million after-tax gain
relating to the resolution of previously disclosed litigation involving Golden State Bancorp.
The Board of Directors of Citigroup has authorized management to repurchase up to an additional $15 billion of its
common stock. Combined with a remaining authorization of $1.3 billion, the total authorization is $16.3 billion.
First Quarter Revenues % First Quarter Net Income %
Citigroup Segment Results
(In Millions of Dollars) 2004 Change 2004 Change
2005 2005
Global Consumer $11,573 4 $2,588 9
$12,054 $2,819
Corporate and Investment Banking 5,471 10 1,707 (2)
6,034 1,679
Global Wealth Management 2,302 (6) 410 (23)
2,170 317
Asset Management 461 (10) 105 (25)
413 79
Alternative Investments 180 NM 26 NM
866 362
Corporate/Other 295 NM 188 NM
(4) (88)
Results from Continuing Operations 20,282 6 5,024 3
21,533 5,168
Discontinued Operations (1) 249 10
273
$20,282 6 $5,273 3
Total Citigroup $21,533 $5,441
(1) Comprised of substantially all of Life Insurance and Annuities and the Argentine pension business, which collectively are subject to a sale agreement.
“We are proud of our record global earnings, driven by the strength and diversity of our global franchises. As we have
seen in prior quarters, weakness in certain products or regions was more than offset by strength in others. We achieved
strong growth in customer balances, which helped to offset the impact of spread compression from rising short-term rates.
Our fixed income and transaction services businesses performed exceptionally well, both achieving record revenues. Our
results also include the impact of repositioning costs, which reflect expense discipline and ongoing consolidation activities
to improve operating efficiencies,” said Charles Prince, Chief Executive Officer of Citigroup.
“Our focus on disciplined capital allocation led to the announced sale of substantially all of Life Insurance and Annuities
and the sale of a portfolio of manufactured housing loans. We continued to allocate resources to expand our growth
franchises through branch expansion, advertising, technology and people. We closed the acquisition of First American
Bank, providing an important presence in the attractive Texas retail banking market. All of these actions reflect a
sharpened focus on Citigroup’s long-term growth franchises and a rigorous approach to the use of shareholders’ capital,”
said Prince.
2. “Citigroup’s businesses continue to generate industry-leading returns and, as a result, substantial capital. Over the past
nine months, we have significantly strengthened our capital ratios. Considering our strong capital generation, and with
confidence in the strength of our businesses, the Board has authorized management to repurchase up to an additional $15
billion in common shares. The authorization provides management with flexibility to achieve an appropriate balance
between growth for our franchises and returning capital to shareholders through dividends and buybacks. We expect to
execute up to $15 billion in share repurchases over 18 months,” said Prince.
“In addition, in the first quarter we launched our Five Point Plan, which marked the beginning of a very important chapter
in Citigroup’s history. The Plan strengthens a foundation of values, priorities and internal controls that are essential for
sustained long-term growth. Implementation of the Plan is our top priority,” said Prince.
FIRST QUARTER HIGHLIGHTS
• Customer volumes. In North America retail banking, average deposits and loans grew 6% and 19%, respectively.
Internationally, retail banking deposits and loans increased 17% and 43%, respectively. North America cards
receivables increased 3% as sales growth was offset by higher payment rates. In international cards, sales increased
30% and receivables grew 23%. Smith Barney net client flows were the strongest in 12 quarters, at $13 billion, and
private bank assets under management outside of Japan increased 13%. In transaction services, assets under custody
rose 21% and liability balances increased 25%.
• Revenue growth. Revenue growth of 6% reflected record revenues in retail banking, up 15%; fixed income markets,
up 16%; and transactions services, up 21%. Growth in these businesses was offset by revenue declines in wealth
management, down 6%, due to reduced client transaction volumes and the wind-down of the Japan private bank, and
in North America cards, down 5%, due to net interest margin compression and higher payment rates. Lower credit
costs in North America cards drove a 7% increase in net credit margin.
• Strong international consumer revenue growth. International consumer revenues up 13%, partially driven by
performance in Asia, where double-digit growth in consumer balances drove strong revenue gains.
• Record revenues in fixed income markets and transaction services. Fixed income markets revenues increased 16%
and were driven by increased customer trading activity, strong results in commodities and favorable interest rate
positioning. Transaction services revenues grew 21%, including 26% growth in cash management.
• Expense growth of 12%. Approximately half of the increase in expenses was driven by repositioning costs and
investment spending. The remaining growth was split equally between acquisitions/foreign exchange and organic
growth. Expenses were flat versus the fourth quarter of 2004.
• Continued favorable credit environment. Global consumer loss rates in the quarter improved to 2.62% on a managed
basis, excluding commercial markets, representing an 11 basis point decline from the fourth quarter of 2004. In our
corporate businesses, cash basis loans declined 9% from the prior quarter to $1.73 billion.
• Investing to expand our core franchises. Investment spending continued in the first quarter and resulted in the
addition of 83 new branches, consisting of 69 consumer finance and 14 retail bank branches. The First American
Bank acquisition also added 106 branches in Texas. Advertising and marketing expenditures focused on global brand
support and new product offerings in consumer and wealth management.
• Return on capital. Return on common equity was 20%, while return on risk capital was 40%.
• Discontinued Operations. On January 31, 2005, Citigroup announced the sale of substantially all of Life Insurance
and Annuities. The sale transaction included the Argentine pension business previously recorded in Asset
Management. Financial results for these businesses are presented as discontinued operations. Results of the Mexico
life insurance business, which is not included in the sale transaction, are recorded in North America Retail Banking –
Mexico.
2
3. GLOBAL CONSUMER GROUP
First Quarter Revenues % First Quarter Net Income %
(In Millions of Dollars) 2005 2004 Change 2005 2004 Change
N. America Cards $3,859 (3) $832 9
$3,740 $911
International Cards 739 13 148 18
836 175
Total Cards $4,598 -- $980 11
$4,576 $1,086
N. America Consumer Finance $1,835 1 $444 13
$1,845 $500
International Consumer Finance 853 6 123 5
905 129
Total Consumer Finance $2,688 2 $567 11
$2,750 $629
N. America Retail Banking(1) $2,898 14 $769 22
$3,307 $935
International Retail Banking 1,405 17 366 (4)
1,640 350
Total Retail Banking $4,303 15 $1,135 13
$4,947 $1,285
$(181)(2)
Other $(16) NM $(94) (93)
$(219)
Global Consumer (1) $2,819(3)
$11,573 4 $2,588 9
$12,054
(1) Includes revenues and net income from Mexico insurance operations, which were previously recorded in Life Insurance and Annuities. (2) Includes
a $109 million after-tax loss on the sale of manufactured housing loans. (3) Includes repositioning costs of $95 million after-tax.
• North America Cards
– Managed revenues declined 5% from the prior year, as a 6% increase in sales was offset by net interest margin
compression, higher payment rates, lower risk-based fees, and increased promotional balances.
– Net credit margin increased 7% as favorable credit led to a decline in NCLs of 149 basis points to 5.50%.
– Private label receivables declined due to lower sales volumes.
• International Cards
– Revenue and income growth reflects a 31% increase in accounts and 23% growth in average managed loans.
Results include the impact of KorAm, as well as strong organic growth in Australia, Hong Kong, and Brazil.
– International consumer credit trends continued to improve as the NCL rate declined 77 basis points to 3.08%.
– Net credit margin increased 17%.
• North America Consumer Finance
– Revenues increased slightly as an 8% increase in average loans was offset by a 46 basis point decline in net
interest margin. Spread compression was due to increased risk-based pricing and the repositioning of portfolios
toward higher credit quality.
– Income growth reflects lower expenses, primarily due to Washington Mutual integration efficiencies, as well as
lower credit costs. The net credit loss rate improved 39 basis points to 2.40%.
– Investment in branch expansion continued with the opening of 27 new branches in Mexico.
• International Consumer Finance
– Income growth was primarily driven by continued credit improvements in Japan. Outside of Japan, strong
revenue growth was offset by increased investment spending and repositioning costs of $24 million after-tax.
– Average loans increased 4%, reflecting a decline in Japan of 8% and growth outside of Japan of 20%.
– The NCL ratio improved by 72 basis points to 5.59%.
– During the quarter, 42 new branches were added outside of Japan and 11 new automated loan machines were
opened in Japan.
• North America Retail Banking
– Results reflect growth in average customer deposits and loans of 6% and 19%, respectively, reflecting new deposit
product offerings and growth in loan originations, and the impact of continuing spread compression.
– Income includes a $111 million after-tax gain on the sale of a transportation finance business and a $72 million after-
tax gain relating to the resolution of previously disclosed litigation involving Golden State Bancorp.
• International Retail Banking
– Revenue growth was driven by growth in deposits and loans of 17% and 43%, respectively, and increased
investment product sales, reflecting both organic growth and the acquisition of KorAm.
– Expenses include repositioning costs of $45 million after-tax, primarily in EMEA, as well as continued
investment spending, which led to 15 new branch openings during the quarter.
– The NCL ratio, excluding commercial business, improved by 28 basis points to 1.20%.
3
4. CORPORATE AND INVESTMENT BANKING
First Quarter Revenues % First Quarter Net Income %
(In Millions of Dollars) 2005 2004 Change 2005 2004 Change
Capital Markets and Banking $4,531 8 $1,477 (3)
$4,899 $1,439
Transaction Services 939 21 234 5
1,134 245
Other 1 -- (4) (25)
1 (5)
$1,679(1)
$ 5,471 10 $ 1,707 (2)
Corporate and Investment Banking $ 6,034
(1) Includes repositioning costs of $151 million after-tax.
• Capital Markets and Banking
– Record fixed income markets revenues, which increased 16%, reflected increased customer activity, favorable
interest rate positioning and strong results in commodities.
– Equity markets revenues declined 5% as an increase in cash market volumes was offset by weakness in derivative
and convertible activity.
– Investment banking revenues increased 6%, as strong growth in completed M&A transactions led to a 26%
increase in advisory and other fees, which was partially offset by lower equity underwriting market volumes and
revenues.
– Operating expenses increased 21%, reflecting repositioning costs of $212 million pre-tax, and an increase in other
non-compensation expenses.
– Net credit recoveries of $46 million reflected the continuing positive credit environment. Cash basis loans
decreased to $1.7 billion, a 41% decrease from the prior year period.
• Transaction Services
– Record revenues were driven by higher customer volumes, reflecting increased liability balances held on behalf of
customers, up 25%, and assets under custody, up 21%, and the positive impact of both rising interest rates and
acquisitions.
– Expenses included $31 million pre-tax of repositioning costs.
– Credit costs increased due to the absence of loan loss reserve releases recorded in the prior year period. The
credit environment remained favorable.
GLOBAL WEALTH MANAGEMENT
First Quarter Revenues % First Quarter Net Income %
(In Millions of Dollars) 2005 2004 Change 2005 2004 Change
Smith Barney $1,729 (4) $251 (22)
$1,666 $195
Private Bank 573 (12) 159 (23)
504 122
$317(1)
$2,302 (6) $410 (23)
Global Wealth Management $2,170
(1) Includes repositioning costs of $22 million after-tax.
• Smith Barney
– Revenues declined, as a 7% increase in fee-based revenues was more than offset by a 14% decline in transactional
revenues due to lower client trading activity. Expenses increased 2% and included a $28 million pre-tax
repositioning charge.
– Assets under fee-based management increased 9% to $239 billion, and net flows were $13 billion for the quarter.
• The Private Bank
– Results reflect continued wind-down of the Japan business. Ex-Japan, income declined 2% as a decline in
customer trading volumes led to lower transactional revenues.
– Client business volumes rose 9%, to $221 billion, led by 19% growth in proprietary managed assets. Ex-Japan,
client business volumes rose 13% versus the prior year and were even with the prior quarter.
4
5. ASSET MANAGEMENT
ALTERNATIVE INVESTMENTS
First Quarter Revenues % First Quarter Net Income %
(In Millions of Dollars) 2005 2004 Change 2005 2004 Change
$79(1)
$461 (10) $105 (25)
Asset Management $413
$180 NM $26 NM
Alternative Investments $866 $ 362
(1) Includes repositioning costs of $4 million after-tax.
• Asset Management
– Revenues and income declined due to a reduction in customer activity and increased expenses. AUMs declined
3% from the first quarter of 2004, to $460 billion, primarily reflecting the termination of a contract to manage $37
billion of assets for St. Paul Travelers, which was partially offset by positive net flows of $19 billion and
increased market valuations.
– Net inflows during the quarter were $12 billion.
• Alternative Investments (formerly Proprietary Investment Activities)
– Income of $362 million primarily reflects positive mark-to-market valuations in private equity portfolios.
CORPORATE/OTHER
Corporate/Other declined to a loss of $88 million. Results in the first quarter of 2004 included a $180 million after-tax
gain on the sale of the electronic funds services business.
DISCONTINUED OPERATIONS
On January 31, 2005, Citigroup announced the sale of Travelers Life & Annuity, including substantially all international
insurance businesses. The sale transaction also includes the Argentine pension business, which was previously recorded
in Asset Management. Results for all of the businesses included in the sale transaction are recorded as discontinued
operations and are presented below.
First Quarter Net Income %
(In Millions of Dollars) 2005 2004 Change
$249 10
Discontinued Operations $273
5
6. INTERNATIONAL OPERATIONS*
First Quarter
Net Income %
(In Millions of Dollars) 2005 2004 Change
Consumer……………………………………………………………………... $203 28
$260
Corporate………………………………….…………..……………………… 94 (12)
83
Wealth Management………………………………………………………….. 16 (19)
13
Asset Management……………………………..…………………………….. 26 (35)
17
$339 10
Mexico $373
Consumer……………………………………………………………………... $204 (41)
$120
Corporate………………………………….…………..……………………… 264 (29)
188
Wealth Management………………………………………………………….. 9 NM
(1)
Asset Management……………………………..………………….…………. (1) (100)
(2)
$ 476 (36)
Europe, Middle East and Africa (EMEA) $ 305
Consumer……………………………………………………………………... $ 142 23
$ 175
Corporate………………………………….…………..……………………… 93 (48)
48
Wealth Management………………………………………………………….. 26 NM
(8)
Asset Management………………………….………..………………………. 2 NM
(1)
$ 263 (19)
Japan $ 214
Consumer……………………………………………………………………... $ 247 26
$ 311
Corporate………………………………….…………..……………………… 308 5
322
Wealth Management………………………………………………………….. 35 --
35
Asset Management…………………………………...………………………. 2 100
4
$ 592 14
Asia (excluding Japan) $ 672
Consumer……………………………………………………………………... $ 44 9
$ 48
Corporate………………………………….…………..……………………… 202 (28)
145
Wealth Management………………………………………………………….. 10 (30)
7
Asset Management……………………………….…..………………………. 11 --
11
$ 267 (21)
Latin America $ 211
$ 1,937 (8)
Total International from Continuing Operations $ 1,775
*International results for the quarter are fully reflected in the product disclosures.
• Mexico
– Income growth in the consumer business reflects growth in customer deposits and loans, as well as improved
spreads in retail banking.
– Corporate income declined due to lower sales and trading results, which were only partially offset by revenue and
income growth in corporate banking and transaction services. Favorable credit conditions led to lower credit
costs.
• Europe, Middle East and Africa
– Consumer results reflect revenue growth driven by increased customer balances, which was offset by
repositioning costs of $66 million after-tax.
– Corporate income declined as strong growth in transaction services was offset by repositioning costs of $90
million after-tax.
Japan
•
– Consumer income increased primarily due to lower credit costs in consumer finance.
– Corporate income declined as reduced customer transaction volumes and lower volatility led to weaker sales and
trading results.
– Wealth Management results reflect the continued wind-down of the private bank operations.
6
7. Asia
•
– Consumer income rose strongly, with continued double-digit revenue and income growth across cards, retail
banking, and consumer finance reflecting both organic growth and the acquisition of KorAm. During the quarter,
branches increased by 35, consisting of 28 consumer finance and 7 retail banking branches.
– Corporate income reflects strong growth in transaction services and fixed income markets, which was partially
offset by lower income from equity underwriting and trading.
• Latin America
– Consumer results reflect continued growth in consumer finance and cards receivables and a favorable credit
environment.
– Corporate income declined as strong growth in transaction services revenues was more than offset by the impact
of lower corporate banking results.
Citigroup (NYSE: C), the leading global financial services company, has some 200 million customer accounts and does business in more than 100 countries, providing
consumers, corporations, governments and institutions with a broad range of financial products and services, including consumer banking and credit, corporate and
investment banking, insurance, securities brokerage, and asset management. Major brand names under Citigroup’s trademark red umbrella include Citibank,
CitiFinancial, Primerica, Smith Barney, Banamex, and Travelers Life and Annuity. Additional information may be found at www.citigroup.com.
A financial summary follows. Additional financial, statistical and business-related information, as well as business and segment trends, is included in a Financial
Supplement. Both the earnings release and the Financial Supplement are available on Citigroup’s web site at www.citigroup.com.
Certain statements in this document are “forward-looking statements” within the meaning of the Private Securities Litigation Reform Act. These statements are based
on management’s current expectations and are subject to uncertainty and changes in circumstances. Actual results may differ materially from those included in these
statements due to a variety of factors. More information about these factors is contained in Citigroup’s filings with the Securities and Exchange Commission.
Contacts:
Press: Leah Johnson (212) 559-9446 Equity Investors: Arthur Tildesley (212) 559-2718
Shannon Bell (212) 793-6206 Fixed Income Investors: John Randel (212) 559-5091
7