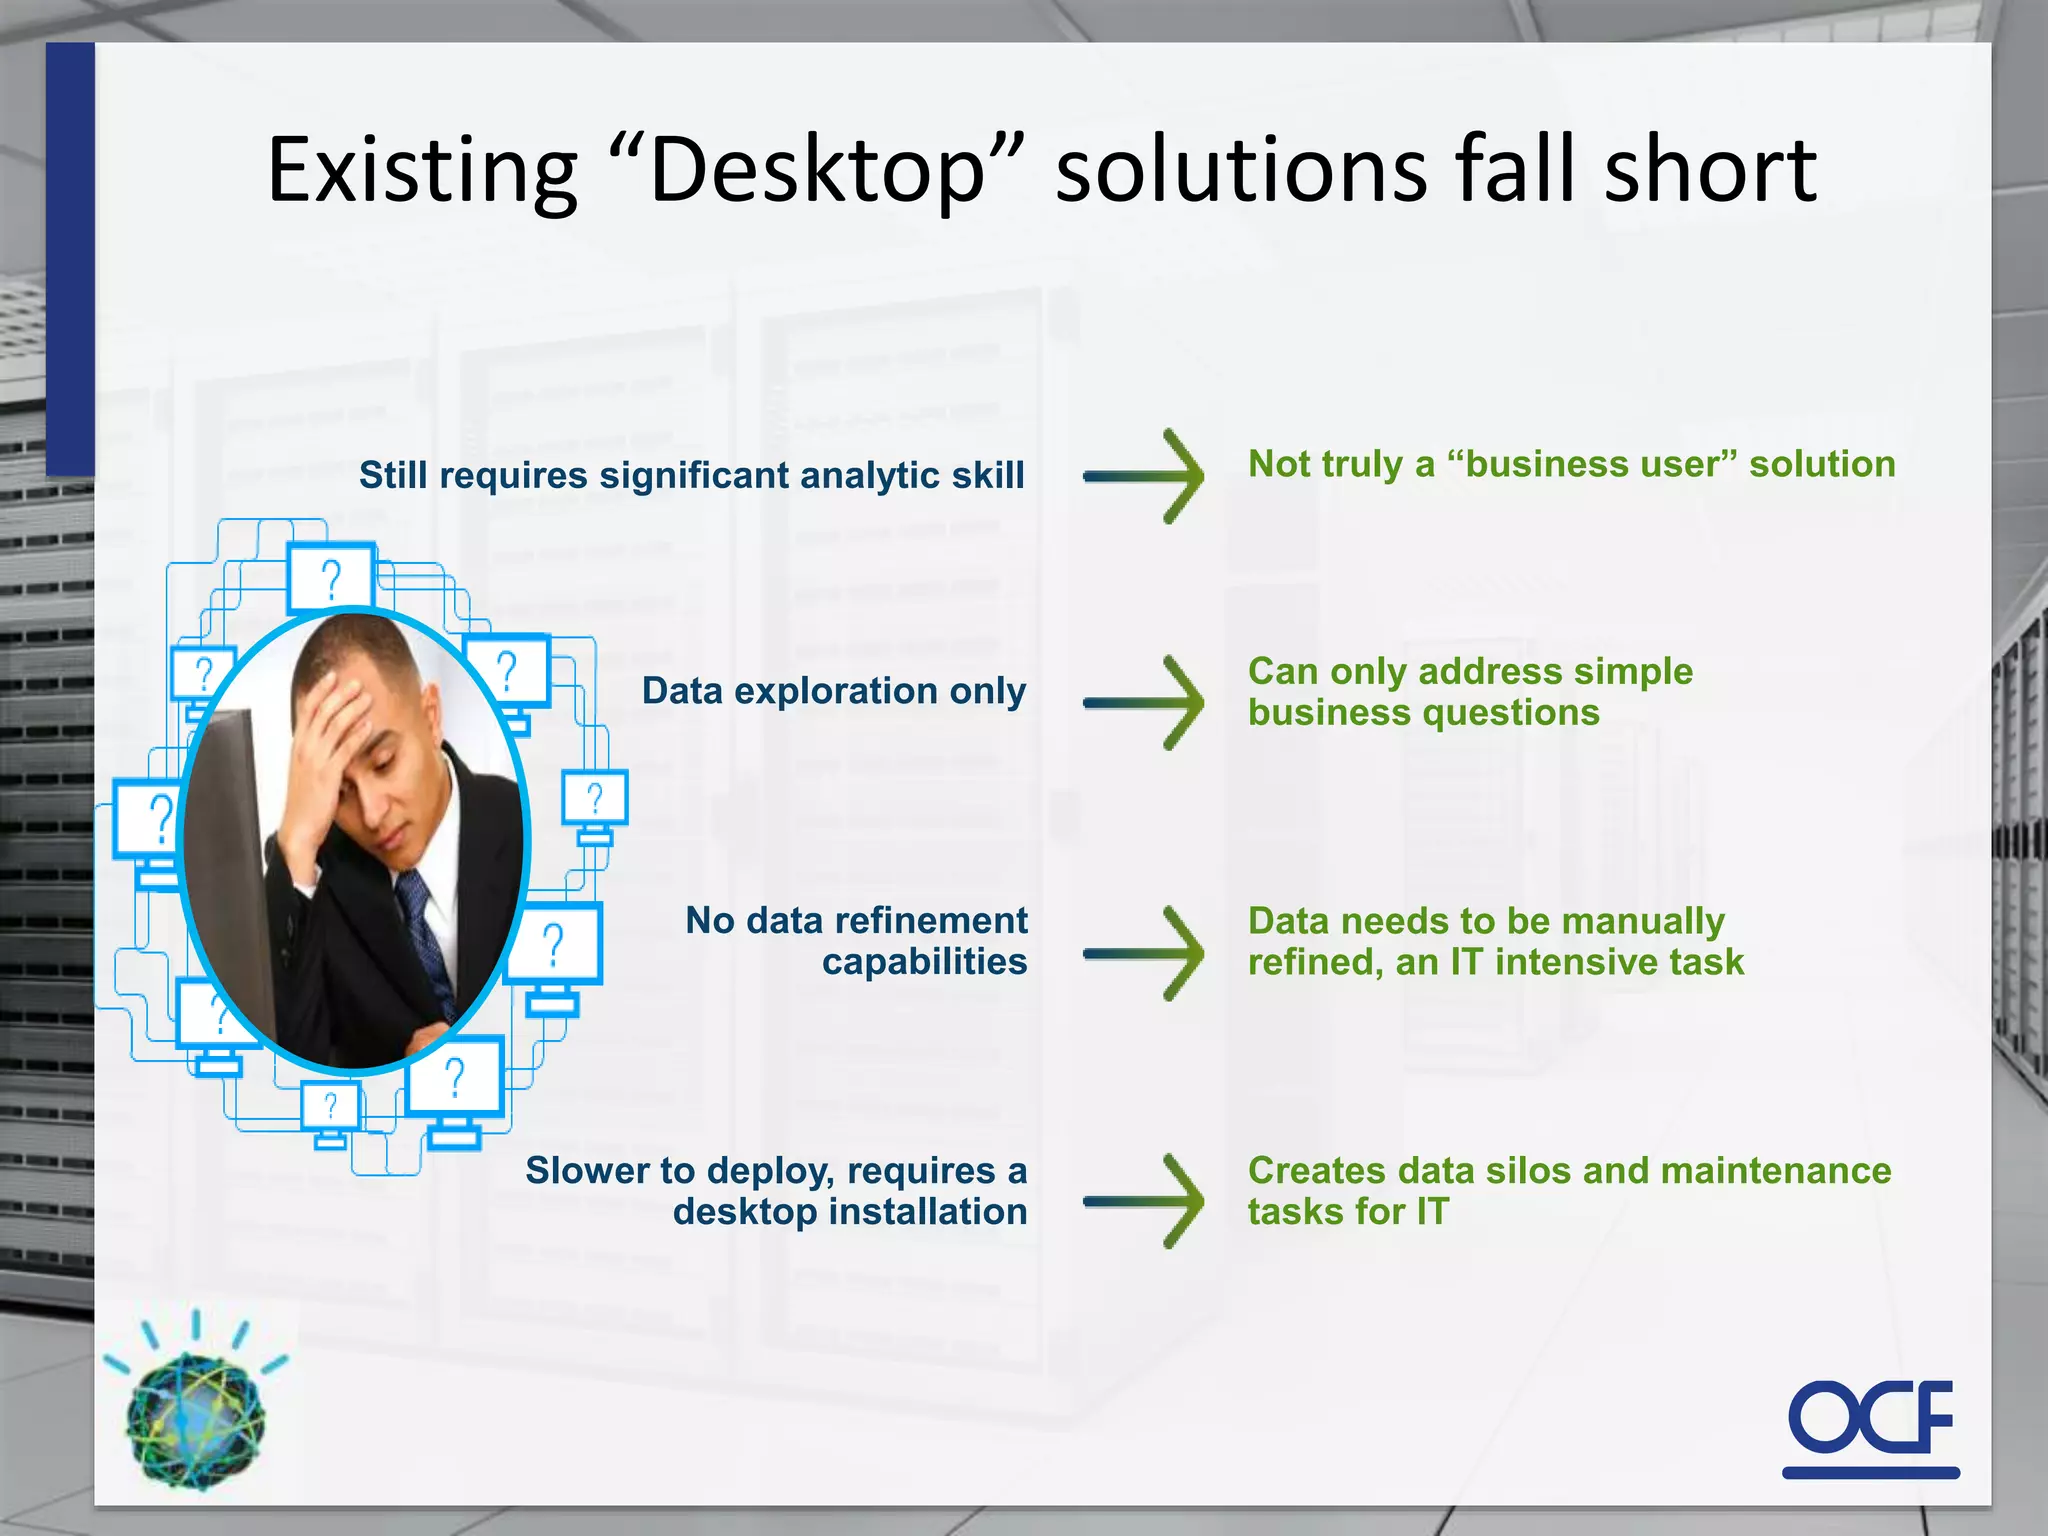
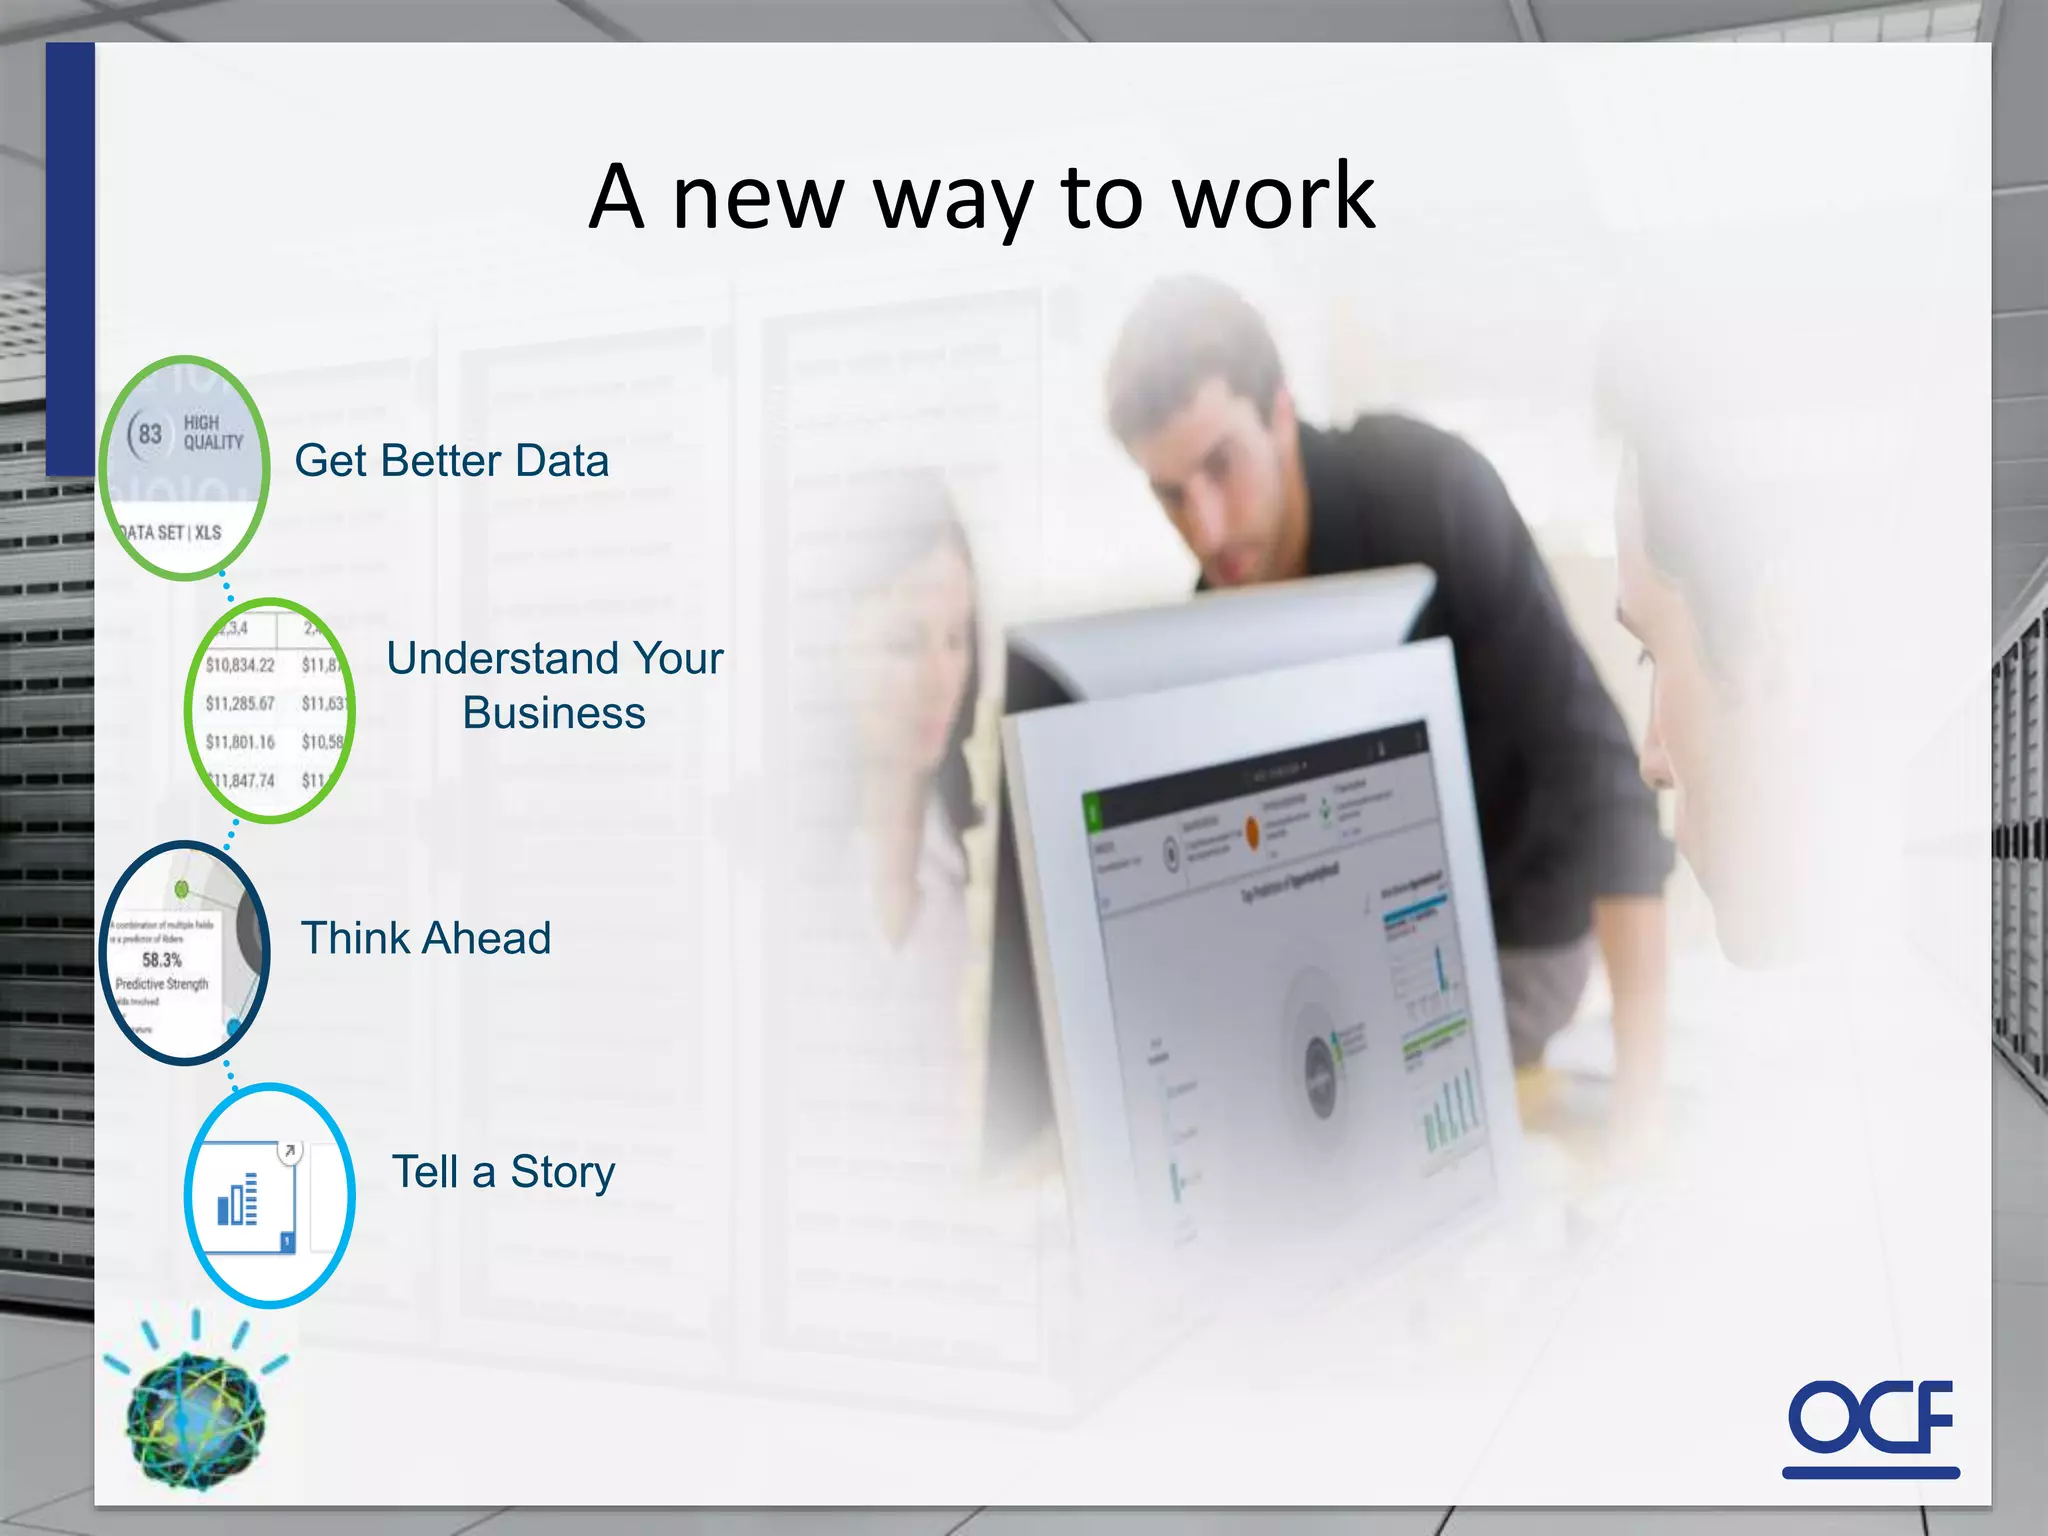
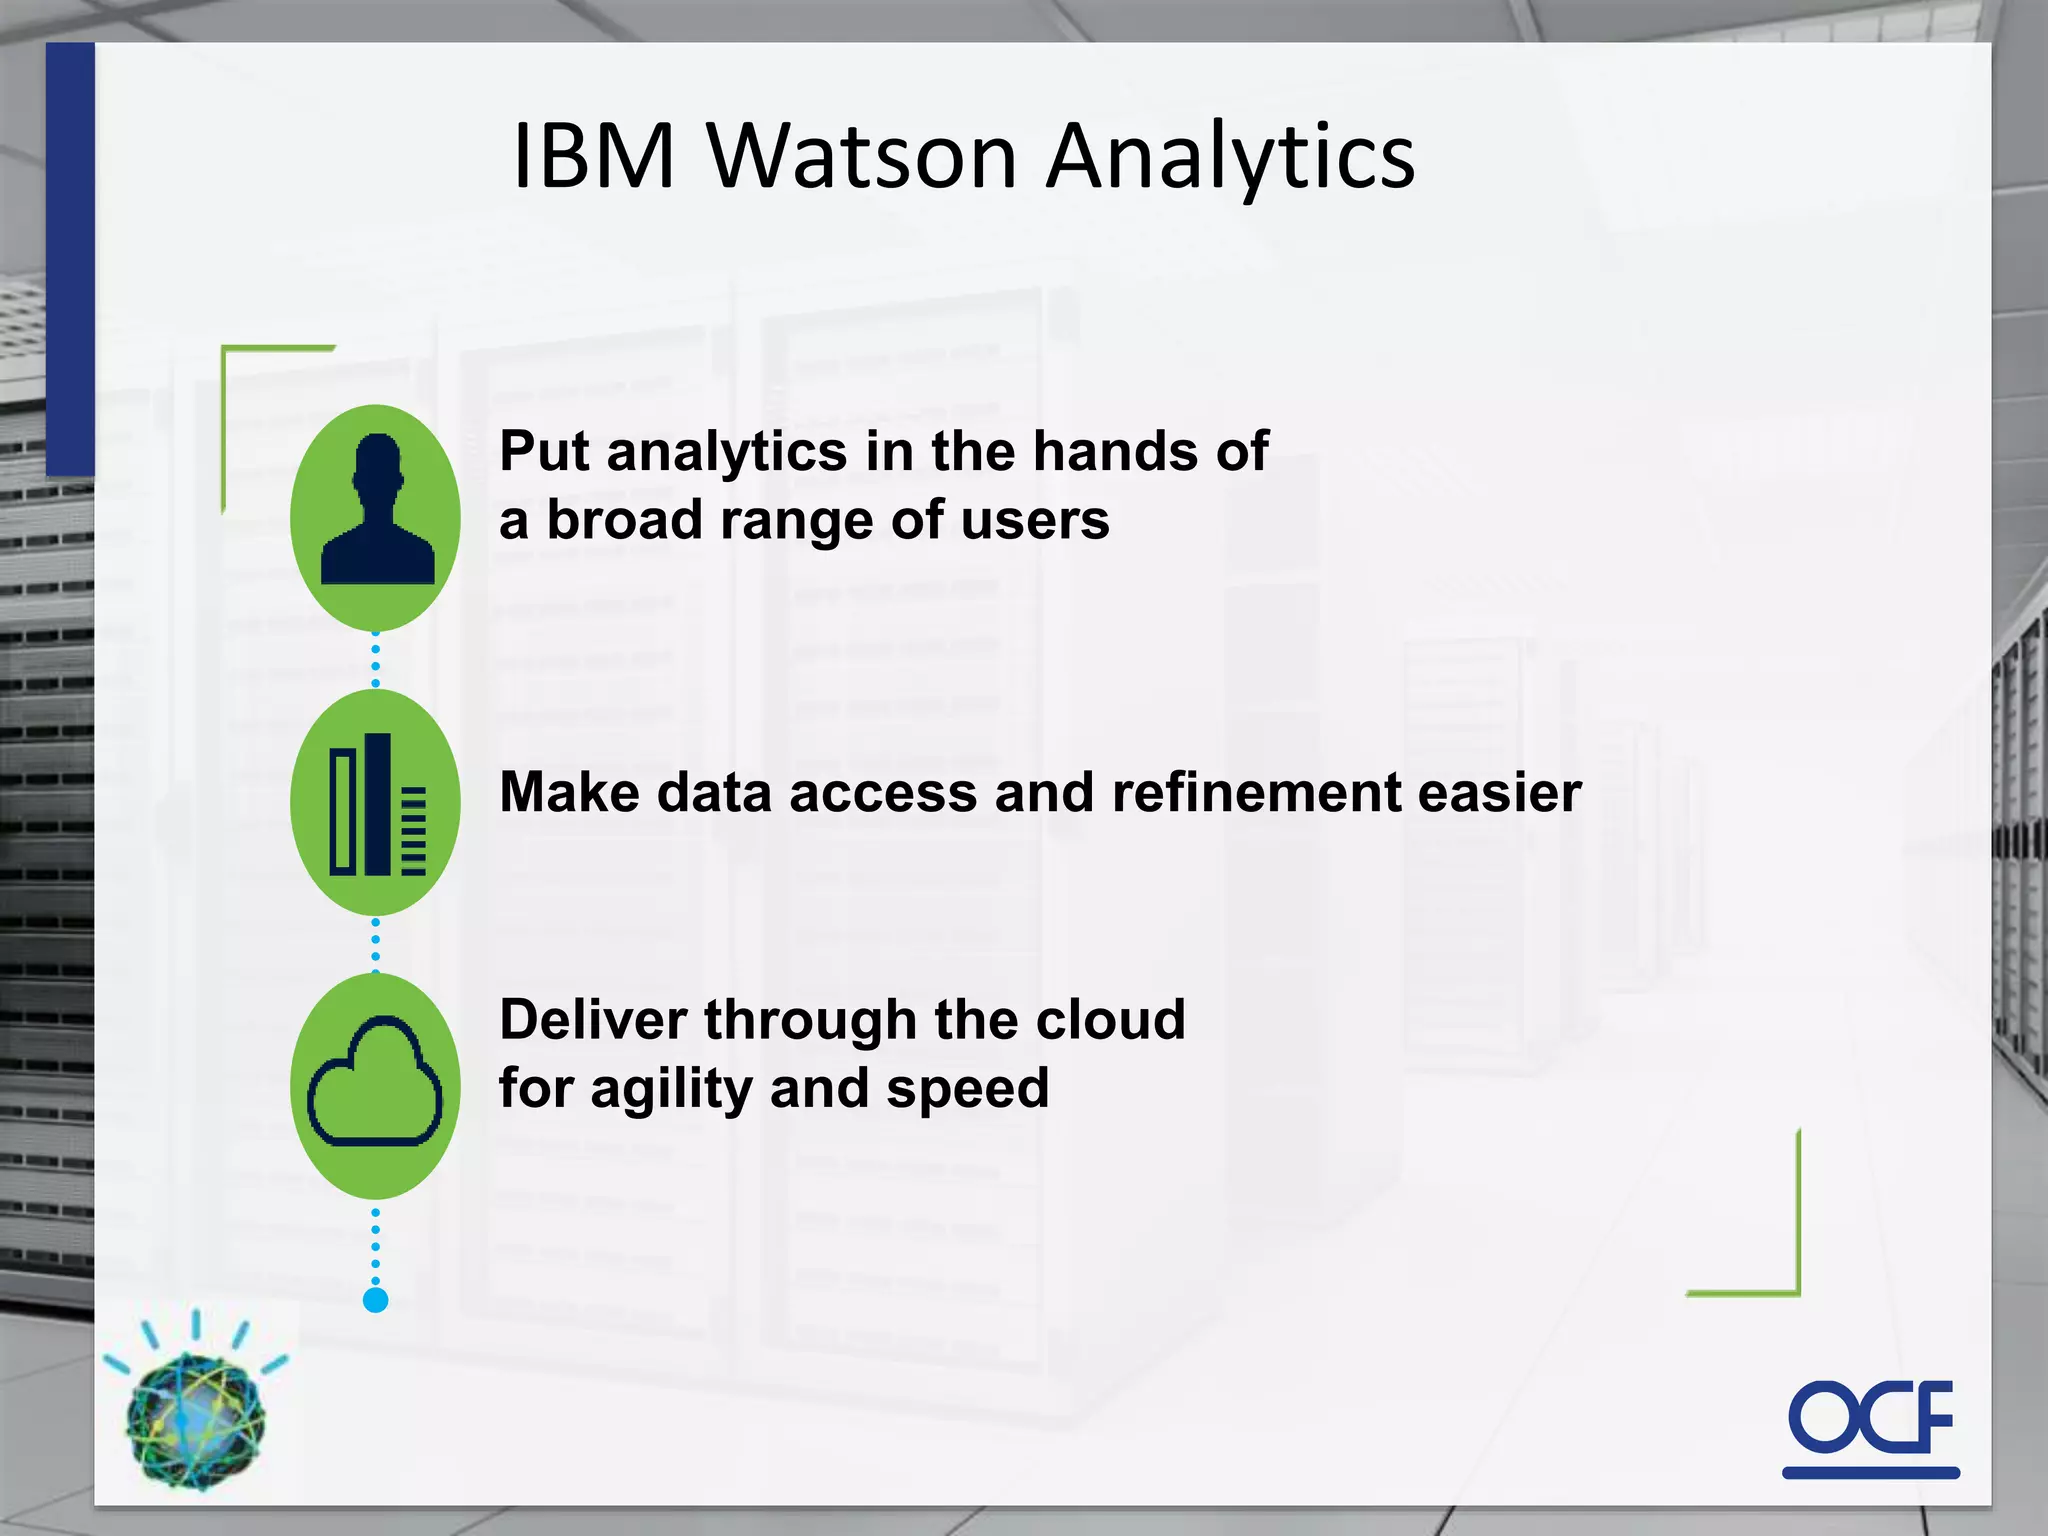
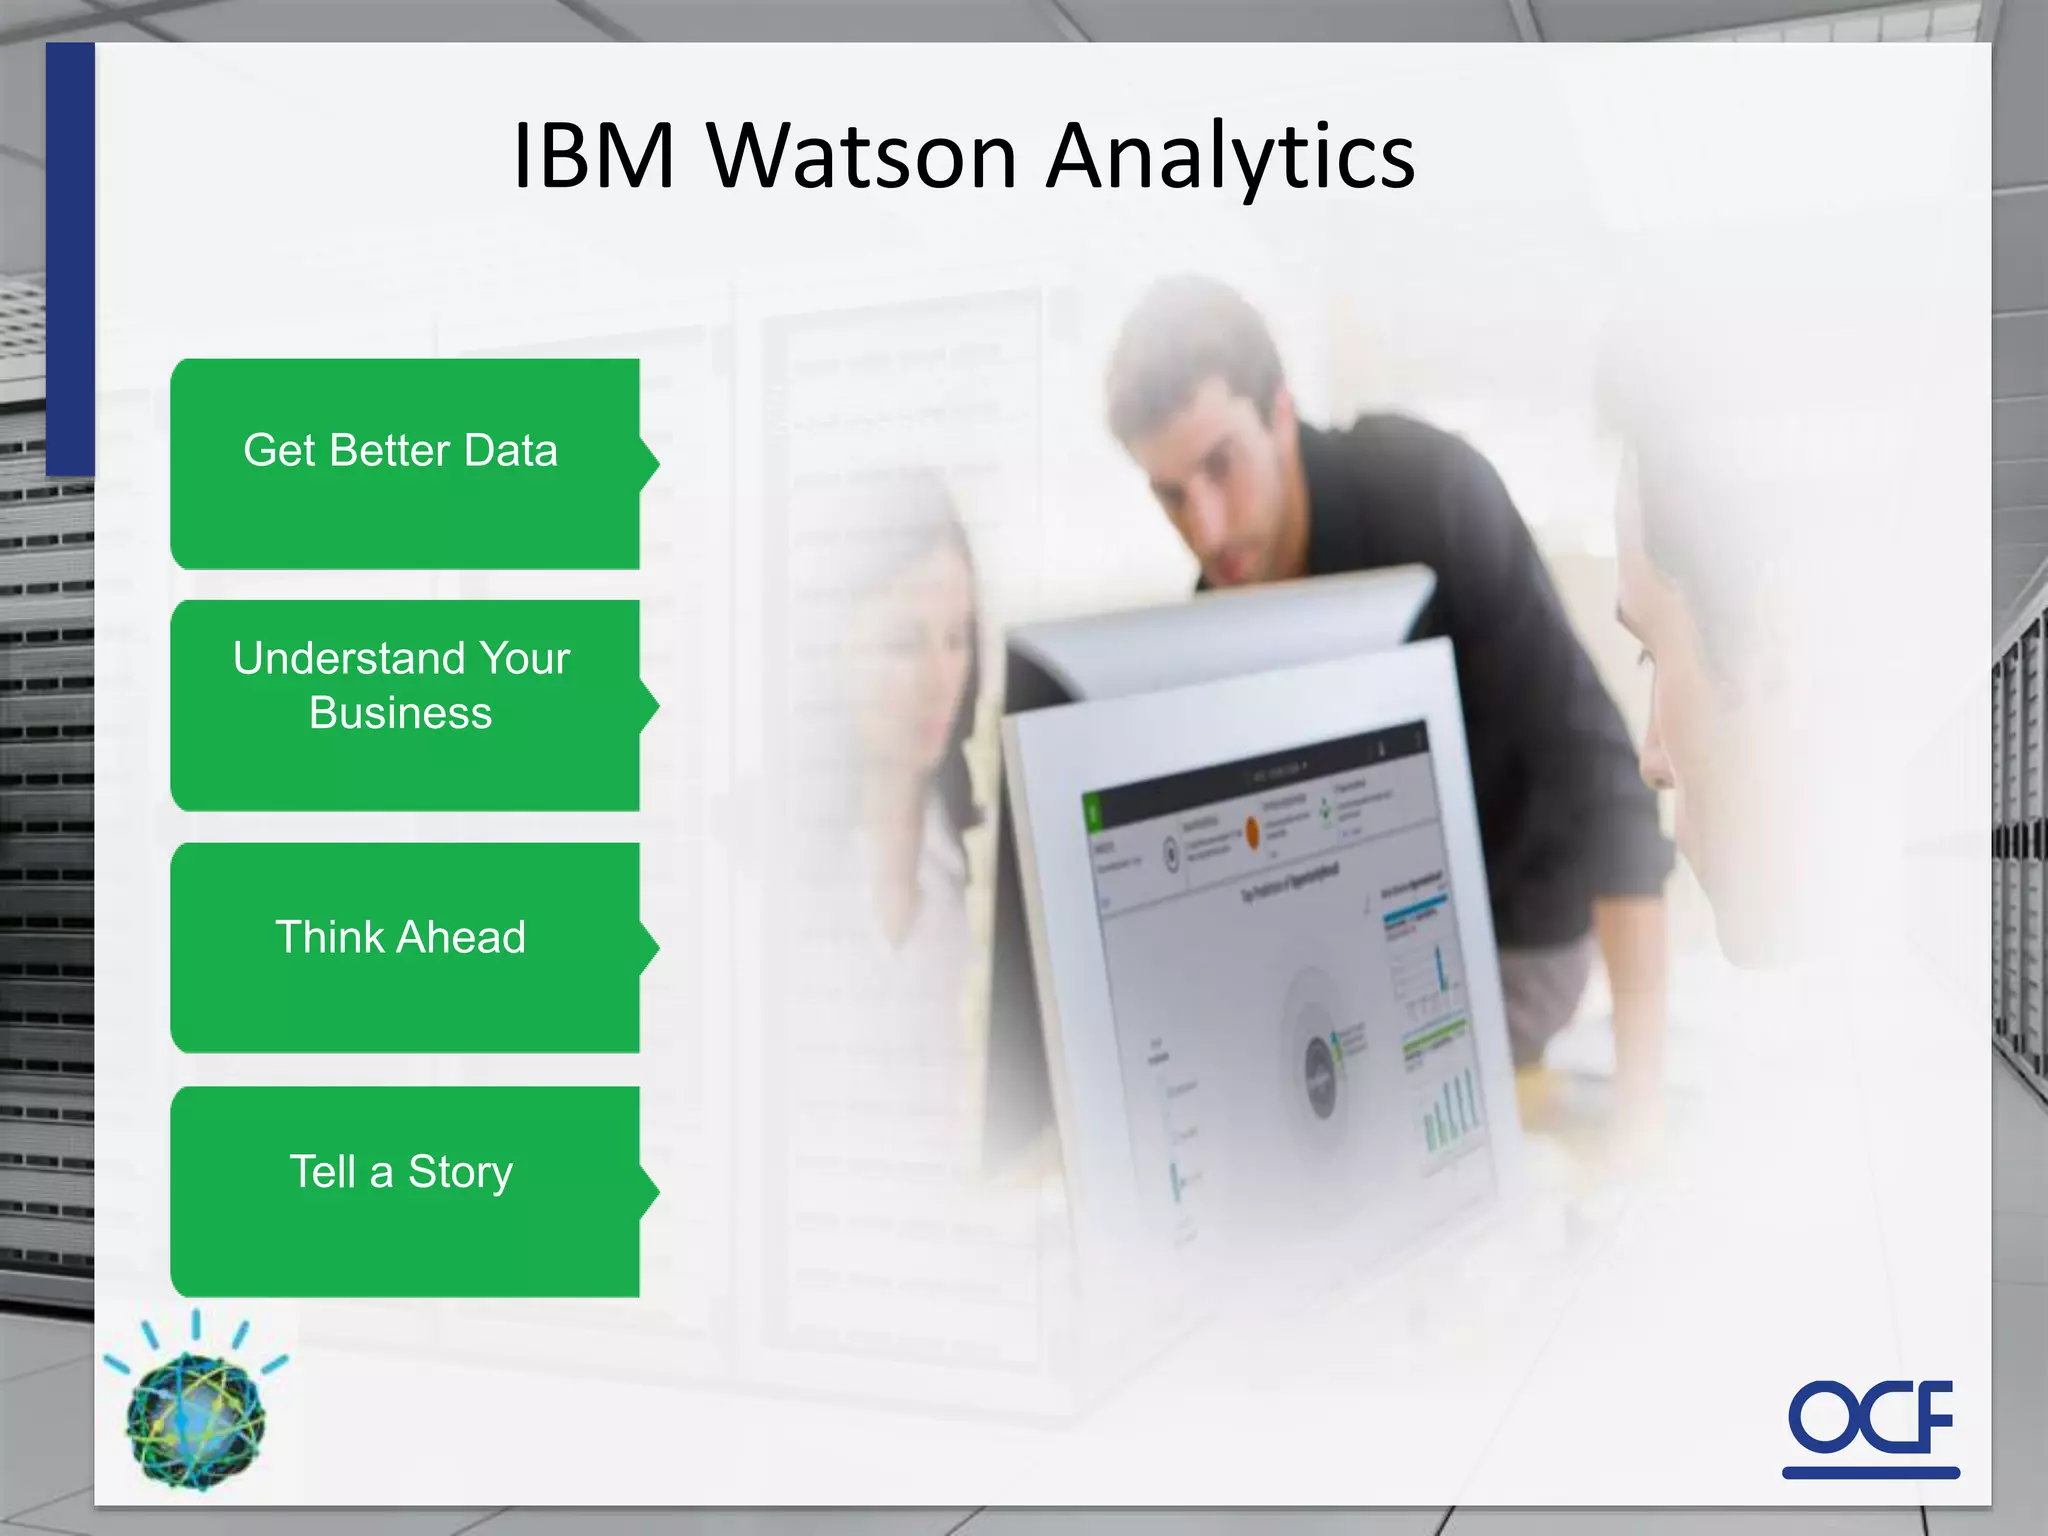
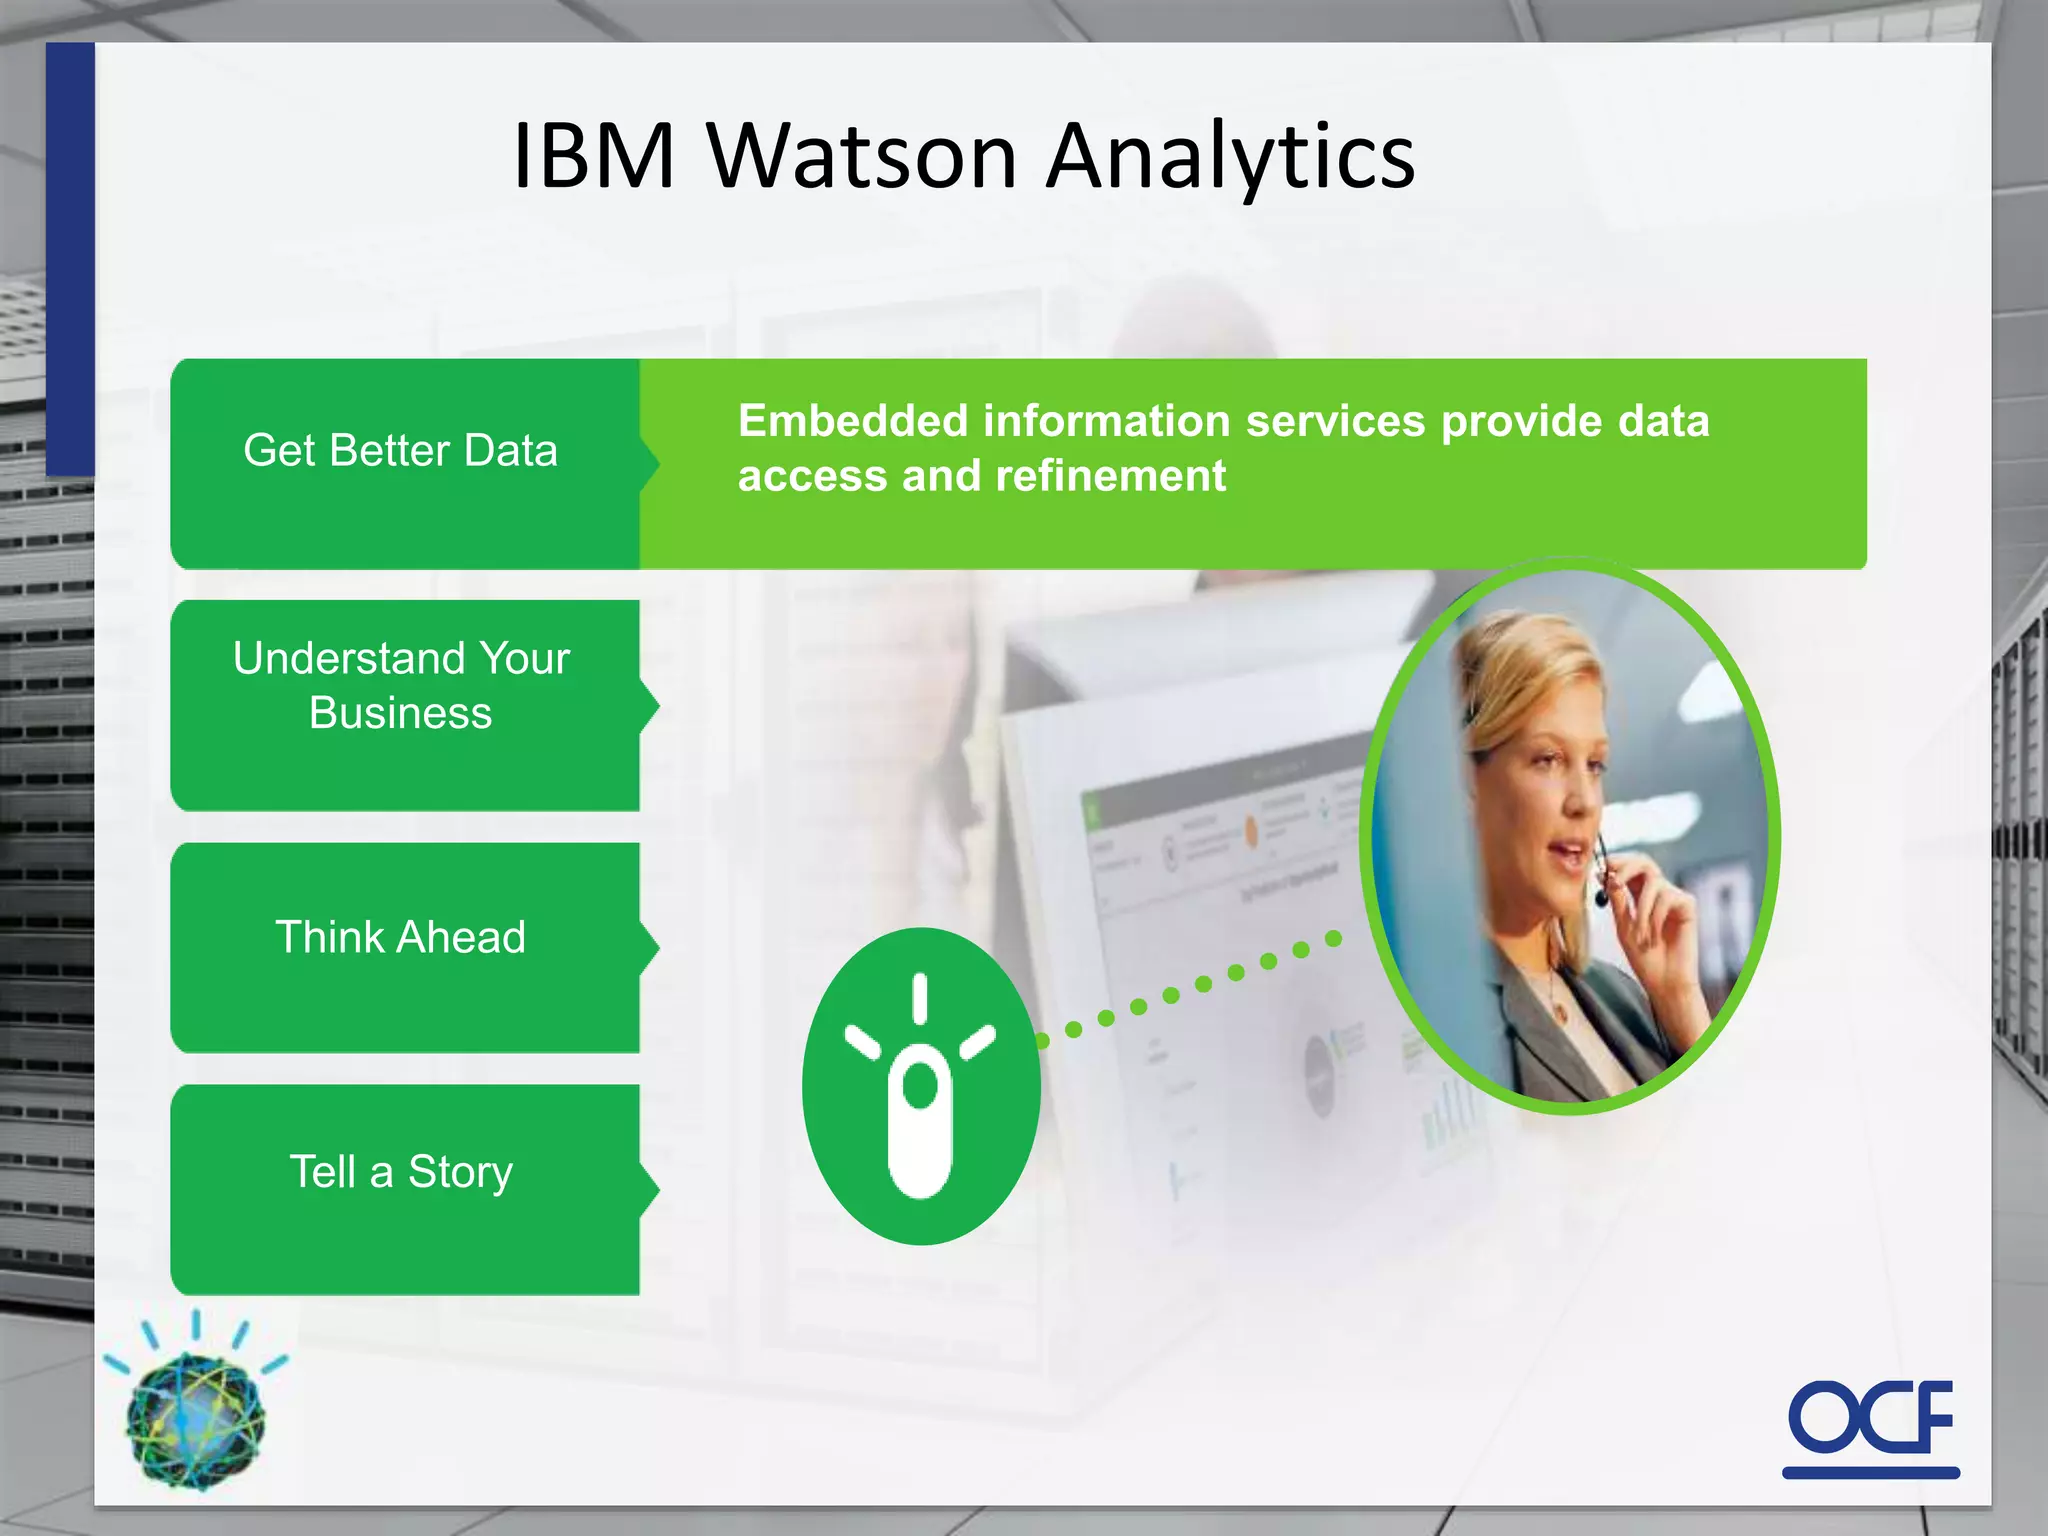
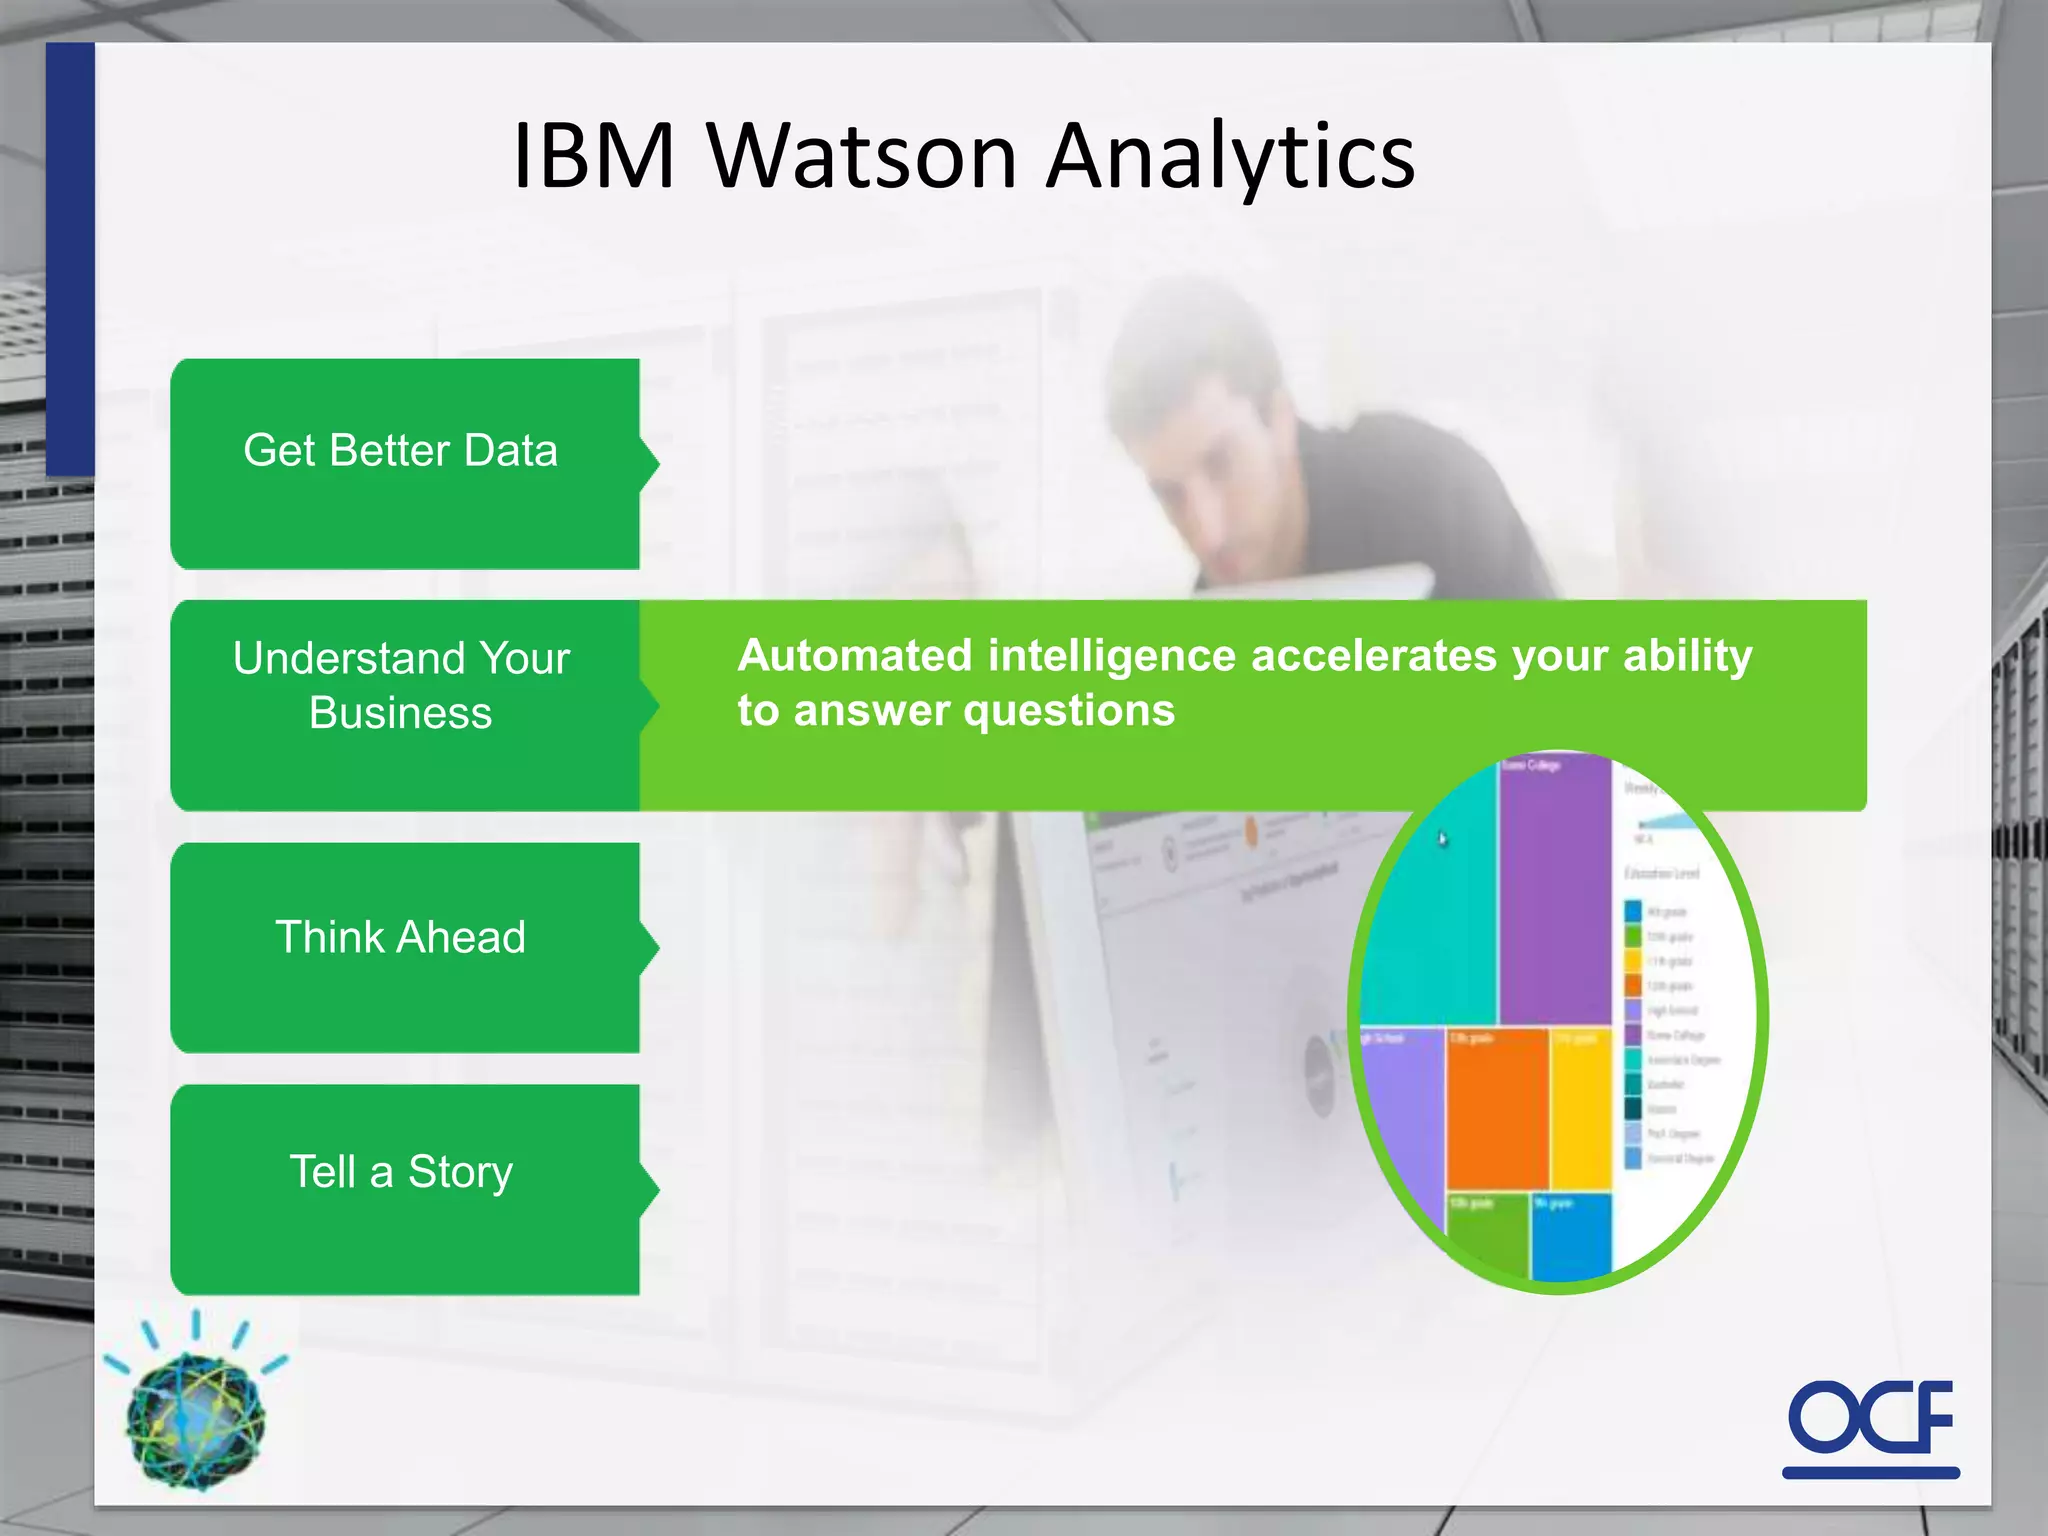
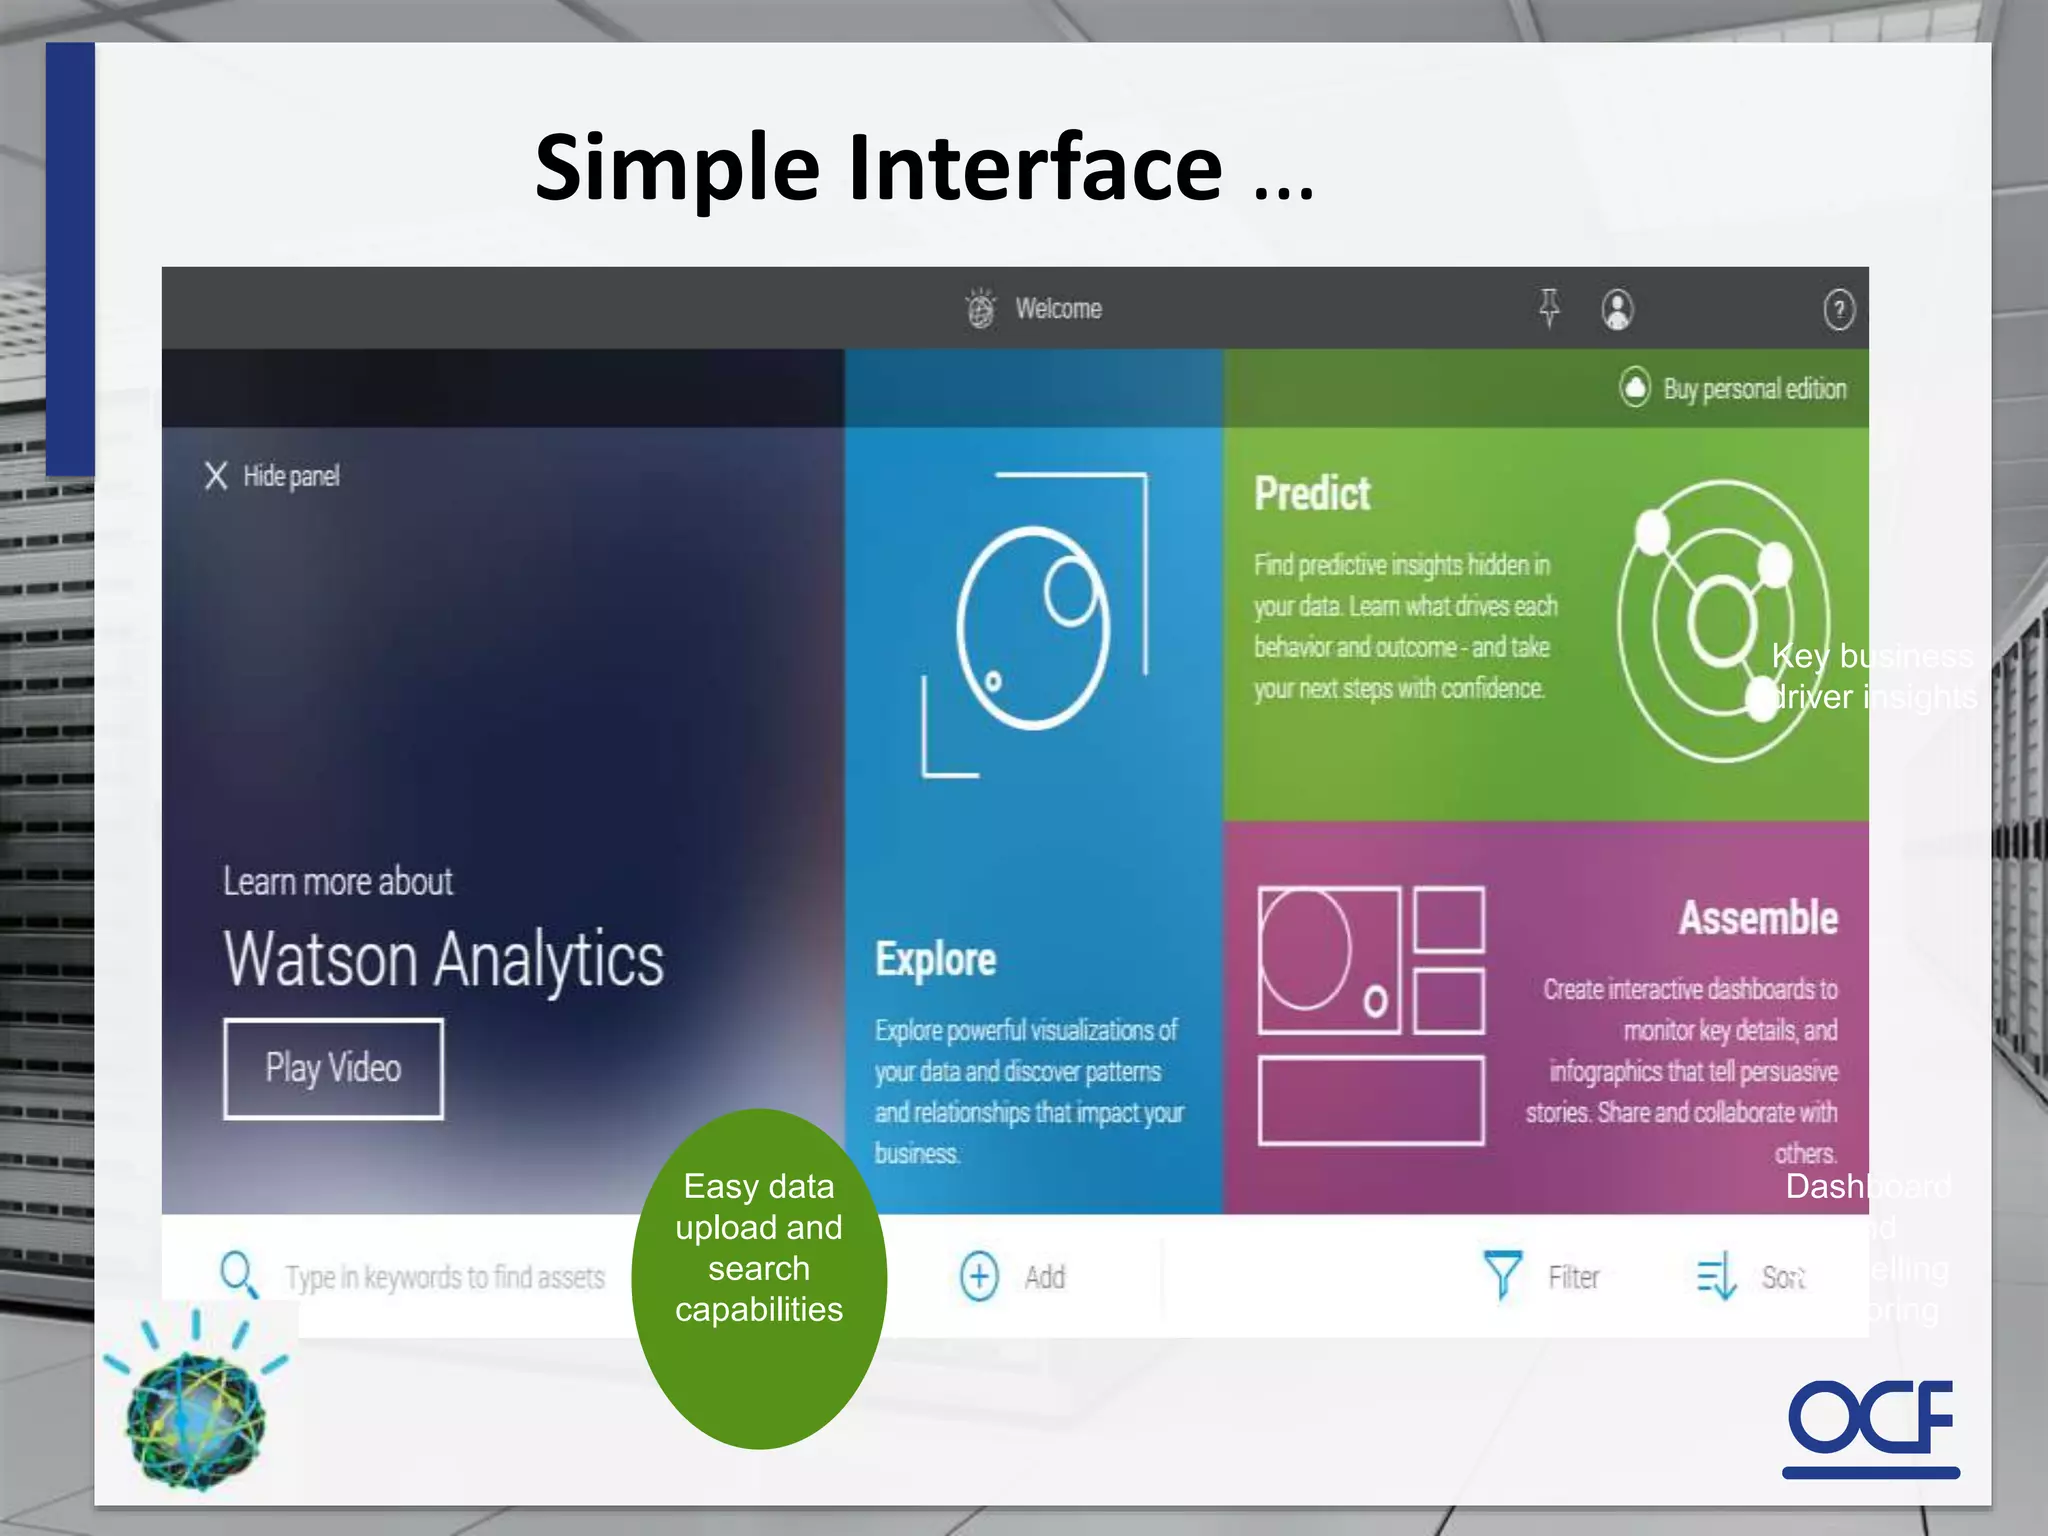
Watson Analytics is a self-service analytics tool that allows non-technical users to access, analyze, and visualize their data without needing data scientists or IT resources. It uses natural language processing to help users ask questions of their data and provides guided predictive analytics to spark new insights. The tool delivers answers with confidence ratings and enables users to author dashboards and stories to communicate their findings to others.
3. Technology has changed expectations
Our work and personal lives have blurred
It’s an “always-on” world
A Do-It-Yourself mentality prevails
4. No data refinement
capabilities
Data exploration only
Slower to deploy, requires a
desktop installation
Creates data silos and maintenance
tasks for IT
Data needs to be manually
refined, an IT intensive task
Can only address simple
business questions
Not truly a “business user” solution
Existing “Desktop” solutions fall short
Still requires significant analytic skill
5. A new way to work
Get Better Data
Understand Your
Business
Think Ahead
Tell a Story
6. IBM Watson Analytics
Put analytics in the hands of
a broad range of users
Make data access and refinement easier
Deliver through the cloud
for agility and speed
8. Get Better Data
Understand Your
Business
Think Ahead
Tell a Story
Embedded information services provide data
access and refinement
IBM Watson Analytics
9. Get Better Data
Understand Your
Business
Think Ahead
Tell a Story
Automated intelligence accelerates your ability
to answer questions
IBM Watson Analytics
10. Get Better Data
Understand Your
Business
Think Ahead
Tell a Story
Predictive analytics reveals insights and
opportunities
IBM Watson Analytics
11. Get Better Data
Understand Your
Business
Think Ahead
Tell a Story
Visualizations support your decisions and
communicate results
IBM Watson Analytics
12. What we are hearing from Analysts
"Watson Analytics differs from Tableau and Qlik
with capabilities that guide the user in finding the
right patterns of data across one or more data
sets, suggesting questions that could be asked of
the data, and then formatting storyboard or
infographic-like presentations that make it easier
to logically communicate results to others."
IDC Group
"The ability to explore data through
visualizations with minimal
knowledge is a primary aim of
modern analytics tools. With the
explore function incorporating
natural language processing, which
other tools in the market lack, IBM
makes analytics accessible to
users without the need to drag and
drop dimensions and measures
across the screen.
This feature should not be
underestimated; usability is the
buying criterion for analytics tools
most widely cited in our benchmark
research on next-generation
business intelligence (by 63% of
organizations)."
Ventana Research
“It looks like IBM has leapfrogged what others have
done,” Mr. Wiedenbeck CIO of Ameritas said. “It
feels like the iPhone of analytics to me.”
NY Times - writer Steve Lohr
“Watson Analytics represents a unique offering in the marketplace
today. It combines advanced visualization capabilities and
cognitive computing to deliver a powerful engine for data
analysis, but does so with an extremely intuitive and visual
interface.
Ultimately Watson Analytics lets users, even those without any
technical or statistical knowledge, analyze their data and
communicate findings from their analysis.”
Blue Hill Research - James Haight Research Analyst
"Watson Analytics’ self-service analytics environment provides
the speed and data governance many organizations are
realizing is required when dealing with increasing large volumes
of data, and increasing user demands.
It also addresses the complaints that many business users have
regarding accessing data when it is fresh and not waiting for IT
to manage it.
Nucleus Research
17. So, Watson Analytics
1. No need for data scientists or IT resources
2. It is self-service
3. Is a seamless solution that brings together a set of self-service enterprise
data and analytics capabilities on the cloud
4. Uses a natural language-based interface to help users ask questions of
their data
5. Uses guided Predictive Analytics to spark new questions and better
insight, directing you to parts of your business that matter most.
6. Has the ability to deliver not just an answer to a question but to do so
with some degree of certainty. This is done using the Watson cognitive
analytics engine which looks at all the available data and then rates
answers as being the most likely one
7. Freemium model
Free - Flat files with no more than 100,000 rows, 50 columns and total data storage of no more than 500 MB
Premium – Can work with larger, more complex data sets from a wider array of sources.
18. Learn More
• Discover What Matters to Your Business with
Watson Analytics
– https://www.youtube.com/watch?v=7NU6DA_cZtc
• IBM Watson Analytics – Let’s get started
– https://www.youtube.com/watch?v=_dOwykEL-QI
• Using Watson Analytics to understand how customers
might respond to a marketing campaign
– https://www.youtube.com/watch?v=5mu4YJrIqJY
• Where to find Watson Analytics
– http://www.ibm.com/analytics/watson-analytics/
Editor's Notes
The world is changing
Expectations are increasing: At work and at home, we expect technology to deliver immediate access to the information we seek. As the lines between our personal and work lives blur, we’re expected to know more, understand more and do more. If the technology we use doesn’t provide value immediately, we simply drop it and move on to the next thing.
Make better decisions faster: We live and work at a relentless pace, and we’ve never been more connected to the people, brands and information that matter to us most. With the intense speed of business today, time—or more clearly, our “return on time”—has become a primary currency by which many measure value. Making better decisions rapidly is no longer a goal; it’s an imperative. We must shrink the time to informed action, which requires us to deliver more than just faster answers; it demands that we identify the right questions to ask.
Bring your own insights to work: We’ve become a global society that practices independent investigation and pervasive learning. Have a question? Get an answer…quickly, simply, and on your own. The data is there, and so are the technologies that make it easy to identify, explore, verify and share that information. This freedom breeds creativity in how we approach problem-solving, even as it fuels expectations that we can consistently deliver fast, correct action.
These changes in the world makes this the right time for Watson Analytics.
Where does IBM see existing analytics solutions fall short?
(This slide is complemented by additional break out slides that reflect the four points – the slides are hidden in the WA customer facing deck)
Introducing IBM Watson Analytics
Watson Analytics is an accessible advanced analytics service in the cloud, acting as your data scientist assistant, guiding you through the analysis of your data and uncovering key insights you can combine with your experience and expertise to improve your decision making.
Watson Analytics offers automated data preparation and intelligence, engaging storytelling and guided predictions so you can find answers and action in your data on your own. No matter what part of the organization you’re in.
Watson Analytics is such a revolution - a revolution in the techniques themselves and a further revolution in the convergence of all these technologies together. The result will be widespread adoption of advanced analytics in the business world.
IBM Watson Analytics delivers a unified analytics experience on the cloud and helps you focus on the drivers that matter most in your business. By automating the steps of data access and refinement, predictive analysis, and visual storytelling, Watson Analytics immediately identifies and explains hidden patterns and relationships to accelerate your understanding of why things happened and what's likely to happen. Because Watson Analytics features natural language dialogue, you can ask the right questions and get results in the familiar terms of your business. Just as the first spreadsheet made financial calculations easier for anyone with a PC, Watson Analytics opens up the world of advanced analytics to all business users on the cloud.
Get better data
Built into Watson Analytics are information management services for data access, refinement and management. Cloud-based data management services automatically find, acquire and improve data sets with the touch of a button. And, the latest in columnar and in-memory technology handles large volumes of data with ease. Watson Analytics can also score the readiness of your data for analysis, highlighting potential data issues that could compromise results. What does this mean for you? Basically, you don’t have to worry about the state of your data. Watson Analytics is designed to make sure the right data is ready when you are. With automation and embedded data refinery services, you get better data and better understanding. Whether you are in marketing, sales, IT, operations, HR or finance, you have the trusted data and intelligence you need to complete your projects.
Take advantage of automation — from data preparation to analysis.
Understand your business
Watson Analytics jumpstarts your analysis. It automates intelligence to accelerate your ability to get to the answers you’re seeking. It immediately starts you off with a visual story that illustrates what you need to know. Instead of fumbling over data or searching for answers, you can focus on understanding your business and effectively communicating results to others. Simply type in what you would like to see and Watson Analytics produces comprehensive results that explain why things happened and what's likely to happen, all in familiar terms. And as you interact with the results, you can continuously fine-tune your questions to get to the heart of the matter.Ask questions and receive answers in the language you use in your business.
Think ahead
Watson Analytics helps you go where your ideas take you with guided and predictive analytics and recommendations. Pursuing ideas, answering questions, making predictions, and deciding what to do next should be as easy as using an app on your smartphone. And you shouldn’t need help from IT or expertise from data scientists. With Watson Analytics, making decisions, anticipating outcomes and taking action can now be a smooth and interesting process. And, if you aren’t sure what you need to do, Watson Analytics automatically starts you off with ideas and guides you through analysis so you can find meaning in your information and make better decisions. It even introduces additional capabilities you might find useful as you become bolder and want to dig deeper.Make more informed decisions to move your business forward.
Tell a story
Visualization is the illustration of trends and patterns in your data so they can be understood. It is a critical capability of analytics. Having the right visualization can make the difference between seizing the right opportunity and making a sketchy decision. However, choosing just the right one can be tricky. Watson Analytics recommends the visualizations that illustrate what’s important the most effectively and brilliantly. You can use these visualizations to create infographics that advance understanding and communication and spur the right action.
Tell a clear, insightful story through rich data visualization.
Additional facts that can be used for support and validation of cloud engagements:
http://www.businesswire.com/news/home/20141211005981/en/IDC-Reveals-Worldwide-Big-Data-Analytics-Predictions#.VIr2vWPwrYE
The predictions from the IDC FutureScape for Big Data and Analytics are:
1. Visual data discovery tools will be growing 2.5 times faster than rest of the business intelligence (BI) market. By 2018, investing in this enabler of end-user self service will become a requirement for all enterprises.
2. Over the next five years spending on cloud-based Big Data and analytics (BDA) solutions will grow three times faster than spending for on-premise solutions. Hybrid on/off premise deployments will become a requirement.
3. Shortage of skilled staff will persist. In the U.S. alone there will be 181,000 deep analytics roles in 2018 and five times that many positions requiring related skills in data management and interpretation.
4. By 2017 unified data platform architecture will become the foundation of BDA strategy. The unification will occur across information management, analysis, and search technology.
5. Growth in applications incorporating advanced and predictive analytics, including machine learning, will accelerate in 2015. These apps will grow 65% faster than apps without predictive functionality.
6. 70% of large organizations already purchase external data and 100% will do so by 2019. In parallel more organizations will begin to monetize their data by selling them or providing value-added content.
7. Adoption of technology to continuously analyze streams of events will accelerate in 2015 as it is applied to Internet of Things (IoT) analytics, which is expected to grow at a five-year compound annual growth rate (CAGR) of 30%.
8. Decision management platforms will expand at a CAGR of 60% through 2019 in response to the need for greater consistency in decision making and decision making process knowledge retention.
9. Rich media (video, audio, image) analytics will at least triple in 2015 and emerge as the key driver for BDA technology investment.
10. By 2018 half of all consumers will interact with services based on cognitive computing on a regular basis.
Provide accessible advanced analytics for business users, allowing them to move beyond traditional barriers in data analysis such as data modeling, report authoring and predictive skills.
(This slide is complemented by additional break out slides that reflect the four points – the slides are hidden in the WA customer facing deck)
We have arrived at a tipping point where the abundance of data, emergence of cloud, advances in analytics, new user experience design and business models mean data-driven decisions can now be an essential, daily and valuable activity for business people. No longer just for data scientists or IT -- marketing, sales, operations, finance and HR professionals can gain answers they need from all types of data. This requires a revolution in analytics technology, helping people acquire, refine data, discover insights, predict outcomes, visualize results, create reports, and collaborate with others in a unified user experience that speaks the language of business.
Introducing IBM Watson Analytics.
Watson Analytics offers automated data preparation and intelligence, engaging storytelling and guided predictions so you can find answers and action in your data on your own. No matter what part of the organization you’re in.
Watson Analytics is such a revolution - a revolution in the techniques themselves and a further revolution in the convergence of all these technologies together. The result will be widespread adoption of advanced analytics in the business world.
IBM Watson Analytics delivers a unified analytics experience on the cloud and helps you focus on the drivers that matter most in your business. By automating the steps of data access and refinement, predictive analysis, and visual storytelling, Watson Analytics immediately identifies and explains hidden patterns and relationships to accelerate your understanding of why things happened and what's likely to happen. Because Watson Analytics features natural language dialogue, you can ask the right questions and get results in the familiar terms of your business. Just as the first spreadsheet made financial calculations easier for anyone with a PC, Watson Analytics opens up the world of advanced analytics to all business users on the cloud.
Additional facts that can be used for support and validation of cloud engagements:
http://www.businesswire.com/news/home/20141211005981/en/IDC-Reveals-Worldwide-Big-Data-Analytics-Predictions#.VIr2vWPwrYE
The predictions from the IDC FutureScape for Big Data and Analytics are:
1. Visual data discovery tools will be growing 2.5 times faster than rest of the business intelligence (BI) market. By 2018, investing in this enabler of end-user self service will become a requirement for all enterprises.
2. Over the next five years spending on cloud-based Big Data and analytics (BDA) solutions will grow three times faster than spending for on-premise solutions. Hybrid on/off premise deployments will become a requirement.
3. Shortage of skilled staff will persist. In the U.S. alone there will be 181,000 deep analytics roles in 2018 and five times that many positions requiring related skills in data management and interpretation.
4. By 2017 unified data platform architecture will become the foundation of BDA strategy. The unification will occur across information management, analysis, and search technology.
5. Growth in applications incorporating advanced and predictive analytics, including machine learning, will accelerate in 2015. These apps will grow 65% faster than apps without predictive functionality.
6. 70% of large organizations already purchase external data and 100% will do so by 2019. In parallel more organizations will begin to monetize their data by selling them or providing value-added content.
7. Adoption of technology to continuously analyze streams of events will accelerate in 2015 as it is applied to Internet of Things (IoT) analytics, which is expected to grow at a five-year compound annual growth rate (CAGR) of 30%.
8. Decision management platforms will expand at a CAGR of 60% through 2019 in response to the need for greater consistency in decision making and decision making process knowledge retention.
9. Rich media (video, audio, image) analytics will at least triple in 2015 and emerge as the key driver for BDA technology investment.
10. By 2018 half of all consumers will interact with services based on cognitive computing on a regular basis.
Get better data
Built into Watson Analytics are information management services for data access, refinement and management. Cloud-based data management services automatically find, acquire and improve data sets with the touch of a button. And, the latest in columnar and in-memory technology handles large volumes of data with ease. Watson Analytics can also score the readiness of your data for analysis, highlighting potential data issues that could compromise results. What does this mean for you? Basically, you don’t have to worry about the state of your data. Watson Analytics is designed to make sure the right data is ready when you are. With automation and embedded data refinery services, you get better data and better understanding. Whether you are in marketing, sales, IT, operations, HR or finance, you have the trusted data and intelligence you need to complete your projects.
Take advantage of automation — from data preparation to analysis.
Understand your business
Watson Analytics jumpstarts your analysis. It automates intelligence to accelerate your ability to get to the answers you’re seeking. It immediately starts you off with a visual story that illustrates what you need to know. Instead of fumbling over data or searching for answers, you can focus on understanding your business and effectively communicating results to others. Simply type in what you would like to see and Watson Analytics produces comprehensive results that explain why things happened and what's likely to happen, all in familiar terms. And as you interact with the results, you can continuously fine-tune your questions to get to the heart of the matter.Ask questions and receive answers in the language you use in your business.
Think ahead
Watson Analytics helps you go where your ideas take you with guided and predictive analytics and recommendations. Pursuing ideas, answering questions, making predictions, and deciding what to do next should be as easy as using an app on your smartphone. And you shouldn’t need help from IT or expertise from data scientists. With Watson Analytics, making decisions, anticipating outcomes and taking action can now be a smooth and interesting process. And, if you aren’t sure what you need to do, Watson Analytics automatically starts you off with ideas and guides you through analysis so you can find meaning in your information and make better decisions. It even introduces additional capabilities you might find useful as you become bolder and want to dig deeper.Make more informed decisions to move your business forward.
Tell a story
Visualization is the illustration of trends and patterns in your data so they can be understood. It is a critical capability of analytics. Having the right visualization can make the difference between seizing the right opportunity and making a sketchy decision. However, choosing just the right one can be tricky. Watson Analytics recommends the visualizations that illustrate what’s important the most effectively and brilliantly. You can use these visualizations to create infographics that advance understanding and communication and spur the right action.
Tell a clear, insightful story through rich data visualization.
http://www.idc.com//home.jsp
What are the features of Watson Analytics
Cloud-based Agility
Watson Analytics is available anytime, anywhere on the cloud.
Self-service for Business Users
Watson Analytics removes the reliance on DBAs, Statisticians, Report Authors or other specialists to do analysis. Its intuitive interface and unique automation of data access and refinement, advanced analytics and visual storytelling empowers business users to do more by themselves, like having a Data Scientist in a Box. Start anywhere, and let your curiosity take you wherever you want to go. Watson Analytics suggests where you might want to go next, progressively exposing you to additional capabilities you might want to leverage to gain a deeper understanding of your business.
Differentiator
Business users want a consumer-like experience to use analytics and data to pursue ideas, get answers to all types of questions, make predictions, and communicate compelling recommendations without needing help from anyone. However, they are hampered by the usability of analytics tools, access to data and dependency on others – both IT to provide the infrastructure and data scientists to provide the analytical expertise. With Watson Analytics, data-driven decisions can now be an essential, daily and interesting activity for business people.
Data Discovery
Watson Analytics lets you visually explore and interact with your data to find the obvious patterns and derive useful insights.
Mobile-ready
Watson Analytics is optimized for tablet devices for analysis on-the-go.
Natural Language Dialogue
Watson Analytics speaks the language of your business. Simply type in what you would like to see and Watson Analytics produces comprehensive results that explain why things happened and what's likely to happen, all in the familiar terms of your business. And as you interact with the results, you can continuously fine-tune your questions to get to the heart of the matter.
Differentiator
Other offerings expect you to adapt to the software – speaking in some form of programming language. Watson Analytics lets you carry on a natural, iterative dialog using the terms that are meaningful to your business.