Downloaded 386 times
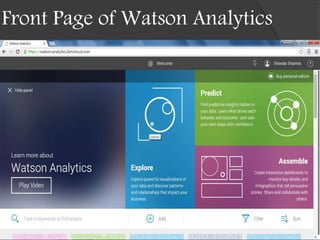
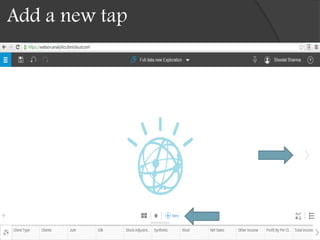
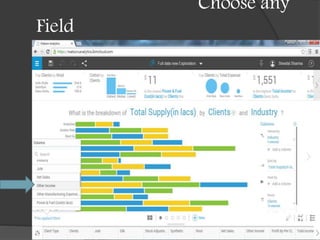
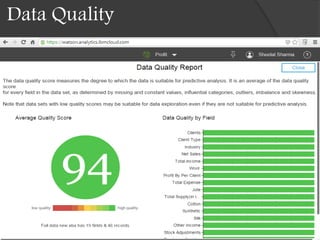
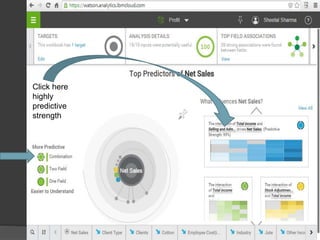
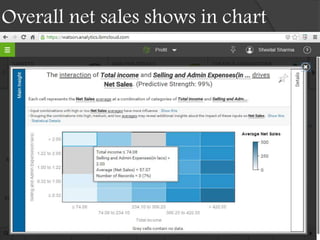
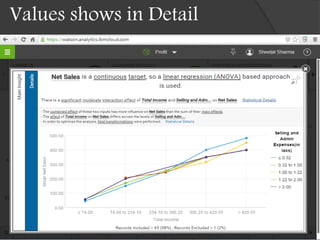
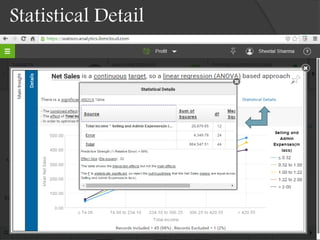
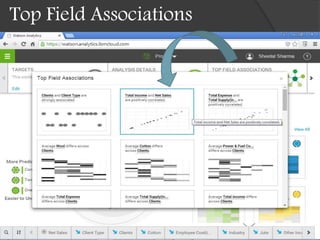
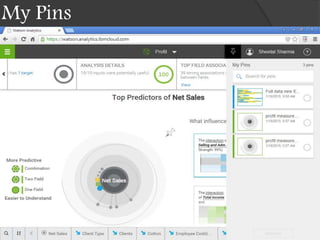
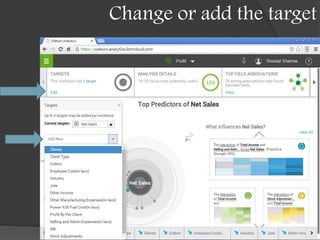
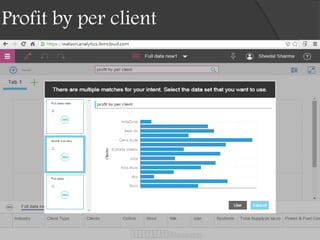
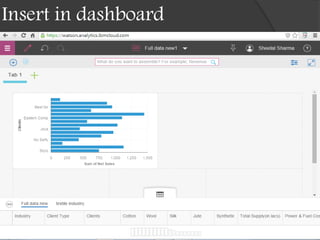
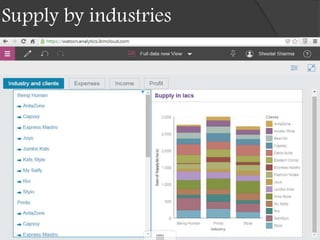
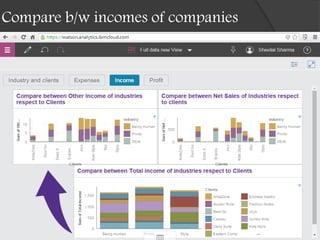
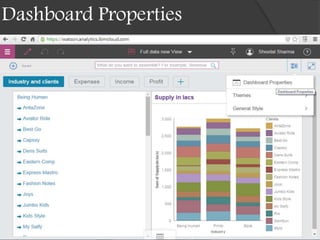
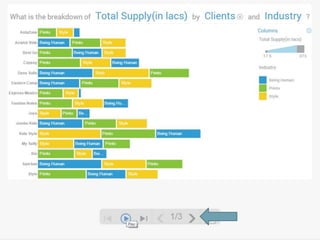

IBM Watson Analytics is a user-friendly analytics tool designed for business professionals, enabling self-service data preparation and predictive analytics without requiring specialized skills. It addresses the complexity and accessibility issues of traditional analytics tools by incorporating natural language processing and providing a unified analytics experience. The platform allows users to analyze data collaboratively and derive actionable insights, making it ideal for various business applications across different industries.


![Hacking-Uncovered-How-People-Get-Hacked-and-How-to-Stay-Safe[1].pptx](https://cdn.slidesharecdn.com/ss_thumbnails/hacking-uncovered-how-people-get-hacked-and-how-to-stay-safe1-260130170011-4883a9c7-thumbnail.jpg?width=640&height=640&fit=bounds)


![제 23회 보아즈(BOAZ) 빅데이터 컨퍼런스 - [MBOAX] : ABSA를 활용한 소비자 반응 분석 기반 운영 효율화 대시보드 설계](https://cdn.slidesharecdn.com/ss_thumbnails/3-1boaz23rdconferencemboax-260203102709-9d519923-thumbnail.jpg?width=640&height=640&fit=bounds)


