SlideShare a Scribd company logo
Financial Statement Analysis
Chipotle Mexican Grill
Casey Boardman, Kathryn Fyffe, Michael Glomski,
Robert Strauss, Yexin Wan
TABLE OF CONTENTS
Executive Summary ---------------------------------------------------------------------------------------3
Business Overview-----------------------------------------------------------------------------------------4
Industry Analysis--------------------------------------------------------------------------------------------5
Key Drivers and Trends-----------------------------------------------------------------------------------7
Competitive Position--------------------------------------------------------------------------------------11
Forecasting Sales & Growth----------------------------------------------------------------------------14
Reformulations---------------------------------------------------------------------------------------------15
Discount Rate Determination---------------------------------------------------------------------------16
Pro Forma Analysis---------------------------------------------------------------------------------------17
Valuation-----------------------------------------------------------------------------------------------------18
Sensitivity Analysis----------------------------------------------------------------------------------------20
Accounting Quality----------------------------------------------------------------------------------------21
Appendix-----------------------------------------------------------------------------------------------------26
I. EXECUTIVE SUMMARY
Chipotle Mexican Grill is the oldest fast-casual mexican restaurant specializing in burritos, tacos,
salads and burrito bowls.
We recommend a Sell position based on a 70% weight on our Residual Operating Income
(ReOI) model, a 15% weight on our Residual Earnings (RE) model, and a 15% weight on our
Discounted Cash Flow (DCF) model.
Chipotle’s (CMG) current share price is $318.07. Based on our valuation the price target is
$175.11. This is $142.96 under the current share price.
Our revenue forecast was determined by projecting the net number of future stores opened and
their projected revenue. We drew upon historical data, the current 10k, press releases, and
conference call.
II. BUSINESS OVERVIEW
Chipotle Mexican Grill Inc, operating Chipotle Mexican Grill restaurants, is a quick-serve
restaurant chain. Popular for their Mexican food like burritos, tacos, chips and salsa, the
company owns 2,408 quick-casual eateries. These 2,408 eateries includes 2,363 Chipotle
restaurants, 37 international Chipotle restaurants, and 8 non-Chipotle restaurants. The founder,
Steve Ells, has placed strong emphasis on “Food with Integrity” throughout his business practice.
Following classic cooking style, Chipotle devotes itself to making great food with the very best
ingredients. Chipotle has pursued the mission to change the way people think about and eat fast
food. Recently the company has re-envisioned their purpose, and are currently working on
cultivating nourished communities where wholesome food is enjoyed every day. By the end of
2017, Chipotle had around 68,890 employees, including roughly 5,020 salaried employees and
63,870 hourly employees. None of the employees are unionized or covered by a collective
bargaining agreement, which mirrors trust in management.
Chipotle was on a steady path for growth, with revenues growing between 10-27%, until recent
years where they hit a slump in 2016. The decline resulted from an E. coli incident that affected
52 people across several restaurants. By year end 2017, they experienced a rebound and
implemented a plan to recover the brand name focusing domestically through improvements to
restaurants and expanding with new ones going forward. As of April 6, 2017 Chipotle stocks
were trading for $318.07/share. This means their market cap as projected by the market for
27,930,272 shares outstanding is $8.88B, while our projected market cap is about $5.05B.
The company focuses on a differentiation strategy by being able to charge higher prices for their
higher quality fast casual food. Younger generations and health conscious customers are their
target market currently. Chipotle chooses to focus on incremental innovation to encourage
growth by limiting new product rollouts and improving mobile ordering and second-make lines
along with their catering business. Moving forward, they choose to solely focus on improving
their processes instead of considering any acquisitions to keep up with the ever increasing
competition. The company faces some risks in the future with suppliers. To offer quality, non-
GMO ingredients Chipotle sources it’s produce and meats from local farmers. In years past, this
has limited their ability to offer everything on the menu when quality falls short of their
“Reasonably Raised,” expectations, and they cannot get supplies elsewhere in the time needed.
Chipotle has also experienced a data breach within the last year which poses a threat of litigation
expenses and loss of sales in the coming years.
III. INDUSTRY ANALYSIS
The restaurant industry is becoming ever complex as trends and consumer preferences change
over the years. Chipotle competes with fast food chains such as McDonalds, Yum! Brands (Taco
Bell, KFC, and Pizza Hut), Wendy’s, and other fast-casual joints like Potbelly and Noodles and
Company. McDonald’s currently holds the largest market share at 15.2% while Yum! Brands
trails at 8.4%. For comparison, Chipotle holds onto about 2.2%, and when compared to the
Mexican restaurant segment, Chipotle trails with 10.8% behind the leader, Taco Bell, with
23.3%. The fast food segment of the industry has reached a mature stage and saturated the
market with so many competitors. As a whole, Mexican foods only account for 8% of the market
while burger and chicken restaurants account for almost half.
In recent years, the industry has seen an increasing trend in consumer spending which is
expected to continue around 1.97% as wages are expected to grow. This can be a benefit to
Chipotle as their menu prices tend to be a bit higher than typical fast food chains as a result of
more expensive ingredients. Another factor to consider in the industry is the healthy eating
complex which represents the percentage of the recommended diet that Americans actually
consume. Increases in this value indicate consumers are putting more emphasis on eating the
way they should to lead healthy lives. Some price volatility with produce from natural events or
more emphasis on biofuels can cause fluctuations in this number, but recently the healthy eating
complex is at 67.9% and expected to grow another 1.7% over the next five years. This may
continue a shift toward restaurants like Chipotle and away from fast food restaurants typically
thought of as unhealthy. Narrowing down to the Mexican restaurant industry, Agricultural Price
Index is an item to consider. This represents prices received by farmers for all agricultural
products using 2011 price as a base year. The current index value of 90.3 represents a 3.3%
decline over the past five years, but is expected to grow 1.3% in the next five years. Part of this
forecast can be explained by appreciating oil prices which drive more production of ethanol and
other biofuels. For the industry, a growing Agriculture Price Index means increasing prices for
ingredients, thus higher operating expenses. Overall, the Mexican restaurant industry has been
seeing growth in recent years as consumer preferences change and there is an ever increasing
Hispanic population in the United States. Industry revenue is expected to grow 2.8% annually
over the next five years.
IV. KEY DRIVERS AND TRENDS
To determine where Chipotle is headed in the future, we must also examine their historical
performance through ROCE and the three levels of drivers. From the E. coli events that occurred
at the end of 2015, Chipotle’s 2016 numbers are expected to dip below past performance, and
2017 numbers are a recovery year. That aside, we focus on comparing 2017 numbers to 2015 and
2014 where Chipotle was still on the path of fast growth. Previous to the event, we determined
their ROCE to be around 24.5% and in 2017 Chipotle’s ROCE still has not recovered. In the first
level, part of this dip can be explained in part by their inability to get RNOA back up to 0.6 as it
was in previous years. As mentioned before, Chipotle is planning on rebuilding its brand through
improvements to current restaurants and adding new restaurants. They opened 183 new
restaurants in 2017 and haven’t seen enough return on those added assets yet, as these new
locations only bring in revenue equal to 75% of existing ones. Their financial leverage is also
bringing down ROCE. Chipotle is an NFA firm, therefore their FLEV value is negative. This
change in FLEV after 2015 is driven by their decrease in net financial assets. In 2017, Chipotle
made the decision to sell off all of their long term investments, which caused the decline in NFA.
Overall however, their ROCE has rebounded some from 2016 and is still holding strong at
17.1% compared to some competitors mentioned later on, but they may not be on the same path
of growth as before. In addition, we do not need to worry about issues inflating ROCE, such as
large dividend payouts, because Chipotle does not pay out dividends.
Narrowing down further, we analyze the influences of RNOA and what may be causing the
decline. The most notable change comes from profit margin ratio which represents the operating
income from sales over total sales. It is concerning that profit margin is decreasing especially
when Chipotle just finished the last round of price increases in January. As discussed by
management, food expenses actually decreased in 2017 from 35.3% to 34.2% as a result of the
price increases, cheaper avocados, and improved management of paper and packaging
inventories. This should have improved profit margin, however, the company is facing extra
expenses related to the E. coli outbreak and the data security breach that happened in March of
2017. We examine profit margin further in the following paragraph. The company’s ATO is
quite volatile, but remains high due to their low profit margins.
Breaking down the profit margin in the 3rd level further narrows our focus to what is causing the
changes we see in 2017’s ROCE. The sales PM in the last two years is less than half of what it
was pre-2016. This was to be expected in 2016, but 2017 did not rebound as much as we would
have liked to see. Sales PM is equal to the gross margin ratio minus all other expense ratios
listed, which are all related to operating income. There is not a significant change in GM ratio
other than what is expected with recent events. The change in Sales PM comes from an increase
in advertising and marketing and other operating expenses. Chipotle typically does not roll out
new menu items, but in an attempt to bring sales back up, they introduced chorizo in the past and
most recently, queso in 2017. These releases initiated more spending on advertising, as if trying
to follow their competitor Taco Bell. Taco Bell is known for rolling out products continuously
and heavily advertises these rollouts. However, the most influential part of the change in Sales
PM results from increasing “other” operating expenses. In 2017, these equated to 14.6% of sales,
compared to 11.4% back in 2015. As stated in the 10-K, other operating income for Chipotle
includes some promotional costs, bank and credit card fees, and restaurant and utilities
maintenance expenses. Chipotle estimates their cost of promotions such as free food offerings
and coupons through historical patterns (i.e. percent actually used, etc.). Chipotle ran a
promotional rewards program, Chiptopia, where members could earn free burritos after so many
purchases in a specified timespan. This greatly added to their increased cost of other operating
expenses in 2017, a reason why they are no longer offering it.
Looking forward, we expect Chipotle to continue struggling to improve their profit margins.
Although the tax ratio is expected to decrease with the recent change in corporate tax law, a
focus on new location openings will impact pre-opening expense ratio, ad and marketing
expense, and G&A expenses. Other operating expenses will increase with the added renovations
to existing locations. Management anticipates making improvements to most of their locations,
spending between $10,000 and $20,000 per restaurant in maintenance expense. Chipotle is also
facing several lawsuits as a result of the security breach in early 2017, and may have added
expenses related to the outcome of each. The company also has plans to make improvements to
second-make lines in quite a few restaurants to help with the trends they are seeing in mobile
ordering. Currently, this is one of the biggest areas of growth, with 50% growth over the
previous year. Overall, we do not anticipate much of an improvement in profit margin within the
next few years.
V. COMPETITIVE POSITION
In comparing Chipotle with it competitors on a strict Revenue growth metric over the past three
years it is apparent that Chipotle is performing the best. There was a significant decrease in
growth in 2016 because of the E-coli scare but the firm rebounded well to essentially show
growth in the low single digit percentages, a trend we forecast into the future. Each other firm
demonstrated a decrease in revenue growth perhaps due to the consumer’s choosing to return to
Chipotle in 2017 after they began to re-establish trust with the customer. However, a revenue
growth metric is not enough to imply that Chipotle has potential to be the best fast-food/fast
casual firm in their industry.
Diving deeper into the vital ratios of the industry we find that to determine the best firm in the
industry is far more convoluted. Wendy’s, McDonald’s and Yum! Brands all have much higher
profit margins than Chipotle. These firms are turning a lot more of their revenue into net income.
This could be due to the fact that these firms are far older than Chipotle and in the case of
McDonald’s and Yum! Brands far larger. That being said Chipotle performs better than everyone
except Yum! Brands on ROA. It does not look like any of the firms will have issue paying off
debt because of their high and positive Current Ratios.
We considered that Chipotle’s main and direct competitors would be Wendy’s, Potbelly, and
Noodles. These companies are a lot closer to the perceived healthy, fast casual market that
Chipotle attracts. They are also far closer in menu price than that of Taco Bell within Yum!
Brands and McDonald’s who strive for cost leadership. Looking closer at these firms, it is
apparent that Wendy’s holds the top spot within this specific ratio analysis. Chipotle holds the
second place position followed by Potbelly and Noodles. Due to Noodles having a net loss for
the year of 2017 many of their ratios are significantly impacted. However they IPO’d just 4 years
ago and are far from becoming a more stable firm. Luckily for Chipotle, of this competitors
Noodles is likely the most direct substitute with Wendy’s being closer to the fast food industry.
In recent years, however, Wendy’s has began pushing for more healthy menu options to
supplement their cheaper meals. One area that Chipotle has more success in than Wendy’s is the
Current Ratio. Wendy’s holds only $62,602,000 in current assets and $227,162,000 in current
liabilities. Should Wendy’s have a large issue that required a lot of spending their debtors could
be concerned and call on a lot of debt that they do not have the assets to pay it with currently.
It is difficult to say how Chipotle’s competitive position would impact the final valuation
recommendation because of the varying results on the metrics we used to determine the best firm
in the industry. Additionally, the industry itself is difficult to predict which restaurants are
substitutes for each other. The main conclusion to be drawn is that Chipotle finds itself not in a
dominant or weak position within this industry.
SWOT Analysis
Strengths
Differentiated product
Healthy, quality ingredients
Brand strength
Market demand for “healthy” fast casual
food
Weaknesses
Limited suppliers due to dependence on
farmers that uphold their ingredient
requirements
More expensive meals
Limited product offerings
Opportunities
Catering
International business
Mobile ordering expansion
New product offerings
Threats
Increased competition within Smart
Casual/healthier options
Increased food safety regulations
Entry of new competitors
US Market Dependence
VI. FORECASTING SALES AND GROWTH
For purposes of forecasting, we applied a growth rate of 4.36% for the firm for the next three
years. This figure is derived from our beliefs on Chipotle’s future sales growth. The firm expects
to open 130-150 new stores in 2018. New stores, on average, generate 75% of sales compared to
existing stores. We believe that new store sales will be the primary driver of sales growth going
forward. To calculate growth we assumed that Chipotle would open 140 stores in 2018. We then
calculated an estimate of sales per store by dividing the number of stores that were open in 2017
by their total sales. Next, we applied the 75% assumption for new stores to this figure to
calculate our belief of new store sales. After coming to a sales per new store number, we
multiplied it by our assumption that 140 new stores will be open to arrive at total sales from new
stores. Lastly, we divided total sales from new stores by 2017 total sales to get our expectation of
sales growth. We rely solely on the new store sales as driving Chipotle’s growth because
Chipotle’s sales profit margin currently is 5.4% and as mentioned above we believe that Chipotle
will continue to struggle with profit margin and it won’t contribute to growth in sales revenue.
The firm’s ATO has also remained relatively consistent over the past four years and we expect it
to remain consistent going forward. Management also remarks in their February 6th press release
that increases in revenue in 2017 as compared to 2016 were a result of new store openings.
In the calculation of the continuing value for our valuation models, a growth rate of 2.45% was
applied. 2.45% is the average growth in GDP for the years 2012-2017. As we believe we are
unable to forecast Chipotle’s growth further than three years out due to uncertainty, the average
growth in GDP is a conservative estimate of growth to apply to these calculations. Furthermore,
the beta that we use for valuation purposes of Chipotle is 0.85 signaling that the firm is
marginally less volatile than the market as a whole. This reiterates our position of using the
average growth rate of GDP in our valuation models for years beyond 2020.
VII. REFORMULATION
Income Statement
The reformulation of the income statement was crucial in determining the earnings generated
from core business operations for Chipotle. It also provides us with a comparative basis for the
historical performance of the firm. While completing the reformulation of the income statement,
there were a few subjective decisions that went into our classification of specific line items that
are worth addressing. First, we listed pre-opening costs as a core operating expense. These costs
are limited to expenses incurred exclusively in store openings, but Chipotle is continuously
opening new stores that drive their core operating income and we felt it appropriate to match the
expenses of this driver with the revenues it produces. Next, Chipotle’s financial statements
include a broad line item titled “interest and other income, net.” Without disaggregation or
further details provided in the notes to the financial statements, it was impossible to discern the
other income portion from the net interest for reformulation purposes. For this reason, “interest
and other income, net” was included wholly under Net Financial Income in the reformulation.
Balance Sheet
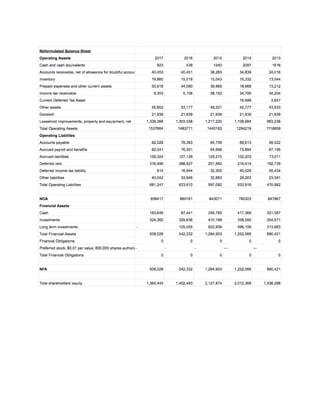
The reformulation of the balance sheet was important for calculating historical NOA and NFA.
We calculated operating cash using the ½% rule and then categorized each line item on the
balance sheet into either operating or financial. Our main issue with the reformulation was the
small loss of about 3.7 million in accumulated OCI. After research in the text and online, we
decided to include it in total shareholders equity since Net Income would pass through there
anyways and it was a small amount compared to the 1.36 billion equity value.
Discount Rate
The discount rate that was applied for the valuation of Chipotle was 7.11%. This number comes
from the Cost of Capital by Sector source provided by NYU and is the cost of capital applied to
the restaurant/dining industry as a whole. This resource derives the discount rate by using a Beta
for the restaurant/dining industry of .85. The Beta is then multiplied by the risk premium for
equity which is given as 5.08%. Then, the long-term treasury bond rate (risk-free rate) of 2.79%
is added in to arrive at 7.11%. A required rate of return for Chipotle of 7.11% is reasonable given
the fact that there is a relatively low amount of risk for an established firm in the
restaurant/dining industry.
VIII. PRO FORMA ANALYSIS
Income Statement Items
Since sales growth is anticipated to be 4.36%, we were able to forecast operating expenses based
on management’s predictions of 2018 expenditures and a gross margin consistent with 2017. In
the Feb. 6th 2018 press release, Chipotle management predicted SG&A expenses would be
$330m (an increase from 2016) and that $35m in research and development would be expensed;
therefore, we value core operating expenses as much higher than the historical basis.1
From
there, we expect the core operating expenses and other core operating expenses to grow at the
4.36% rate due to relative costs of expansion and the historical trend. In order to predict the
estimated net financial income we used a rolling average due to the lack in volatility in financial
income in the previous five years.
Balance Sheet Items
The main drivers of the balance sheet items are asset turnover, sales, and the lack of AFS
securities. Since there is some volatility in the 2016 measurement of the asset turnover ratio
(ATO), we used a rolling average in order to smooth out the historical data and forecast the next
three years. The results of the rolling average calculations correspond with our assumption that
the ATOs from 2014 and 2015 were unsustainable. Even though Chipotle is investing money in
restaurant efficiency (shorter wait times1
etc.), we believe that the positive effect on revenues
will not be evident until after 2020 due to falling sales in the fast casual dining industry. Once
asset turnover was calculated we used sales/ATO in order to calculate the forecasted net
operating assets which we believe will increase by 6.4% in 2018 due to the growth in sales and
the slight decline in ATO.
Next we forecasted net financial assets by calculating the rolling average of cash and short term
investments, since there is no reason to believe that Chipotle will invest in more AFS securities
since they sold almost all of their long term investments at loss in 2017. We predict that short
term investments and cash line items will adjust similarly to their value prior to 2016,
considering that 2016 was an unusually off year for Chipotle. Accordingly, we believe that
Chipotle’s net financial assets will begin to recover to values close to 2015, but with the lack of
long term investments it is unlikely that they will ever fully recover.
Cash Flow Items
Once net operating assets (NOA) were forecasted, we were able to subtract the change in NOA
from the forecasted operating income in order to get the Free Cash Flow. Free Cash Flow (FCF)
1
“Press Release.” Chipotle Investor Relations. 6 Feb 2018. http://ir.chipotle.com/news-releases/news-
release-details/chipotle-fourth-quarter-earnings-share-grows-182-155-revenue
is the basis for the cash flow statement because Chipotle does not utilize debt financing and pays
no dividends. Our predicted net decrease in FCF in 2018 makes sense because Chipotle is
reinvesting capital in order to make improvements to stores and researching how to optimize
energy uses. Therefore, while research and development are important to Chipotle in order to
cement their status as an industry leader, it does not reflect well on the company’s FCF.
Additionally, we are not certain if Chipotle plans to keep making improvements in their stores,
so we maintain that Chipotle’s FCF will recover at a medium rate.
IX. VALUATION
In calculating our belief of the value per share of Chipotle’s stock, we used three valuation
models: discounted cash flow (DCF), residual earnings (RE), and residual operating income
(ReOI). We believe that these three models provide the best estimation of the current value of the
firm based on value driving activities. In calculating a target price, we used a weighted average
of the three models in determining the ultimate price. The weights that were put on each model
were 15% for DCF, 15% for RE, and 70% for ReOI. Emphasis was placed primarily on the ReOI
model because it utilizes information from the reformulated statements more so than the other
two models and we believe it most accurately reflects the value of the firm for this reason.
Residual Operating Income (ReOI)
ReOI for the years 2018, 2019, and 2020 was calculated by multiplying the prior years ReOI by
1+the anticipated growth rate of 5.4%. The prospective years’ ReOI was discounted to present
using the cost of capital of 7.11%. The continuing value of ReOI was calculated using the 2.79%
growth rate to forecast out to year 2021. This was then discounted using the same cost of capital
as before to make it in terms of present value. The sum of the present value of future ReOIs,
added to the 2017 actual ReOI, plus common shareholders’ equity results in our estimation of the
enterprise value of Chipotle. We next added in the book value of NFA from the reformulated
balance sheet to derive the value of common equity. Lastly, common equity was divided by the
number of diluted shares outstanding resulting in a target price of $188.22 for this model.
Residual Earnings (RE)
The RE model resulted in a similar, but slightly lower valuation per share compared to the ReOI
model. The model inherently fails to capture the value that can be generated from a share
repurchase or issue at a price that is different from fair value. For that reason it provides a less
accurate and lower valuation of the value per share.
Discounted Cash Flows (DCF)
Free cash flows were not given in Chipotle’s financial statements, however, we were able to
calculate them historically using operating income less the change in net operating assets. Pro
forma analysis was used to forecast out future free cash flows. The DCF model provides a lower
valuation of Chipotle compared to the other two models. There are inherent limitations to the
model resulting in us putting lesser weight on its valuation. The DCF model does not measure
value added from operations as effectively as the ReOI model.
Target Price
After completing the three valuation models and applying the weights to each model, we find
Chipotle’s stock to be worth $175.11 per share. This is significantly lower than the market value
per share which closed on April 6th at $318.07 per share. Given the information and our
calculation of Chipotle’s per share
price versus that of the market we
recommend an investor to take a
sell position on Chipotle.
Sensitivity Analysis
The sensitivity analysis isolates those variables impacting valuation and record the range of
possible outcomes. It is of great importance to know how sensitive our target price is to the
change in our assumptions. Therefore, we ran a sensitivity analysis for our target price by
adjusting our discount rate and revenue growth rate. The sensitivity analysis revealed that our
target price could only be justified if the discount rate stays at 7% level. That means our model is
pretty sensitive to our assumption. However, since the range of all possible target prices are
much lower than the current share price $318.07, we would not worry that much about its impact
on our final recommendations.
X. ACCOUNTING QUALITY
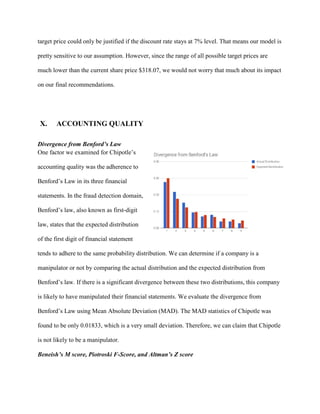
Divergence from Benford’s Law
One factor we examined for Chipotle’s
accounting quality was the adherence to
Benford’s Law in its three financial
statements. In the fraud detection domain,
Benford’s law, also known as first-digit
law, states that the expected distribution
of the first digit of financial statement
tends to adhere to the same probability distribution. We can determine if a company is a
manipulator or not by comparing the actual distribution and the expected distribution from
Benford’s law. If there is a significant divergence between these two distributions, this company
is likely to have manipulated their financial statements. We evaluate the divergence from
Benford’s Law using Mean Absolute Deviation (MAD). The MAD statistics of Chipotle was
found to be only 0.01833, which is a very small deviation. Therefore, we can claim that Chipotle
is not likely to be a manipulator.
Beneish’s M score, Piotroski F-Score, and Altman’s Z score
Beneish’s model, generated from eight financial vitals, is used to determine whether a company
is a manipulator. The result, called M-Score, describes the degree to which the earnings have
been manipulated. The zones of discrimination for M-Score is as such: An M-Score of less than -
2.22 suggests that the company is not an accounting manipulator; An M-Score of greater than -
2.22 signals that the company is likely an accounting manipulator. According to GuruFocus,
Chipotle’s M-Score is -3.42, which means that the Chipotle is not likely to be an accounting
manipulator.
We also look at Piotroski’s F score to assess Chipotle’s financial health condition. The Piotroski
F score is a discrete score from 0-9 which captures 9 criteria used to assess a firm’s strength in
financial position. F score 7, 8, 9 are considered high scores or great financial position , while F
score 0,1,2,3 are considered low scores or poor financial position. According to GuruFocus, the
F score of Chipotle is 9, indicating a very healthy financial position. Looking at the historical
trend of the firm over the past 13 years, the highest Piotroski F-Score of Chipotle was 9, the
lowest was 5 and the median was 7. That means Chipotle has been in a very good financial
condition not only in short term but also in long term perspective. Comparing Piotroski’s F score
with its peers, we found that Chipotle is the best value firm with nearly 4 points higher than the
industry average.
We use the Altman Z-score to assess a firm’s likelihood of bankruptcy. The Altman Z-score is
based on 5 ratios including profitability, leverage, liquidity, solvency and activity to predict
whether a company is likely to go bankrupt. The zones of discrimination were as such: When Z-
Score is less than 1.81, it is in Distress Zones; When Z-Score is greater than 2.99, it is in Safe
Zones; When Z-Score is between 1.81 and 2.99, it is in Grey Zones.According to GuruFocus, the
Altman’s Z score of Chipotle is 12.34, which means that it is in an extremely good condition and
very unlikely to go bankrupt. Compared to 3.694, the industry average of Altman Z-score,
Chipotle is way ahead.
Comparison of Earnings and Cash Flow from Operations
Another red flag of accounting quality is the disparity between earnings and cash flow from
operation because of large accruals.
As you can see in the figure, the general trend of comprehensive income, net income and cash
flow from operation seems be consistent. In addition, cash flow from operation is higher than net
income and comprehensive income. Therefore, we can be confident to say that Chipotle is not
attempting to inflate net income by recognizing large accruals.
Off-balance Sheet Arrangement
To assess the accounting quality of a firm, we also look at Chipotle’s leases classification
method. Generally, there are two accounting method in leases: operating and capital lease.
Operating lease is more like rental contract where the asset stays off the balance sheet. Capital
lease is treated as a loan where the asset is considered as being owned by the lessee therefore it
stays on the balance sheet. The different accounting treatment on these two lease categories can
have significant impact on taxes. Chipotle treats the vast majority of their leases as capital lease,
meaning that they are kept on the balance sheet. There are a couple of advantages to adopt
capital lease method. First of all, capital leases recognize expense earlier. Second, it is allowed to
claim depreciation on the asset.Third, the interest expense can be deducted as operating expense.
Dirty-Surplus Accounting
Major dirty surplus items are
gains and losses on foreign
currency translation, gains and
losses on derivative instrument,
and unrealized gains and losses
on available-for-sale securities.
In our reformulated income
statement, we already take these items into consideration. We compared net income and
comprehensive income to see the net effect of these dirty surplus items. As you can see in the
figure above, there is very little difference between net income and comprehensive income.
Therefore, dirty surplus has very little impact on Chipotle’s valuation.
Cherry Picking
Cherry Picking is the practice of selling securities to realize gains in years when operating
income is low, while retaining securities whose price have declined so that the related losses are
only included in the statement of equity. According to its 10-K filing, “Chipotle had no realized
gains or losses for the years ended December 31, 2017 and 2015, and $547 of realized gains on
available-for-sale securities for the year ended December 31, 2016. Realized gains and losses on
available-for-sale securities are recorded in interest and other income on the consolidated
statement of income. During the year ended December 31, 2015, Chipotle recorded an other-
than-temporary impairment charge of $244 in interest and other income in the consolidated
statement of income in connection with a decline in the fair market value of certain available-for-
sale securities.” Therefore, there is little evidence of Chipotle cherry picking appreciated
investments or holding onto depreciated investments. To summarize, Chipotle has not only a
good accounting quality, but also a very good financial position.
XI. APPENDIX
Works Cited:
www.diffen.com
www.investopedia.com
GuruFocus.com
Bloomberg Terminal
http://people.stern.nyu.edu/adamodar/New_Home_Page/datafile/wacc.htm
“Chipotle Mexican Grill Inc's.” Chipotle Mexican Grill Inc Comparisons to Its Competitors,
Market Share and Competitiveness by Segment. CISMarket, Inc.,
csimarket.com/stocks/compet_glance.php?code=CMG.
“Zacks Industry Outlook Highlights: Chipotle Mexican Grill, Jack in the Box, Brinker
International, Red Robin Gourmet Burgers and Starbucks.” NASDAQ.com, Zacks Equity
Research, 16 Aug. 2017<www.nasdaq.com/article/zacks-industry-outlook-highlights-chipotle-
mexican-grill-jack-in-the-box-brinker-international-red-robin-gourmet-burgers-and-starbucks-
cm832722>
Transcripts, SA. “Chipotle Mexican Grill (CMG) Q4 2017 Results - Earnings Call Transcript.”
Seeking Alpha, 7 Feb. 2018, <seekingalpha.com/article/4143818-chipotle-mexican-grill-cmg-q4-
2017-results-earnings-call-transcript?page=1>
“Our Company.” Chipotle, 2018, <www.chipotle.com/company>
Patton, Leslie. “America's Fast-Casual Dining Boom Is Over.” Bloomberg.com, Bloomberg, 1
June 2017, www.bloomberg.com/news/articles/2017-06-01/chipotle-potbelly-qdoba-are-sinking-
into-fast-casual-malaise
“Mexican Restaurants Industry at a Glance.” IBIS World US, IBIS World, 2018,
clients1.ibisworld.com/reports/us/industry/ataglance.aspx?indid=4305.
“Fast Food Restaurants Industry at a Glance.” IBIS World US, IBIS World, 2018,
clients1.ibisworld.com/reports/us/industry/ataglance.aspx?indid=1980.
Jaaskelainen, Liisa. “Topic: Chipotle Mexican Grill.” Www.statista.com, Statista, 2018,
www.statista.com/topics/2717/chipotle-mexican-grill/.
“Press Release.”Chipotle Investor Relations. 6 Feb 2018. http://ir.chipotle.com/news-
releases/news-release-details/chipotle-fourth-quarter-earnings-share-grows-182-155-revenue

More Related Content

What's hot

Chipotle Pitch Brief
Chipotle Pitch BriefChipotle Pitch Brief
Chipotle Pitch Brief
Cubeyou Inc
 
Chipotle Marketing Plan
Chipotle Marketing PlanChipotle Marketing Plan
Chipotle Marketing Plan
Tony Chang
 
Chipotle - Marketing Strategy
Chipotle - Marketing StrategyChipotle - Marketing Strategy
Chipotle - Marketing StrategyJulie Kromar
 
Chipotle Case 2016
Chipotle Case 2016Chipotle Case 2016
Chipotle Case 2016Curt Cordray
 
Beyond Meat - EECS 441 Company Presentation W20
Beyond Meat - EECS 441 Company Presentation W20Beyond Meat - EECS 441 Company Presentation W20
Beyond Meat - EECS 441 Company Presentation W20
Gautham Ravi
 
Chipotle Balanced Scorecard Paper
Chipotle Balanced Scorecard PaperChipotle Balanced Scorecard Paper
Chipotle Balanced Scorecard Paper
Villanova University
 
Chipotle mexican grill
Chipotle mexican grillChipotle mexican grill
Chipotle mexican grillMoMu Jung
 
McDonald's Case Study
McDonald's Case Study McDonald's Case Study
McDonald's Case Study
Jasjit Singh
 
FMCG Industry
FMCG IndustryFMCG Industry
FMCG Industry
Bir Singh
 
Market Analysis For Fast Food Chain Market in Cambodia, Laos, Myanmar and Vie...
Market Analysis For Fast Food Chain Market in Cambodia, Laos, Myanmar and Vie...Market Analysis For Fast Food Chain Market in Cambodia, Laos, Myanmar and Vie...
Market Analysis For Fast Food Chain Market in Cambodia, Laos, Myanmar and Vie...
Canvassco
 
Chipotle brand audit paper [final copy]
Chipotle brand audit paper [final copy]Chipotle brand audit paper [final copy]
Chipotle brand audit paper [final copy]Qijiao Fan
 
Social media case study: Coco Cola FIFA Activity
Social media case study: Coco Cola FIFA ActivitySocial media case study: Coco Cola FIFA Activity
Social media case study: Coco Cola FIFA Activity
Social Samosa
 
Chipotle presentation (1)
Chipotle presentation  (1)Chipotle presentation  (1)
Chipotle presentation (1)
Katerina Karpova
 
Cola wars continue coke and pepsi in 2006-1
Cola wars continue   coke and pepsi in 2006-1Cola wars continue   coke and pepsi in 2006-1
Cola wars continue coke and pepsi in 2006-1Hye Joo Lee
 
The Case Analysis: Benihana of Tokyo
The Case Analysis: Benihana of TokyoThe Case Analysis: Benihana of Tokyo
The Case Analysis: Benihana of Tokyo
Luqman Praditio
 
Strategic Analysis of the Grocery Industry
Strategic Analysis of the Grocery IndustryStrategic Analysis of the Grocery Industry
Strategic Analysis of the Grocery Industry
Tayler Reid
 
Cola Wars Continue: Coke and Pepsi in 2010
Cola Wars Continue: Coke and Pepsi in 2010Cola Wars Continue: Coke and Pepsi in 2010
Cola Wars Continue: Coke and Pepsi in 2010
Sharon
 

What's hot (20)

Chipotle Pitch Brief
Chipotle Pitch BriefChipotle Pitch Brief
Chipotle Pitch Brief
 
Chipotle Marketing Plan
Chipotle Marketing PlanChipotle Marketing Plan
Chipotle Marketing Plan
 
Chipotle - Marketing Strategy
Chipotle - Marketing StrategyChipotle - Marketing Strategy
Chipotle - Marketing Strategy
 
SWOT of Chipotle Restaurants_July 2016
SWOT of Chipotle Restaurants_July 2016SWOT of Chipotle Restaurants_July 2016
SWOT of Chipotle Restaurants_July 2016
 
Chipotle Case 2016
Chipotle Case 2016Chipotle Case 2016
Chipotle Case 2016
 
Beyond Meat - EECS 441 Company Presentation W20
Beyond Meat - EECS 441 Company Presentation W20Beyond Meat - EECS 441 Company Presentation W20
Beyond Meat - EECS 441 Company Presentation W20
 
Chipotle Balanced Scorecard Paper
Chipotle Balanced Scorecard PaperChipotle Balanced Scorecard Paper
Chipotle Balanced Scorecard Paper
 
Chipotle mexican grill
Chipotle mexican grillChipotle mexican grill
Chipotle mexican grill
 
Chipotle ppt
Chipotle pptChipotle ppt
Chipotle ppt
 
McDonald's Case Study
McDonald's Case Study McDonald's Case Study
McDonald's Case Study
 
FMCG Industry
FMCG IndustryFMCG Industry
FMCG Industry
 
Market Analysis For Fast Food Chain Market in Cambodia, Laos, Myanmar and Vie...
Market Analysis For Fast Food Chain Market in Cambodia, Laos, Myanmar and Vie...Market Analysis For Fast Food Chain Market in Cambodia, Laos, Myanmar and Vie...
Market Analysis For Fast Food Chain Market in Cambodia, Laos, Myanmar and Vie...
 
Chipotle brand audit paper [final copy]
Chipotle brand audit paper [final copy]Chipotle brand audit paper [final copy]
Chipotle brand audit paper [final copy]
 
Social media case study: Coco Cola FIFA Activity
Social media case study: Coco Cola FIFA ActivitySocial media case study: Coco Cola FIFA Activity
Social media case study: Coco Cola FIFA Activity
 
Chipotle presentation (1)
Chipotle presentation  (1)Chipotle presentation  (1)
Chipotle presentation (1)
 
CVS case
CVS caseCVS case
CVS case
 
Cola wars continue coke and pepsi in 2006-1
Cola wars continue   coke and pepsi in 2006-1Cola wars continue   coke and pepsi in 2006-1
Cola wars continue coke and pepsi in 2006-1
 
The Case Analysis: Benihana of Tokyo
The Case Analysis: Benihana of TokyoThe Case Analysis: Benihana of Tokyo
The Case Analysis: Benihana of Tokyo
 
Strategic Analysis of the Grocery Industry
Strategic Analysis of the Grocery IndustryStrategic Analysis of the Grocery Industry
Strategic Analysis of the Grocery Industry
 
Cola Wars Continue: Coke and Pepsi in 2010
Cola Wars Continue: Coke and Pepsi in 2010Cola Wars Continue: Coke and Pepsi in 2010
Cola Wars Continue: Coke and Pepsi in 2010
 

Similar to Chipotle valuation project.pdf

Chipotle Equity Analysis_An Expensive Burrito?
Chipotle Equity Analysis_An Expensive Burrito?Chipotle Equity Analysis_An Expensive Burrito?
Chipotle Equity Analysis_An Expensive Burrito?
Brian Christopher
 
Restaurant Quarterly Update - Fall 2018
Restaurant Quarterly Update - Fall 2018Restaurant Quarterly Update - Fall 2018
Restaurant Quarterly Update - Fall 2018
Duff & Phelps
 
Initial Valuation Report Chipotle Mexican Grill, Inc.docx
Initial Valuation Report Chipotle Mexican Grill, Inc.docxInitial Valuation Report Chipotle Mexican Grill, Inc.docx
Initial Valuation Report Chipotle Mexican Grill, Inc.docx
carliotwaycave
 
P13-3AWHITLOCK COMPANY Income Statement For the Year Ended N.docx
P13-3AWHITLOCK COMPANY Income Statement For the Year Ended N.docxP13-3AWHITLOCK COMPANY Income Statement For the Year Ended N.docx
P13-3AWHITLOCK COMPANY Income Statement For the Year Ended N.docx
alfred4lewis58146
 
Kraft Heinz Investment Memo - Hamidi
Kraft Heinz Investment Memo - HamidiKraft Heinz Investment Memo - Hamidi
Kraft Heinz Investment Memo - Hamidi
Achraf Hamidi
 
Eight30 Luxury.pdf
Eight30 Luxury.pdfEight30 Luxury.pdf
Eight30 Luxury.pdf
JanaGough
 
[Document title]ContentsCurrent State of Dunkin Donuts.docx
[Document title]ContentsCurrent State of Dunkin Donuts.docx[Document title]ContentsCurrent State of Dunkin Donuts.docx
[Document title]ContentsCurrent State of Dunkin Donuts.docx
danielfoster65629
 
Cole Howie - Chipotle Case
Cole Howie - Chipotle CaseCole Howie - Chipotle Case
Cole Howie - Chipotle CaseCole Howie
 
Consumer Foodservice in Colombia
Consumer Foodservice in ColombiaConsumer Foodservice in Colombia
Consumer Foodservice in ColombiaReportsnReports
 
Chipotle Case
Chipotle CaseChipotle Case
Chipotle Case
Angela Weber
 
Restaurant Brands International Buy Recommendation
Restaurant Brands International Buy RecommendationRestaurant Brands International Buy Recommendation
Restaurant Brands International Buy RecommendationLucas Diniz
 
Restaurant Quarterly Update June 2018
Restaurant Quarterly Update June 2018Restaurant Quarterly Update June 2018
Restaurant Quarterly Update June 2018
Duff & Phelps
 
Supply Chain Metrics That Matter: A Focus on Food & Beverage Companies 2017
Supply Chain Metrics That Matter: A Focus on Food & Beverage Companies 2017Supply Chain Metrics That Matter: A Focus on Food & Beverage Companies 2017
Supply Chain Metrics That Matter: A Focus on Food & Beverage Companies 2017
Lora Cecere
 
FIN 461: Sprouts
FIN 461: SproutsFIN 461: Sprouts
FIN 461: Sprouts
Zach Narcross
 
tyson foods 2008 Annual Report
tyson foods  2008 Annual Report tyson foods  2008 Annual Report
tyson foods 2008 Annual Report finance9
 
Tyson 2008 Annual Report
Tyson 2008 Annual ReportTyson 2008 Annual Report
Tyson 2008 Annual Report
earningsreport
 
Implementation, Strategy Controls and ContingencyRunni.docx
Implementation, Strategy Controls and ContingencyRunni.docxImplementation, Strategy Controls and ContingencyRunni.docx
Implementation, Strategy Controls and ContingencyRunni.docx
bradburgess22840
 

Similar to Chipotle valuation project.pdf (20)

Final CMG Report
Final CMG ReportFinal CMG Report
Final CMG Report
 
Chipotle Equity Analysis_An Expensive Burrito?
Chipotle Equity Analysis_An Expensive Burrito?Chipotle Equity Analysis_An Expensive Burrito?
Chipotle Equity Analysis_An Expensive Burrito?
 
Restaurant Quarterly Update - Fall 2018
Restaurant Quarterly Update - Fall 2018Restaurant Quarterly Update - Fall 2018
Restaurant Quarterly Update - Fall 2018
 
Final Chipotle Report
Final Chipotle ReportFinal Chipotle Report
Final Chipotle Report
 
Initial Valuation Report Chipotle Mexican Grill, Inc.docx
Initial Valuation Report Chipotle Mexican Grill, Inc.docxInitial Valuation Report Chipotle Mexican Grill, Inc.docx
Initial Valuation Report Chipotle Mexican Grill, Inc.docx
 
P13-3AWHITLOCK COMPANY Income Statement For the Year Ended N.docx
P13-3AWHITLOCK COMPANY Income Statement For the Year Ended N.docxP13-3AWHITLOCK COMPANY Income Statement For the Year Ended N.docx
P13-3AWHITLOCK COMPANY Income Statement For the Year Ended N.docx
 
Kraft Heinz Investment Memo - Hamidi
Kraft Heinz Investment Memo - HamidiKraft Heinz Investment Memo - Hamidi
Kraft Heinz Investment Memo - Hamidi
 
Eight30 Luxury.pdf
Eight30 Luxury.pdfEight30 Luxury.pdf
Eight30 Luxury.pdf
 
Tung Anh Nguyen's Writing Sample 1
Tung Anh Nguyen's Writing Sample 1Tung Anh Nguyen's Writing Sample 1
Tung Anh Nguyen's Writing Sample 1
 
[Document title]ContentsCurrent State of Dunkin Donuts.docx
[Document title]ContentsCurrent State of Dunkin Donuts.docx[Document title]ContentsCurrent State of Dunkin Donuts.docx
[Document title]ContentsCurrent State of Dunkin Donuts.docx
 
Cole Howie - Chipotle Case
Cole Howie - Chipotle CaseCole Howie - Chipotle Case
Cole Howie - Chipotle Case
 
Consumer Foodservice in Colombia
Consumer Foodservice in ColombiaConsumer Foodservice in Colombia
Consumer Foodservice in Colombia
 
Chipotle Case
Chipotle CaseChipotle Case
Chipotle Case
 
Restaurant Brands International Buy Recommendation
Restaurant Brands International Buy RecommendationRestaurant Brands International Buy Recommendation
Restaurant Brands International Buy Recommendation
 
Restaurant Quarterly Update June 2018
Restaurant Quarterly Update June 2018Restaurant Quarterly Update June 2018
Restaurant Quarterly Update June 2018
 
Supply Chain Metrics That Matter: A Focus on Food & Beverage Companies 2017
Supply Chain Metrics That Matter: A Focus on Food & Beverage Companies 2017Supply Chain Metrics That Matter: A Focus on Food & Beverage Companies 2017
Supply Chain Metrics That Matter: A Focus on Food & Beverage Companies 2017
 
FIN 461: Sprouts
FIN 461: SproutsFIN 461: Sprouts
FIN 461: Sprouts
 
tyson foods 2008 Annual Report
tyson foods  2008 Annual Report tyson foods  2008 Annual Report
tyson foods 2008 Annual Report
 
Tyson 2008 Annual Report
Tyson 2008 Annual ReportTyson 2008 Annual Report
Tyson 2008 Annual Report
 
Implementation, Strategy Controls and ContingencyRunni.docx
Implementation, Strategy Controls and ContingencyRunni.docxImplementation, Strategy Controls and ContingencyRunni.docx
Implementation, Strategy Controls and ContingencyRunni.docx
 

More from Yexin (Olivia) Wan

ZION Equity Research Report
ZION Equity Research ReportZION Equity Research Report
ZION Equity Research Report
Yexin (Olivia) Wan
 
Bloomberg Market Concept Certificate_Yexin Wan
Bloomberg Market Concept Certificate_Yexin WanBloomberg Market Concept Certificate_Yexin Wan
Bloomberg Market Concept Certificate_Yexin Wan
Yexin (Olivia) Wan
 
BMC Certificate_Yexin Wan
BMC Certificate_Yexin WanBMC Certificate_Yexin Wan
BMC Certificate_Yexin Wan
Yexin (Olivia) Wan
 
CTA Certificate
CTA CertificateCTA Certificate
CTA Certificate
Yexin (Olivia) Wan
 
Ascend Certificate
Ascend CertificateAscend Certificate
Ascend Certificate
Yexin (Olivia) Wan
 
Certificate of Completion
Certificate of CompletionCertificate of Completion
Certificate of Completion
Yexin (Olivia) Wan
 
PwC Case Challenge 2015 Report Summary
PwC Case Challenge 2015 Report SummaryPwC Case Challenge 2015 Report Summary
PwC Case Challenge 2015 Report Summary
Yexin (Olivia) Wan
 

More from Yexin (Olivia) Wan (7)

ZION Equity Research Report
ZION Equity Research ReportZION Equity Research Report
ZION Equity Research Report
 
Bloomberg Market Concept Certificate_Yexin Wan
Bloomberg Market Concept Certificate_Yexin WanBloomberg Market Concept Certificate_Yexin Wan
Bloomberg Market Concept Certificate_Yexin Wan
 
BMC Certificate_Yexin Wan
BMC Certificate_Yexin WanBMC Certificate_Yexin Wan
BMC Certificate_Yexin Wan
 
CTA Certificate
CTA CertificateCTA Certificate
CTA Certificate
 
Ascend Certificate
Ascend CertificateAscend Certificate
Ascend Certificate
 
Certificate of Completion
Certificate of CompletionCertificate of Completion
Certificate of Completion
 
PwC Case Challenge 2015 Report Summary
PwC Case Challenge 2015 Report SummaryPwC Case Challenge 2015 Report Summary
PwC Case Challenge 2015 Report Summary
 

Recently uploaded

Attending a job Interview for B1 and B2 Englsih learners
Attending a job Interview for B1 and B2 Englsih learnersAttending a job Interview for B1 and B2 Englsih learners
Attending a job Interview for B1 and B2 Englsih learners
Erika906060
 
Putting the SPARK into Virtual Training.pptx
Putting the SPARK into Virtual Training.pptxPutting the SPARK into Virtual Training.pptx
Putting the SPARK into Virtual Training.pptx
Cynthia Clay
 
anas about venice for grade 6f about venice
anas about venice for grade 6f about veniceanas about venice for grade 6f about venice
anas about venice for grade 6f about venice
anasabutalha2013
 
20240425_ TJ Communications Credentials_compressed.pdf
20240425_ TJ Communications Credentials_compressed.pdf20240425_ TJ Communications Credentials_compressed.pdf
20240425_ TJ Communications Credentials_compressed.pdf
tjcomstrang
 
LA HUG - Video Testimonials with Chynna Morgan - June 2024
LA HUG - Video Testimonials with Chynna Morgan - June 2024LA HUG - Video Testimonials with Chynna Morgan - June 2024
LA HUG - Video Testimonials with Chynna Morgan - June 2024
Lital Barkan
 
Tata Group Dials Taiwan for Its Chipmaking Ambition in Gujarat’s Dholera
Tata Group Dials Taiwan for Its Chipmaking Ambition in Gujarat’s DholeraTata Group Dials Taiwan for Its Chipmaking Ambition in Gujarat’s Dholera
Tata Group Dials Taiwan for Its Chipmaking Ambition in Gujarat’s Dholera
Avirahi City Dholera
 
3.0 Project 2_ Developing My Brand Identity Kit.pptx
3.0 Project 2_ Developing My Brand Identity Kit.pptx3.0 Project 2_ Developing My Brand Identity Kit.pptx
3.0 Project 2_ Developing My Brand Identity Kit.pptx
tanyjahb
 
RMD24 | Retail media: hoe zet je dit in als je geen AH of Unilever bent? Heid...
RMD24 | Retail media: hoe zet je dit in als je geen AH of Unilever bent? Heid...RMD24 | Retail media: hoe zet je dit in als je geen AH of Unilever bent? Heid...
RMD24 | Retail media: hoe zet je dit in als je geen AH of Unilever bent? Heid...
BBPMedia1
 
amptalk_RecruitingDeck_english_2024.06.05
amptalk_RecruitingDeck_english_2024.06.05amptalk_RecruitingDeck_english_2024.06.05
amptalk_RecruitingDeck_english_2024.06.05
marketing317746
 
Improving profitability for small business
Improving profitability for small businessImproving profitability for small business
Improving profitability for small business
Ben Wann
 
falcon-invoice-discounting-a-premier-platform-for-investors-in-india
falcon-invoice-discounting-a-premier-platform-for-investors-in-indiafalcon-invoice-discounting-a-premier-platform-for-investors-in-india
falcon-invoice-discounting-a-premier-platform-for-investors-in-india
Falcon Invoice Discounting
 
Affordable Stationery Printing Services in Jaipur | Navpack n Print
Affordable Stationery Printing Services in Jaipur | Navpack n PrintAffordable Stationery Printing Services in Jaipur | Navpack n Print
Affordable Stationery Printing Services in Jaipur | Navpack n Print
Navpack & Print
 
Maksym Vyshnivetskyi: PMO Quality Management (UA)
Maksym Vyshnivetskyi: PMO Quality Management (UA)Maksym Vyshnivetskyi: PMO Quality Management (UA)
Maksym Vyshnivetskyi: PMO Quality Management (UA)
Lviv Startup Club
 
Memorandum Of Association Constitution of Company.ppt
Memorandum Of Association Constitution of Company.pptMemorandum Of Association Constitution of Company.ppt
Memorandum Of Association Constitution of Company.ppt
seri bangash
 
Introduction to Amazon company 111111111111
Introduction to Amazon company 111111111111Introduction to Amazon company 111111111111
Introduction to Amazon company 111111111111
zoyaansari11365
 
Meas_Dylan_DMBS_PB1_2024-05XX_Revised.pdf
Meas_Dylan_DMBS_PB1_2024-05XX_Revised.pdfMeas_Dylan_DMBS_PB1_2024-05XX_Revised.pdf
Meas_Dylan_DMBS_PB1_2024-05XX_Revised.pdf
dylandmeas
 
What are the main advantages of using HR recruiter services.pdf
What are the main advantages of using HR recruiter services.pdfWhat are the main advantages of using HR recruiter services.pdf
What are the main advantages of using HR recruiter services.pdf
HumanResourceDimensi1
 
April 2024 Nostalgia Products Newsletter
April 2024 Nostalgia Products NewsletterApril 2024 Nostalgia Products Newsletter
April 2024 Nostalgia Products Newsletter
NathanBaughman3
 
Cree_Rey_BrandIdentityKit.PDF_PersonalBd
Cree_Rey_BrandIdentityKit.PDF_PersonalBdCree_Rey_BrandIdentityKit.PDF_PersonalBd
Cree_Rey_BrandIdentityKit.PDF_PersonalBd
creerey
 
Discover the innovative and creative projects that highlight my journey throu...
Discover the innovative and creative projects that highlight my journey throu...Discover the innovative and creative projects that highlight my journey throu...
Discover the innovative and creative projects that highlight my journey throu...
dylandmeas
 

Recently uploaded (20)

Attending a job Interview for B1 and B2 Englsih learners
Attending a job Interview for B1 and B2 Englsih learnersAttending a job Interview for B1 and B2 Englsih learners
Attending a job Interview for B1 and B2 Englsih learners
 
Putting the SPARK into Virtual Training.pptx
Putting the SPARK into Virtual Training.pptxPutting the SPARK into Virtual Training.pptx
Putting the SPARK into Virtual Training.pptx
 
anas about venice for grade 6f about venice
anas about venice for grade 6f about veniceanas about venice for grade 6f about venice
anas about venice for grade 6f about venice
 
20240425_ TJ Communications Credentials_compressed.pdf
20240425_ TJ Communications Credentials_compressed.pdf20240425_ TJ Communications Credentials_compressed.pdf
20240425_ TJ Communications Credentials_compressed.pdf
 
LA HUG - Video Testimonials with Chynna Morgan - June 2024
LA HUG - Video Testimonials with Chynna Morgan - June 2024LA HUG - Video Testimonials with Chynna Morgan - June 2024
LA HUG - Video Testimonials with Chynna Morgan - June 2024
 
Tata Group Dials Taiwan for Its Chipmaking Ambition in Gujarat’s Dholera
Tata Group Dials Taiwan for Its Chipmaking Ambition in Gujarat’s DholeraTata Group Dials Taiwan for Its Chipmaking Ambition in Gujarat’s Dholera
Tata Group Dials Taiwan for Its Chipmaking Ambition in Gujarat’s Dholera
 
3.0 Project 2_ Developing My Brand Identity Kit.pptx
3.0 Project 2_ Developing My Brand Identity Kit.pptx3.0 Project 2_ Developing My Brand Identity Kit.pptx
3.0 Project 2_ Developing My Brand Identity Kit.pptx
 
RMD24 | Retail media: hoe zet je dit in als je geen AH of Unilever bent? Heid...
RMD24 | Retail media: hoe zet je dit in als je geen AH of Unilever bent? Heid...RMD24 | Retail media: hoe zet je dit in als je geen AH of Unilever bent? Heid...
RMD24 | Retail media: hoe zet je dit in als je geen AH of Unilever bent? Heid...
 
amptalk_RecruitingDeck_english_2024.06.05
amptalk_RecruitingDeck_english_2024.06.05amptalk_RecruitingDeck_english_2024.06.05
amptalk_RecruitingDeck_english_2024.06.05
 
Improving profitability for small business
Improving profitability for small businessImproving profitability for small business
Improving profitability for small business
 
falcon-invoice-discounting-a-premier-platform-for-investors-in-india
falcon-invoice-discounting-a-premier-platform-for-investors-in-indiafalcon-invoice-discounting-a-premier-platform-for-investors-in-india
falcon-invoice-discounting-a-premier-platform-for-investors-in-india
 
Affordable Stationery Printing Services in Jaipur | Navpack n Print
Affordable Stationery Printing Services in Jaipur | Navpack n PrintAffordable Stationery Printing Services in Jaipur | Navpack n Print
Affordable Stationery Printing Services in Jaipur | Navpack n Print
 
Maksym Vyshnivetskyi: PMO Quality Management (UA)
Maksym Vyshnivetskyi: PMO Quality Management (UA)Maksym Vyshnivetskyi: PMO Quality Management (UA)
Maksym Vyshnivetskyi: PMO Quality Management (UA)
 
Memorandum Of Association Constitution of Company.ppt
Memorandum Of Association Constitution of Company.pptMemorandum Of Association Constitution of Company.ppt
Memorandum Of Association Constitution of Company.ppt
 
Introduction to Amazon company 111111111111
Introduction to Amazon company 111111111111Introduction to Amazon company 111111111111
Introduction to Amazon company 111111111111
 
Meas_Dylan_DMBS_PB1_2024-05XX_Revised.pdf
Meas_Dylan_DMBS_PB1_2024-05XX_Revised.pdfMeas_Dylan_DMBS_PB1_2024-05XX_Revised.pdf
Meas_Dylan_DMBS_PB1_2024-05XX_Revised.pdf
 
What are the main advantages of using HR recruiter services.pdf
What are the main advantages of using HR recruiter services.pdfWhat are the main advantages of using HR recruiter services.pdf
What are the main advantages of using HR recruiter services.pdf
 
April 2024 Nostalgia Products Newsletter
April 2024 Nostalgia Products NewsletterApril 2024 Nostalgia Products Newsletter
April 2024 Nostalgia Products Newsletter
 
Cree_Rey_BrandIdentityKit.PDF_PersonalBd
Cree_Rey_BrandIdentityKit.PDF_PersonalBdCree_Rey_BrandIdentityKit.PDF_PersonalBd
Cree_Rey_BrandIdentityKit.PDF_PersonalBd
 
Discover the innovative and creative projects that highlight my journey throu...
Discover the innovative and creative projects that highlight my journey throu...Discover the innovative and creative projects that highlight my journey throu...
Discover the innovative and creative projects that highlight my journey throu...
 

Chipotle valuation project.pdf

  • 1. Financial Statement Analysis Chipotle Mexican Grill Casey Boardman, Kathryn Fyffe, Michael Glomski, Robert Strauss, Yexin Wan
  • 2. TABLE OF CONTENTS Executive Summary ---------------------------------------------------------------------------------------3 Business Overview-----------------------------------------------------------------------------------------4 Industry Analysis--------------------------------------------------------------------------------------------5 Key Drivers and Trends-----------------------------------------------------------------------------------7 Competitive Position--------------------------------------------------------------------------------------11 Forecasting Sales & Growth----------------------------------------------------------------------------14 Reformulations---------------------------------------------------------------------------------------------15 Discount Rate Determination---------------------------------------------------------------------------16 Pro Forma Analysis---------------------------------------------------------------------------------------17 Valuation-----------------------------------------------------------------------------------------------------18 Sensitivity Analysis----------------------------------------------------------------------------------------20 Accounting Quality----------------------------------------------------------------------------------------21 Appendix-----------------------------------------------------------------------------------------------------26
  • 3. I. EXECUTIVE SUMMARY Chipotle Mexican Grill is the oldest fast-casual mexican restaurant specializing in burritos, tacos, salads and burrito bowls. We recommend a Sell position based on a 70% weight on our Residual Operating Income (ReOI) model, a 15% weight on our Residual Earnings (RE) model, and a 15% weight on our Discounted Cash Flow (DCF) model. Chipotle’s (CMG) current share price is $318.07. Based on our valuation the price target is $175.11. This is $142.96 under the current share price. Our revenue forecast was determined by projecting the net number of future stores opened and their projected revenue. We drew upon historical data, the current 10k, press releases, and conference call.
  • 4. II. BUSINESS OVERVIEW Chipotle Mexican Grill Inc, operating Chipotle Mexican Grill restaurants, is a quick-serve restaurant chain. Popular for their Mexican food like burritos, tacos, chips and salsa, the company owns 2,408 quick-casual eateries. These 2,408 eateries includes 2,363 Chipotle restaurants, 37 international Chipotle restaurants, and 8 non-Chipotle restaurants. The founder, Steve Ells, has placed strong emphasis on “Food with Integrity” throughout his business practice. Following classic cooking style, Chipotle devotes itself to making great food with the very best ingredients. Chipotle has pursued the mission to change the way people think about and eat fast food. Recently the company has re-envisioned their purpose, and are currently working on cultivating nourished communities where wholesome food is enjoyed every day. By the end of 2017, Chipotle had around 68,890 employees, including roughly 5,020 salaried employees and 63,870 hourly employees. None of the employees are unionized or covered by a collective bargaining agreement, which mirrors trust in management. Chipotle was on a steady path for growth, with revenues growing between 10-27%, until recent years where they hit a slump in 2016. The decline resulted from an E. coli incident that affected 52 people across several restaurants. By year end 2017, they experienced a rebound and implemented a plan to recover the brand name focusing domestically through improvements to restaurants and expanding with new ones going forward. As of April 6, 2017 Chipotle stocks were trading for $318.07/share. This means their market cap as projected by the market for 27,930,272 shares outstanding is $8.88B, while our projected market cap is about $5.05B. The company focuses on a differentiation strategy by being able to charge higher prices for their higher quality fast casual food. Younger generations and health conscious customers are their
  • 5. target market currently. Chipotle chooses to focus on incremental innovation to encourage growth by limiting new product rollouts and improving mobile ordering and second-make lines along with their catering business. Moving forward, they choose to solely focus on improving their processes instead of considering any acquisitions to keep up with the ever increasing competition. The company faces some risks in the future with suppliers. To offer quality, non- GMO ingredients Chipotle sources it’s produce and meats from local farmers. In years past, this has limited their ability to offer everything on the menu when quality falls short of their “Reasonably Raised,” expectations, and they cannot get supplies elsewhere in the time needed. Chipotle has also experienced a data breach within the last year which poses a threat of litigation expenses and loss of sales in the coming years. III. INDUSTRY ANALYSIS The restaurant industry is becoming ever complex as trends and consumer preferences change over the years. Chipotle competes with fast food chains such as McDonalds, Yum! Brands (Taco Bell, KFC, and Pizza Hut), Wendy’s, and other fast-casual joints like Potbelly and Noodles and Company. McDonald’s currently holds the largest market share at 15.2% while Yum! Brands trails at 8.4%. For comparison, Chipotle holds onto about 2.2%, and when compared to the Mexican restaurant segment, Chipotle trails with 10.8% behind the leader, Taco Bell, with 23.3%. The fast food segment of the industry has reached a mature stage and saturated the market with so many competitors. As a whole, Mexican foods only account for 8% of the market while burger and chicken restaurants account for almost half.
  • 6. In recent years, the industry has seen an increasing trend in consumer spending which is expected to continue around 1.97% as wages are expected to grow. This can be a benefit to Chipotle as their menu prices tend to be a bit higher than typical fast food chains as a result of more expensive ingredients. Another factor to consider in the industry is the healthy eating complex which represents the percentage of the recommended diet that Americans actually consume. Increases in this value indicate consumers are putting more emphasis on eating the way they should to lead healthy lives. Some price volatility with produce from natural events or more emphasis on biofuels can cause fluctuations in this number, but recently the healthy eating complex is at 67.9% and expected to grow another 1.7% over the next five years. This may continue a shift toward restaurants like Chipotle and away from fast food restaurants typically thought of as unhealthy. Narrowing down to the Mexican restaurant industry, Agricultural Price Index is an item to consider. This represents prices received by farmers for all agricultural products using 2011 price as a base year. The current index value of 90.3 represents a 3.3% decline over the past five years, but is expected to grow 1.3% in the next five years. Part of this forecast can be explained by appreciating oil prices which drive more production of ethanol and other biofuels. For the industry, a growing Agriculture Price Index means increasing prices for ingredients, thus higher operating expenses. Overall, the Mexican restaurant industry has been seeing growth in recent years as consumer preferences change and there is an ever increasing Hispanic population in the United States. Industry revenue is expected to grow 2.8% annually over the next five years.
  • 7. IV. KEY DRIVERS AND TRENDS To determine where Chipotle is headed in the future, we must also examine their historical performance through ROCE and the three levels of drivers. From the E. coli events that occurred at the end of 2015, Chipotle’s 2016 numbers are expected to dip below past performance, and 2017 numbers are a recovery year. That aside, we focus on comparing 2017 numbers to 2015 and 2014 where Chipotle was still on the path of fast growth. Previous to the event, we determined their ROCE to be around 24.5% and in 2017 Chipotle’s ROCE still has not recovered. In the first level, part of this dip can be explained in part by their inability to get RNOA back up to 0.6 as it was in previous years. As mentioned before, Chipotle is planning on rebuilding its brand through improvements to current restaurants and adding new restaurants. They opened 183 new restaurants in 2017 and haven’t seen enough return on those added assets yet, as these new locations only bring in revenue equal to 75% of existing ones. Their financial leverage is also bringing down ROCE. Chipotle is an NFA firm, therefore their FLEV value is negative. This change in FLEV after 2015 is driven by their decrease in net financial assets. In 2017, Chipotle made the decision to sell off all of their long term investments, which caused the decline in NFA. Overall however, their ROCE has rebounded some from 2016 and is still holding strong at 17.1% compared to some competitors mentioned later on, but they may not be on the same path of growth as before. In addition, we do not need to worry about issues inflating ROCE, such as large dividend payouts, because Chipotle does not pay out dividends.
  • 8. Narrowing down further, we analyze the influences of RNOA and what may be causing the decline. The most notable change comes from profit margin ratio which represents the operating income from sales over total sales. It is concerning that profit margin is decreasing especially when Chipotle just finished the last round of price increases in January. As discussed by management, food expenses actually decreased in 2017 from 35.3% to 34.2% as a result of the price increases, cheaper avocados, and improved management of paper and packaging inventories. This should have improved profit margin, however, the company is facing extra expenses related to the E. coli outbreak and the data security breach that happened in March of 2017. We examine profit margin further in the following paragraph. The company’s ATO is quite volatile, but remains high due to their low profit margins. Breaking down the profit margin in the 3rd level further narrows our focus to what is causing the changes we see in 2017’s ROCE. The sales PM in the last two years is less than half of what it was pre-2016. This was to be expected in 2016, but 2017 did not rebound as much as we would have liked to see. Sales PM is equal to the gross margin ratio minus all other expense ratios
  • 9. listed, which are all related to operating income. There is not a significant change in GM ratio other than what is expected with recent events. The change in Sales PM comes from an increase in advertising and marketing and other operating expenses. Chipotle typically does not roll out new menu items, but in an attempt to bring sales back up, they introduced chorizo in the past and most recently, queso in 2017. These releases initiated more spending on advertising, as if trying to follow their competitor Taco Bell. Taco Bell is known for rolling out products continuously and heavily advertises these rollouts. However, the most influential part of the change in Sales PM results from increasing “other” operating expenses. In 2017, these equated to 14.6% of sales, compared to 11.4% back in 2015. As stated in the 10-K, other operating income for Chipotle includes some promotional costs, bank and credit card fees, and restaurant and utilities maintenance expenses. Chipotle estimates their cost of promotions such as free food offerings and coupons through historical patterns (i.e. percent actually used, etc.). Chipotle ran a promotional rewards program, Chiptopia, where members could earn free burritos after so many purchases in a specified timespan. This greatly added to their increased cost of other operating expenses in 2017, a reason why they are no longer offering it. Looking forward, we expect Chipotle to continue struggling to improve their profit margins. Although the tax ratio is expected to decrease with the recent change in corporate tax law, a focus on new location openings will impact pre-opening expense ratio, ad and marketing expense, and G&A expenses. Other operating expenses will increase with the added renovations to existing locations. Management anticipates making improvements to most of their locations, spending between $10,000 and $20,000 per restaurant in maintenance expense. Chipotle is also facing several lawsuits as a result of the security breach in early 2017, and may have added
  • 10. expenses related to the outcome of each. The company also has plans to make improvements to second-make lines in quite a few restaurants to help with the trends they are seeing in mobile ordering. Currently, this is one of the biggest areas of growth, with 50% growth over the previous year. Overall, we do not anticipate much of an improvement in profit margin within the next few years. V. COMPETITIVE POSITION In comparing Chipotle with it competitors on a strict Revenue growth metric over the past three years it is apparent that Chipotle is performing the best. There was a significant decrease in growth in 2016 because of the E-coli scare but the firm rebounded well to essentially show growth in the low single digit percentages, a trend we forecast into the future. Each other firm demonstrated a decrease in revenue growth perhaps due to the consumer’s choosing to return to
  • 11. Chipotle in 2017 after they began to re-establish trust with the customer. However, a revenue growth metric is not enough to imply that Chipotle has potential to be the best fast-food/fast casual firm in their industry. Diving deeper into the vital ratios of the industry we find that to determine the best firm in the industry is far more convoluted. Wendy’s, McDonald’s and Yum! Brands all have much higher profit margins than Chipotle. These firms are turning a lot more of their revenue into net income. This could be due to the fact that these firms are far older than Chipotle and in the case of McDonald’s and Yum! Brands far larger. That being said Chipotle performs better than everyone except Yum! Brands on ROA. It does not look like any of the firms will have issue paying off debt because of their high and positive Current Ratios. We considered that Chipotle’s main and direct competitors would be Wendy’s, Potbelly, and Noodles. These companies are a lot closer to the perceived healthy, fast casual market that Chipotle attracts. They are also far closer in menu price than that of Taco Bell within Yum! Brands and McDonald’s who strive for cost leadership. Looking closer at these firms, it is apparent that Wendy’s holds the top spot within this specific ratio analysis. Chipotle holds the second place position followed by Potbelly and Noodles. Due to Noodles having a net loss for the year of 2017 many of their ratios are significantly impacted. However they IPO’d just 4 years ago and are far from becoming a more stable firm. Luckily for Chipotle, of this competitors
  • 12. Noodles is likely the most direct substitute with Wendy’s being closer to the fast food industry. In recent years, however, Wendy’s has began pushing for more healthy menu options to supplement their cheaper meals. One area that Chipotle has more success in than Wendy’s is the Current Ratio. Wendy’s holds only $62,602,000 in current assets and $227,162,000 in current liabilities. Should Wendy’s have a large issue that required a lot of spending their debtors could be concerned and call on a lot of debt that they do not have the assets to pay it with currently. It is difficult to say how Chipotle’s competitive position would impact the final valuation recommendation because of the varying results on the metrics we used to determine the best firm in the industry. Additionally, the industry itself is difficult to predict which restaurants are substitutes for each other. The main conclusion to be drawn is that Chipotle finds itself not in a dominant or weak position within this industry. SWOT Analysis Strengths Differentiated product Healthy, quality ingredients Brand strength Market demand for “healthy” fast casual food Weaknesses Limited suppliers due to dependence on farmers that uphold their ingredient requirements More expensive meals Limited product offerings Opportunities Catering International business Mobile ordering expansion New product offerings Threats Increased competition within Smart Casual/healthier options Increased food safety regulations Entry of new competitors US Market Dependence
  • 13. VI. FORECASTING SALES AND GROWTH For purposes of forecasting, we applied a growth rate of 4.36% for the firm for the next three years. This figure is derived from our beliefs on Chipotle’s future sales growth. The firm expects to open 130-150 new stores in 2018. New stores, on average, generate 75% of sales compared to existing stores. We believe that new store sales will be the primary driver of sales growth going forward. To calculate growth we assumed that Chipotle would open 140 stores in 2018. We then calculated an estimate of sales per store by dividing the number of stores that were open in 2017 by their total sales. Next, we applied the 75% assumption for new stores to this figure to calculate our belief of new store sales. After coming to a sales per new store number, we multiplied it by our assumption that 140 new stores will be open to arrive at total sales from new stores. Lastly, we divided total sales from new stores by 2017 total sales to get our expectation of sales growth. We rely solely on the new store sales as driving Chipotle’s growth because Chipotle’s sales profit margin currently is 5.4% and as mentioned above we believe that Chipotle will continue to struggle with profit margin and it won’t contribute to growth in sales revenue. The firm’s ATO has also remained relatively consistent over the past four years and we expect it to remain consistent going forward. Management also remarks in their February 6th press release that increases in revenue in 2017 as compared to 2016 were a result of new store openings. In the calculation of the continuing value for our valuation models, a growth rate of 2.45% was applied. 2.45% is the average growth in GDP for the years 2012-2017. As we believe we are unable to forecast Chipotle’s growth further than three years out due to uncertainty, the average growth in GDP is a conservative estimate of growth to apply to these calculations. Furthermore, the beta that we use for valuation purposes of Chipotle is 0.85 signaling that the firm is
  • 14. marginally less volatile than the market as a whole. This reiterates our position of using the average growth rate of GDP in our valuation models for years beyond 2020. VII. REFORMULATION Income Statement The reformulation of the income statement was crucial in determining the earnings generated from core business operations for Chipotle. It also provides us with a comparative basis for the historical performance of the firm. While completing the reformulation of the income statement, there were a few subjective decisions that went into our classification of specific line items that are worth addressing. First, we listed pre-opening costs as a core operating expense. These costs are limited to expenses incurred exclusively in store openings, but Chipotle is continuously opening new stores that drive their core operating income and we felt it appropriate to match the expenses of this driver with the revenues it produces. Next, Chipotle’s financial statements include a broad line item titled “interest and other income, net.” Without disaggregation or further details provided in the notes to the financial statements, it was impossible to discern the other income portion from the net interest for reformulation purposes. For this reason, “interest and other income, net” was included wholly under Net Financial Income in the reformulation. Balance Sheet The reformulation of the balance sheet was important for calculating historical NOA and NFA. We calculated operating cash using the ½% rule and then categorized each line item on the balance sheet into either operating or financial. Our main issue with the reformulation was the small loss of about 3.7 million in accumulated OCI. After research in the text and online, we
  • 15. decided to include it in total shareholders equity since Net Income would pass through there anyways and it was a small amount compared to the 1.36 billion equity value. Discount Rate The discount rate that was applied for the valuation of Chipotle was 7.11%. This number comes from the Cost of Capital by Sector source provided by NYU and is the cost of capital applied to the restaurant/dining industry as a whole. This resource derives the discount rate by using a Beta for the restaurant/dining industry of .85. The Beta is then multiplied by the risk premium for equity which is given as 5.08%. Then, the long-term treasury bond rate (risk-free rate) of 2.79% is added in to arrive at 7.11%. A required rate of return for Chipotle of 7.11% is reasonable given the fact that there is a relatively low amount of risk for an established firm in the restaurant/dining industry. VIII. PRO FORMA ANALYSIS Income Statement Items Since sales growth is anticipated to be 4.36%, we were able to forecast operating expenses based on management’s predictions of 2018 expenditures and a gross margin consistent with 2017. In the Feb. 6th 2018 press release, Chipotle management predicted SG&A expenses would be $330m (an increase from 2016) and that $35m in research and development would be expensed; therefore, we value core operating expenses as much higher than the historical basis.1 From there, we expect the core operating expenses and other core operating expenses to grow at the 4.36% rate due to relative costs of expansion and the historical trend. In order to predict the estimated net financial income we used a rolling average due to the lack in volatility in financial income in the previous five years.
  • 16. Balance Sheet Items The main drivers of the balance sheet items are asset turnover, sales, and the lack of AFS securities. Since there is some volatility in the 2016 measurement of the asset turnover ratio (ATO), we used a rolling average in order to smooth out the historical data and forecast the next three years. The results of the rolling average calculations correspond with our assumption that the ATOs from 2014 and 2015 were unsustainable. Even though Chipotle is investing money in restaurant efficiency (shorter wait times1 etc.), we believe that the positive effect on revenues will not be evident until after 2020 due to falling sales in the fast casual dining industry. Once asset turnover was calculated we used sales/ATO in order to calculate the forecasted net operating assets which we believe will increase by 6.4% in 2018 due to the growth in sales and the slight decline in ATO. Next we forecasted net financial assets by calculating the rolling average of cash and short term investments, since there is no reason to believe that Chipotle will invest in more AFS securities since they sold almost all of their long term investments at loss in 2017. We predict that short term investments and cash line items will adjust similarly to their value prior to 2016, considering that 2016 was an unusually off year for Chipotle. Accordingly, we believe that Chipotle’s net financial assets will begin to recover to values close to 2015, but with the lack of long term investments it is unlikely that they will ever fully recover. Cash Flow Items Once net operating assets (NOA) were forecasted, we were able to subtract the change in NOA from the forecasted operating income in order to get the Free Cash Flow. Free Cash Flow (FCF) 1 “Press Release.” Chipotle Investor Relations. 6 Feb 2018. http://ir.chipotle.com/news-releases/news- release-details/chipotle-fourth-quarter-earnings-share-grows-182-155-revenue
  • 17. is the basis for the cash flow statement because Chipotle does not utilize debt financing and pays no dividends. Our predicted net decrease in FCF in 2018 makes sense because Chipotle is reinvesting capital in order to make improvements to stores and researching how to optimize energy uses. Therefore, while research and development are important to Chipotle in order to cement their status as an industry leader, it does not reflect well on the company’s FCF. Additionally, we are not certain if Chipotle plans to keep making improvements in their stores, so we maintain that Chipotle’s FCF will recover at a medium rate. IX. VALUATION In calculating our belief of the value per share of Chipotle’s stock, we used three valuation models: discounted cash flow (DCF), residual earnings (RE), and residual operating income (ReOI). We believe that these three models provide the best estimation of the current value of the firm based on value driving activities. In calculating a target price, we used a weighted average of the three models in determining the ultimate price. The weights that were put on each model were 15% for DCF, 15% for RE, and 70% for ReOI. Emphasis was placed primarily on the ReOI model because it utilizes information from the reformulated statements more so than the other two models and we believe it most accurately reflects the value of the firm for this reason.
  • 18. Residual Operating Income (ReOI) ReOI for the years 2018, 2019, and 2020 was calculated by multiplying the prior years ReOI by 1+the anticipated growth rate of 5.4%. The prospective years’ ReOI was discounted to present using the cost of capital of 7.11%. The continuing value of ReOI was calculated using the 2.79% growth rate to forecast out to year 2021. This was then discounted using the same cost of capital as before to make it in terms of present value. The sum of the present value of future ReOIs, added to the 2017 actual ReOI, plus common shareholders’ equity results in our estimation of the enterprise value of Chipotle. We next added in the book value of NFA from the reformulated balance sheet to derive the value of common equity. Lastly, common equity was divided by the number of diluted shares outstanding resulting in a target price of $188.22 for this model.
  • 19. Residual Earnings (RE) The RE model resulted in a similar, but slightly lower valuation per share compared to the ReOI model. The model inherently fails to capture the value that can be generated from a share repurchase or issue at a price that is different from fair value. For that reason it provides a less accurate and lower valuation of the value per share. Discounted Cash Flows (DCF)
  • 20. Free cash flows were not given in Chipotle’s financial statements, however, we were able to calculate them historically using operating income less the change in net operating assets. Pro forma analysis was used to forecast out future free cash flows. The DCF model provides a lower valuation of Chipotle compared to the other two models. There are inherent limitations to the model resulting in us putting lesser weight on its valuation. The DCF model does not measure value added from operations as effectively as the ReOI model. Target Price After completing the three valuation models and applying the weights to each model, we find Chipotle’s stock to be worth $175.11 per share. This is significantly lower than the market value per share which closed on April 6th at $318.07 per share. Given the information and our calculation of Chipotle’s per share price versus that of the market we recommend an investor to take a sell position on Chipotle. Sensitivity Analysis The sensitivity analysis isolates those variables impacting valuation and record the range of possible outcomes. It is of great importance to know how sensitive our target price is to the change in our assumptions. Therefore, we ran a sensitivity analysis for our target price by adjusting our discount rate and revenue growth rate. The sensitivity analysis revealed that our
  • 21. target price could only be justified if the discount rate stays at 7% level. That means our model is pretty sensitive to our assumption. However, since the range of all possible target prices are much lower than the current share price $318.07, we would not worry that much about its impact on our final recommendations. X. ACCOUNTING QUALITY Divergence from Benford’s Law One factor we examined for Chipotle’s accounting quality was the adherence to Benford’s Law in its three financial statements. In the fraud detection domain, Benford’s law, also known as first-digit law, states that the expected distribution of the first digit of financial statement tends to adhere to the same probability distribution. We can determine if a company is a manipulator or not by comparing the actual distribution and the expected distribution from Benford’s law. If there is a significant divergence between these two distributions, this company is likely to have manipulated their financial statements. We evaluate the divergence from Benford’s Law using Mean Absolute Deviation (MAD). The MAD statistics of Chipotle was found to be only 0.01833, which is a very small deviation. Therefore, we can claim that Chipotle is not likely to be a manipulator. Beneish’s M score, Piotroski F-Score, and Altman’s Z score
  • 22. Beneish’s model, generated from eight financial vitals, is used to determine whether a company is a manipulator. The result, called M-Score, describes the degree to which the earnings have been manipulated. The zones of discrimination for M-Score is as such: An M-Score of less than - 2.22 suggests that the company is not an accounting manipulator; An M-Score of greater than - 2.22 signals that the company is likely an accounting manipulator. According to GuruFocus, Chipotle’s M-Score is -3.42, which means that the Chipotle is not likely to be an accounting manipulator. We also look at Piotroski’s F score to assess Chipotle’s financial health condition. The Piotroski F score is a discrete score from 0-9 which captures 9 criteria used to assess a firm’s strength in financial position. F score 7, 8, 9 are considered high scores or great financial position , while F score 0,1,2,3 are considered low scores or poor financial position. According to GuruFocus, the F score of Chipotle is 9, indicating a very healthy financial position. Looking at the historical trend of the firm over the past 13 years, the highest Piotroski F-Score of Chipotle was 9, the lowest was 5 and the median was 7. That means Chipotle has been in a very good financial condition not only in short term but also in long term perspective. Comparing Piotroski’s F score
  • 23. with its peers, we found that Chipotle is the best value firm with nearly 4 points higher than the industry average. We use the Altman Z-score to assess a firm’s likelihood of bankruptcy. The Altman Z-score is based on 5 ratios including profitability, leverage, liquidity, solvency and activity to predict whether a company is likely to go bankrupt. The zones of discrimination were as such: When Z- Score is less than 1.81, it is in Distress Zones; When Z-Score is greater than 2.99, it is in Safe Zones; When Z-Score is between 1.81 and 2.99, it is in Grey Zones.According to GuruFocus, the Altman’s Z score of Chipotle is 12.34, which means that it is in an extremely good condition and very unlikely to go bankrupt. Compared to 3.694, the industry average of Altman Z-score, Chipotle is way ahead. Comparison of Earnings and Cash Flow from Operations Another red flag of accounting quality is the disparity between earnings and cash flow from operation because of large accruals. As you can see in the figure, the general trend of comprehensive income, net income and cash flow from operation seems be consistent. In addition, cash flow from operation is higher than net income and comprehensive income. Therefore, we can be confident to say that Chipotle is not attempting to inflate net income by recognizing large accruals.
  • 24. Off-balance Sheet Arrangement To assess the accounting quality of a firm, we also look at Chipotle’s leases classification method. Generally, there are two accounting method in leases: operating and capital lease. Operating lease is more like rental contract where the asset stays off the balance sheet. Capital lease is treated as a loan where the asset is considered as being owned by the lessee therefore it stays on the balance sheet. The different accounting treatment on these two lease categories can have significant impact on taxes. Chipotle treats the vast majority of their leases as capital lease, meaning that they are kept on the balance sheet. There are a couple of advantages to adopt capital lease method. First of all, capital leases recognize expense earlier. Second, it is allowed to claim depreciation on the asset.Third, the interest expense can be deducted as operating expense. Dirty-Surplus Accounting Major dirty surplus items are gains and losses on foreign currency translation, gains and losses on derivative instrument, and unrealized gains and losses on available-for-sale securities. In our reformulated income statement, we already take these items into consideration. We compared net income and comprehensive income to see the net effect of these dirty surplus items. As you can see in the figure above, there is very little difference between net income and comprehensive income. Therefore, dirty surplus has very little impact on Chipotle’s valuation. Cherry Picking
  • 25. Cherry Picking is the practice of selling securities to realize gains in years when operating income is low, while retaining securities whose price have declined so that the related losses are only included in the statement of equity. According to its 10-K filing, “Chipotle had no realized gains or losses for the years ended December 31, 2017 and 2015, and $547 of realized gains on available-for-sale securities for the year ended December 31, 2016. Realized gains and losses on available-for-sale securities are recorded in interest and other income on the consolidated statement of income. During the year ended December 31, 2015, Chipotle recorded an other- than-temporary impairment charge of $244 in interest and other income in the consolidated statement of income in connection with a decline in the fair market value of certain available-for- sale securities.” Therefore, there is little evidence of Chipotle cherry picking appreciated investments or holding onto depreciated investments. To summarize, Chipotle has not only a good accounting quality, but also a very good financial position.
  • 27.
  • 28. Works Cited: www.diffen.com www.investopedia.com GuruFocus.com Bloomberg Terminal http://people.stern.nyu.edu/adamodar/New_Home_Page/datafile/wacc.htm “Chipotle Mexican Grill Inc's.” Chipotle Mexican Grill Inc Comparisons to Its Competitors, Market Share and Competitiveness by Segment. CISMarket, Inc., csimarket.com/stocks/compet_glance.php?code=CMG. “Zacks Industry Outlook Highlights: Chipotle Mexican Grill, Jack in the Box, Brinker International, Red Robin Gourmet Burgers and Starbucks.” NASDAQ.com, Zacks Equity Research, 16 Aug. 2017<www.nasdaq.com/article/zacks-industry-outlook-highlights-chipotle- mexican-grill-jack-in-the-box-brinker-international-red-robin-gourmet-burgers-and-starbucks- cm832722> Transcripts, SA. “Chipotle Mexican Grill (CMG) Q4 2017 Results - Earnings Call Transcript.” Seeking Alpha, 7 Feb. 2018, <seekingalpha.com/article/4143818-chipotle-mexican-grill-cmg-q4- 2017-results-earnings-call-transcript?page=1> “Our Company.” Chipotle, 2018, <www.chipotle.com/company> Patton, Leslie. “America's Fast-Casual Dining Boom Is Over.” Bloomberg.com, Bloomberg, 1 June 2017, www.bloomberg.com/news/articles/2017-06-01/chipotle-potbelly-qdoba-are-sinking- into-fast-casual-malaise “Mexican Restaurants Industry at a Glance.” IBIS World US, IBIS World, 2018, clients1.ibisworld.com/reports/us/industry/ataglance.aspx?indid=4305. “Fast Food Restaurants Industry at a Glance.” IBIS World US, IBIS World, 2018, clients1.ibisworld.com/reports/us/industry/ataglance.aspx?indid=1980. Jaaskelainen, Liisa. “Topic: Chipotle Mexican Grill.” Www.statista.com, Statista, 2018, www.statista.com/topics/2717/chipotle-mexican-grill/. “Press Release.”Chipotle Investor Relations. 6 Feb 2018. http://ir.chipotle.com/news- releases/news-release-details/chipotle-fourth-quarter-earnings-share-grows-182-155-revenue