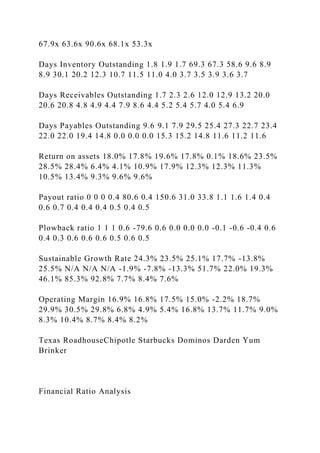
Chipotle Mexican Grill, Inc. has experienced significant growth over the past three years, achieving high top-line growth rates of up to 28% and strong EBITDA growth, despite facing challenges from recent food safety incidents. The company maintains a unique position between the fast food and casual dining sectors by focusing on quality ingredients and sustainable practices, with plans for continued expansion domestically and modestly internationally. Financially, Chipotle demonstrates resilience with strong profit margins and high inventory turnover, although it has encountered increased operational costs due to rising labor and ingredient expenses.
![Sustainable long term growth rate analysis
...............................................................................................
...................... 10
Underlying assumptions
...............................................................................................
............................................................ 10
Risk and Return Analysis
...............................................................................................
........................................................... 12
Overview Risk/Return Analysis
...............................................................................................
.............................................. 12
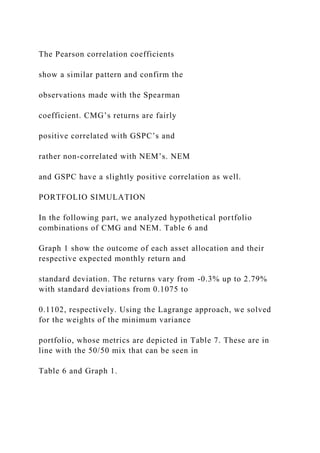
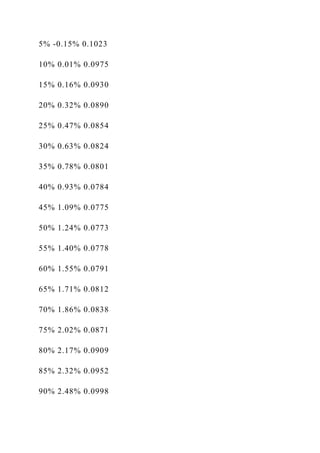
Portfolio Simulation
...............................................................................................
..................................................................... 13
Calculation of Beta
...............................................................................................
........................................................................ 14
Required Returns based on Capital Asset Pricing Model
[CAPM] .......................................................................... 15
Preliminary Recommendations
...............................................................................................
.............................................. 15
Corporate Valuation
...............................................................................................
...................................................................... 16
Discounted Cash Flow Model](https://image.slidesharecdn.com/initialvaluationreportchipotlemexicangrillinc-221017180301-6c5d3efd/85/Initial-Valuation-Report-Chipotle-Mexican-Grill-Inc-docx-3-320.jpg)
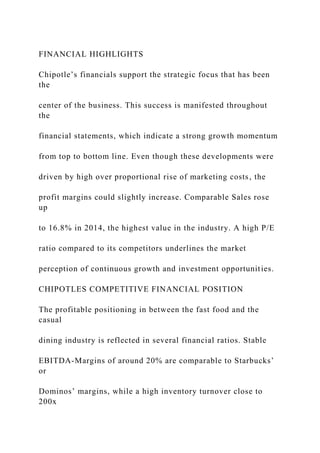
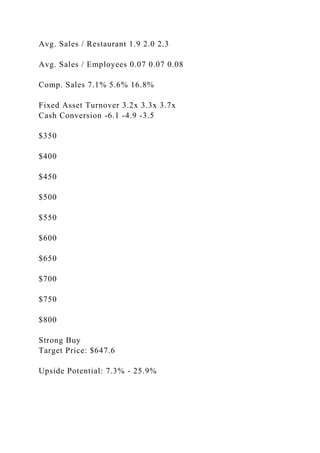
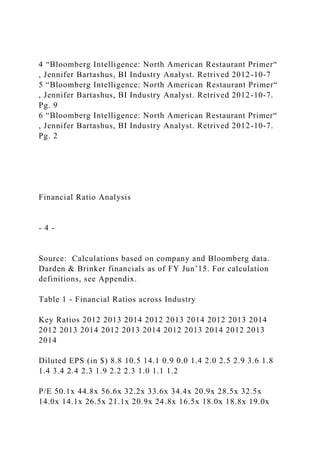
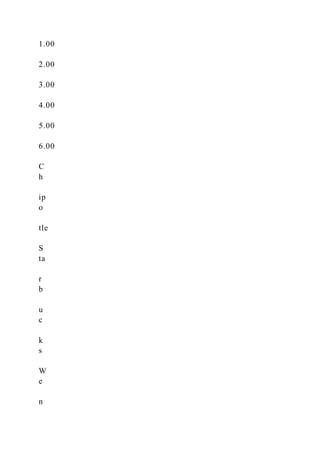
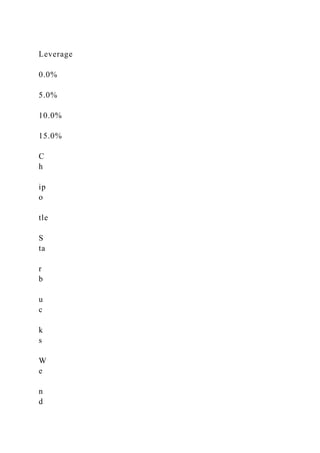
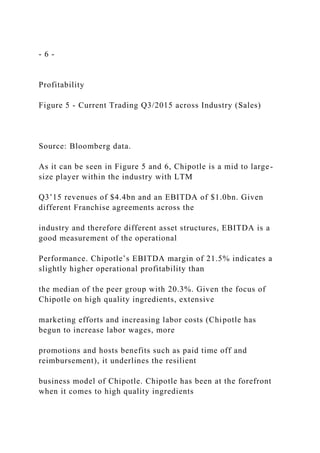
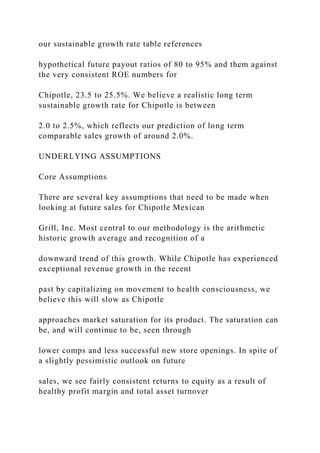
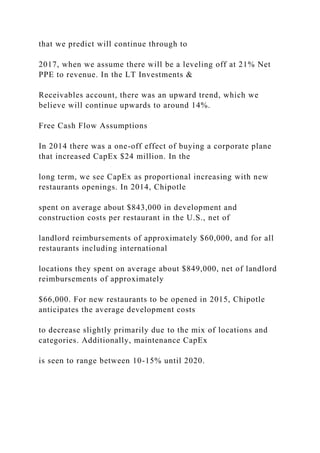
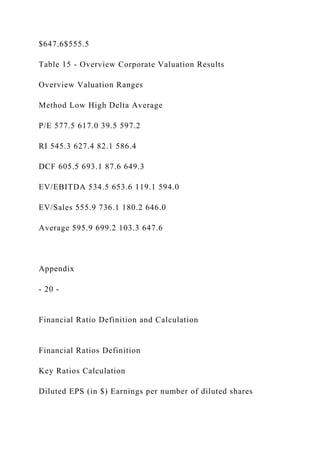
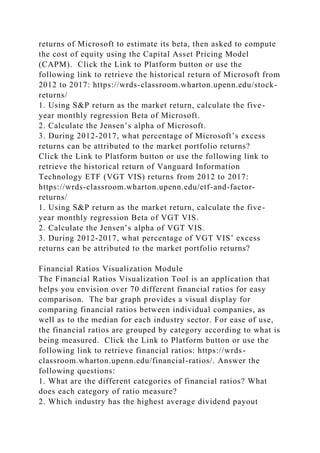
![- 5 -
KEY RATIO ANALYSIS ACROSS INDUSTRY
DuPont Analysis
The DuPont analysis indicates a stable Return on Equity [ROE]
for Chipotle with a slight upwards trend
over the years. However, Chipotle has consistently had lower
ROE than most of its main competitors over
the last five years. This is a trend that continued through
FY2014. However, the main driver for the lower
ROE is debt utilization. They have slightly above average Profit
Margin and Total Asset Turnover, but have
the lowest level of debt to equity and as a result have a low
Leverage.
Figure 3 - DuPont Analysis Split](https://image.slidesharecdn.com/initialvaluationreportchipotlemexicangrillinc-221017180301-6c5d3efd/85/Initial-Valuation-Report-Chipotle-Mexican-Grill-Inc-docx-22-320.jpg)


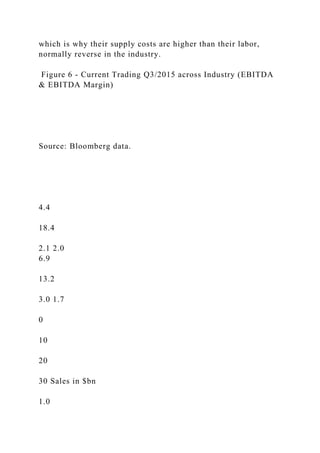
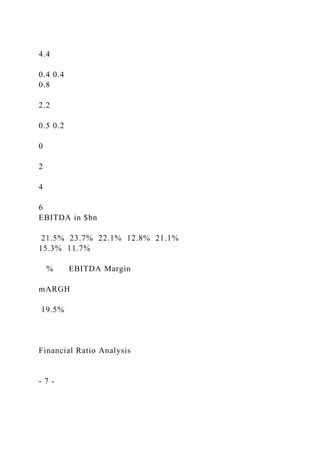
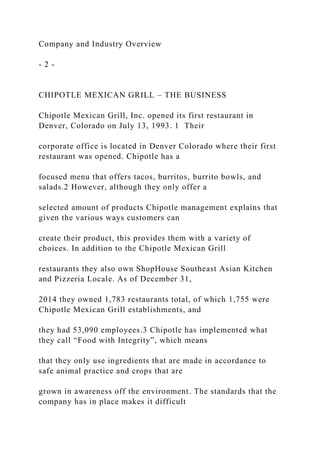
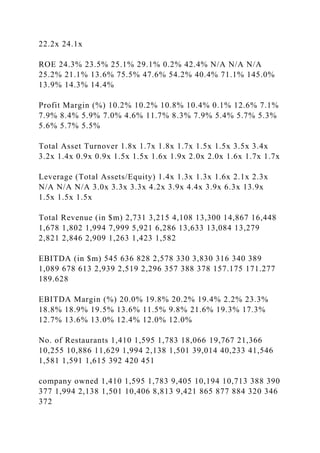
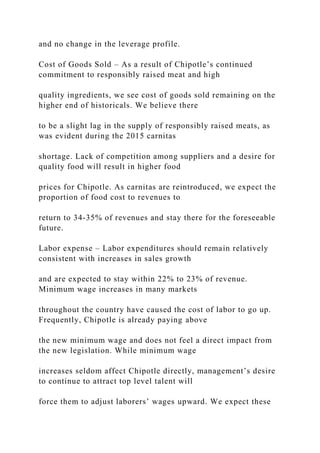
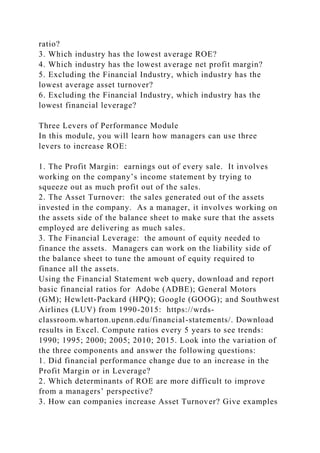
![mARGH
Note: Calculations based on Bloomberg data.
Financial Ratio Analysis
- 8 -
Other Key Ratios
P/E ratio
Chipotle is highly valued based on the P/E Ratio compared to
its peer group. Within the last years,
Chipotle was consistently valued above average. This reflects
its strong growth as well as the stable
business model. The growth and investment strategy of Chipotle
is perceived well by the market
underscored by a share price development of +26.1% over the
last three years (including recent
drawback caused by e-coli incidents).
Cash Conversion
Within the industry a negative Cash Conversion Cycle [CCC] is
quite common. Given the business to
consumer model of the restaurant industry, firms usually collect](https://image.slidesharecdn.com/initialvaluationreportchipotlemexicangrillinc-221017180301-6c5d3efd/85/Initial-Valuation-Report-Chipotle-Mexican-Grill-Inc-docx-36-320.jpg)
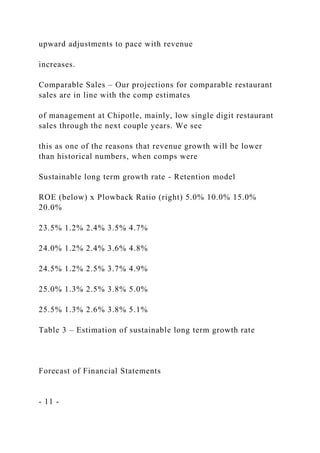
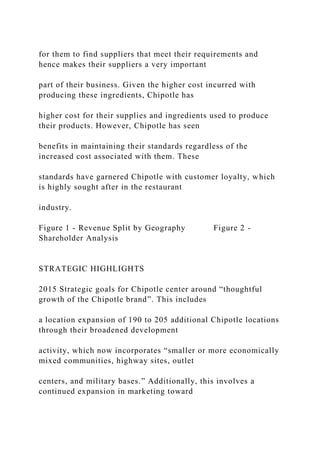
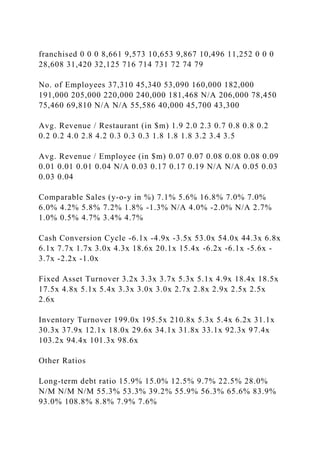
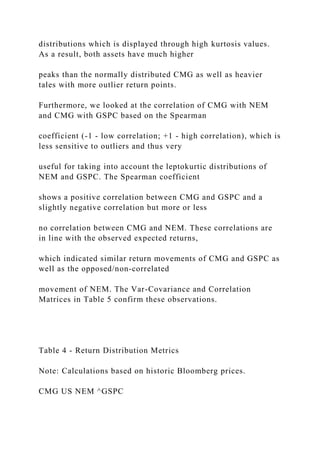
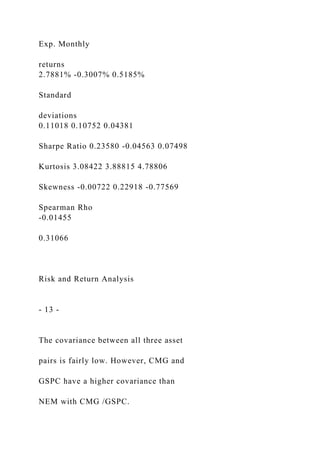
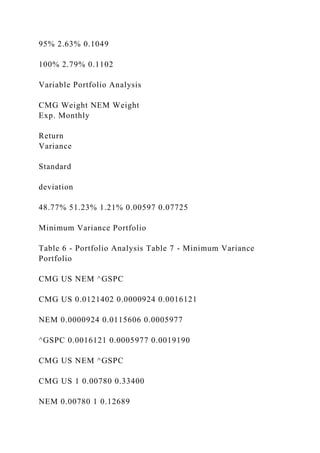
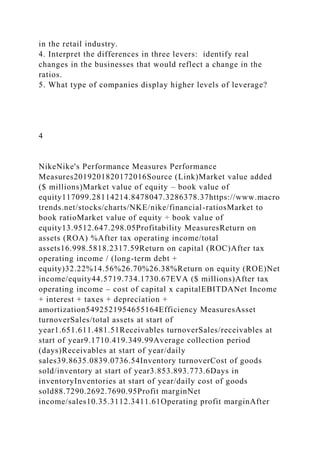
![Risk and Return Analysis
- 12 -
OVERVIEW RISK/RETURN ANALYSIS
In order to analyze the risk and return
of Chipotle [CMG US], we compare its
return distribution to Newmont Mining
Corp [NEM] and the S&P 500 Stock
Index [^GSPC] for 120 data points
comprising monthly prices from
January 2006 up to November 2015
(Resulting in 119 monthly holding
period return observations). Table 4
depicts an expected return of 2.8% for
CMG compared to a negative average
return of -0.3% for NEM and 0.5% for
the GSPC. These returns have to be seen
in relation to each assets’ individual](https://image.slidesharecdn.com/initialvaluationreportchipotlemexicangrillinc-221017180301-6c5d3efd/85/Initial-Valuation-Report-Chipotle-Mexican-Grill-Inc-docx-48-320.jpg)
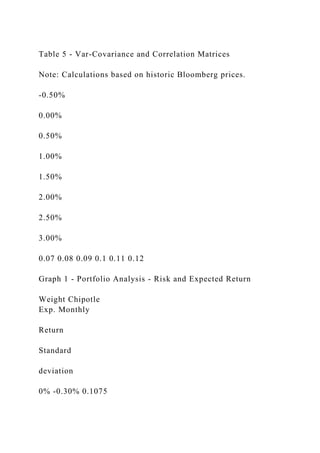
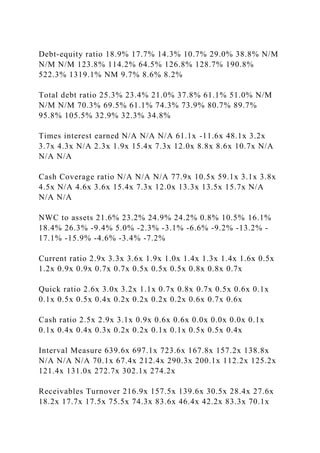
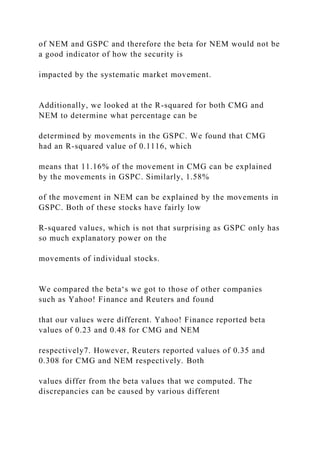
![^GSPC 0.33400 0.12689 1
Var-Covariance Matrix
Correlation Matrix
Risk and Return Analysis
- 14 -
CALCULATION OF BETA
To determine the systematic risk of CMG in
comparison to the market [GSPC], we use the
measurement of beta. In order to compute beta, we
ran a regression with CMG as our dependent variable
and GSPC as our independent variable using monthly
returns. Conducting regression analysis allows us to
determine how the effects of the market impact an
individual security or portfolio. In other words, the regression
tells us how much the variation in the
market affects the individual security, which in this case is
CMG. The assumption we made for using the](https://image.slidesharecdn.com/initialvaluationreportchipotlemexicangrillinc-221017180301-6c5d3efd/85/Initial-Valuation-Report-Chipotle-Mexican-Grill-Inc-docx-56-320.jpg)
![S&P 500 Index [^GSPC] as the representation for the market
has to do with the idea of diversification. It
is assumed that we can eliminate firm specific risk through
diversification. Given that the S&P 500 is
composed of the 500 largest companies in the US, we can claim
it has diversified essentially all firm and
industry specific risk and the only risk that needs to be taken
into account is systematic risk. Although
running a regression provides us with the beta measurement, we
also need to determine the statistical
significance of the Beta. The statistical significance will tell us
the probability the relationship in our
regression is accurate. To determine statistically significance
we will look at the t-statistic and the p-value,
which should be larger than 1.96 and smaller than 0.05
respectively. We found that CMG had a beta of
0.84, a t-stat of 3.82 and a p-value of 0.0002. The beta for CMG
is statistically significant and it is less
volatile than the market, which has a beta of 1. Similarly, we
computed the beta of NEM to be 0.31,
however, we found that it was not statistically significant (t-
stat: 1.37, p-value: 0.17). It could be said that
there is a 17% chance that the beta of .31 is an inaccurate
representation of the relation between returns](https://image.slidesharecdn.com/initialvaluationreportchipotlemexicangrillinc-221017180301-6c5d3efd/85/Initial-Valuation-Report-Chipotle-Mexican-Grill-Inc-docx-57-320.jpg)
![Risk and Return Analysis
- 15 -
January 2006 through November 2015, giving us 120 data
points. If either Yahoo! Finance or Reuters used
different date ranges then the size of their data will be different
and cause their computation of beta to
differ from ours. Another cause for the differences can be the
frequency of the returns. We used monthly
returns to compute our beta values but if Reuters chose to use
daily or weekly historical prices then this
would also cause their value for beta to differ. Given the
turmoil the CMG stock has been through within
the last months, including or excluding certain trading
days/periods may certainly affect the Beta value,
too.
REQUIRED RETURNS BASED ON THE CAPITAL ASSET
PRICING MODEL [CAPM]
To estimate the required return for CMG and NEM we used the
Capital Asset Pricing Model [CAPM]:
�[������] = �� + �[����� − ��]](https://image.slidesharecdn.com/initialvaluationreportchipotlemexicangrillinc-221017180301-6c5d3efd/85/Initial-Valuation-Report-Chipotle-Mexican-Grill-Inc-docx-60-320.jpg)
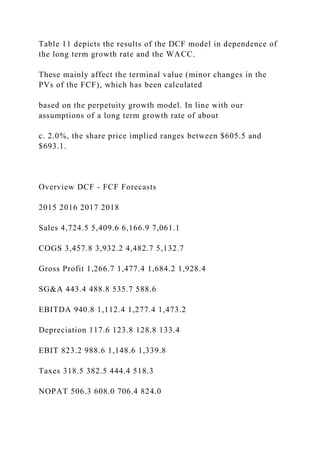
![- 16 -
DISCOUNTED CASH FLOW MODEL
The first model we used to determine the fundamental value of
Chipotle is a two-step Discounted Cash
Flow Model [DCF]. Table 9 summarizes our forecasts up to
FY2018 using FY2015 as the basis year. This
3-years period is in line with the management forecast period,
which we see as a period of higher growth
rates converging towards our long term growth rate of c. 2.0%.
Table 9 - Free Cash Flow Forecasts
Based on these forecasts, Table 10 provides an overview of the
DCF model. Chipotle has no interest
bearing debt and thus an Equity Ratio of 100%. Hence, the
WACC is purely dependent on the Cost of Equity,
which we calculated with the Capital Asset Pricing Model. The
WACC of 5.6% is used as the discount rate
for the Free Cash Flows resulting in a total present value of
$1,855.0m.
Table 10 - Model Overview](https://image.slidesharecdn.com/initialvaluationreportchipotlemexicangrillinc-221017180301-6c5d3efd/85/Initial-Valuation-Report-Chipotle-Mexican-Grill-Inc-docx-62-320.jpg)
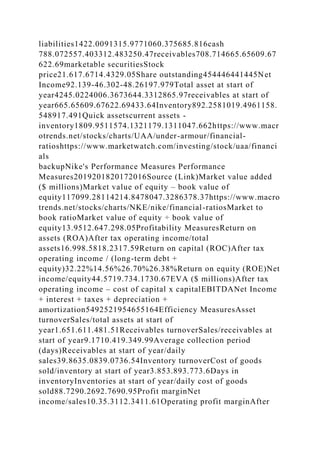
![tax operating income/sales10.30%5.31%12.34%11.61%Leverage
MeasuresLong term debt ratioLong term debt/(long term debt +
equity)27.70%26.11%21.86%13.98%Long term debt equity
ratioLong term debt
debt/equity38.32%35.34%27.98%16.26%Total debt ratioTotal
liabilities/total assets61.88%56.46%46.66%42.66%Times
interest earnedEBIT/interest
payments38.4837.9957.91136.42Cash coverage ratio(EBIT +
depreciation)/interest payments44.1744.3866.52156.09Liquidity
MeasuresNet working capital to assetsNet working capital/total
assets52.40%60.09%65.92%64.34%Current ratioCurrent
assets/current liabilities2.12.512.932.8Quick ratio(cash +
marketable securities + receivables)/current liabilitiesCash
ratio(cash + marketable securities)/current liabilitiesDays in
Inventory365/ Inventory Turnover959497101Days in A/R365/
A/R Turnover40353937Days in A/P365/ A/P TurnoverMarket
value of equityStock price x share
outstanding126139.28124026.8490454.3298636.37book value of
equityTotal assets - total liabilities904098121240712258After
tax operating income4029193342403760long-term
debt3464346834711993equity904098121240712258cost of
capitalcapitallong-term debt +
eauity12504132801587814251Inventories at start of
year5261505548384337cost of goods
sold21643204411903817405sales39117363973435032376Total
liabilities1467712724108529121total
assets23717225362325921379EBIT4772444547494502interest1
241178233https://www.marketwatch.com/investing/stock/nke/fi
nancialsdepreciation705747706649https://www.marketwatch.co
m/investing/stock/nke/financialsNet working capitalcurrent
assets - current liabilities86599094105879667Current
assets16525151341606115025current
liabilities7866604054745358cash
4663524561795457receivables4270350036803240marketable
securitiesStock price77.9674.7653.4656.59Share
outstanding1618165916921743Cost of capital[(E/V) * Re] +](https://image.slidesharecdn.com/initialvaluationreportchipotlemexicangrillinc-221017180301-6c5d3efd/85/Initial-Valuation-Report-Chipotle-Mexican-Grill-Inc-docx-79-320.jpg)
![[(D/V) * Rd * (1-
Tc)]https://www.thebalancesmb.com/calculate-weighted-
average-cost-of-capital-
393130https://www.macrotrends.net/stocks/charts/NKE/nike/fin
ancial-
ratioshttps://www.marketwatch.com/investing/stock/nke/financi
alshttps://www.marketwatch.com/investing/stock/nke/financials
https://www.thebalancesmb.com/calculate-weighted-average-
cost-of-capital-393130
Under ArmourUnder Armour's Performance
MeasuresPerformance Measures2019201820172016Source
(Link)Market value added ($ millions)Market value of equity –
book value of
equity7656.315863.954344.9910896.35https://www.macrotrends
.net/stocks/charts/UAA/under-armour/financial-ratiosMarket to
book ratioMarket value of equity ÷ book value of
equity4.563.913.156.37https://www.marketwatch.com/investing/
stock/uaa/financialsProfitability MeasuresReturn on assets
(ROA)After tax operating income/total assets2.89%-1.09%-
1.20%7.05%Return on capital (ROC)After tax operating income
/ (long-term debt + equity)4.21%-1.70%-1.73%9.11%Return on
equity (ROE)Net income/equity4.29%-2.30%-2.39%9.75%EVA
($ millions)After tax operating income – cost of capital x
capitalEBITDANet Income + interest + taxes + depreciation +
amortization423.449157.005201.844562.241Efficiency
MeasuresAsset turnoverSales/total assets at start of
year124.08%129.62%136.90%168.65%Receivables
turnoverSales/receivables at start of
year791.28%851.80%801.24%1114.60%Average collection
period (days)Receivables at start of year/daily
sales46.1342.8545.5532.75Inventory turnoverCost of goods
sold/inventory at start of
year274.31%246.23%298.40%330.09%Days in
inventoryInventories at start of year/daily cost of goods
sold133.06148.23122.32110.58Profit marginNet
income/sales1.75%-0.89%-0.97%4.10%Operating profit](https://image.slidesharecdn.com/initialvaluationreportchipotlemexicangrillinc-221017180301-6c5d3efd/85/Initial-Valuation-Report-Chipotle-Mexican-Grill-Inc-docx-80-320.jpg)
![tax operating income/sales10.30%5.31%12.34%11.61%Leverage
MeasuresLong term debt ratioLong term debt/(long term debt +
equity)27.70%26.11%21.86%13.98%Long term debt equity
ratioLong term debt
debt/equity38.32%35.34%27.98%16.26%Total debt ratioTotal
liabilities/total assets61.88%56.46%46.66%42.66%Times
interest earnedEBIT/interest
payments38.4837.9957.91136.42Cash coverage ratio(EBIT +
depreciation)/interest payments44.1744.3866.52156.09Liquidity
MeasuresNet working capital to assetsNet working capital/total
assets52.40%60.09%65.92%64.34%Current ratioCurrent
assets/current liabilities2.12.512.932.8Quick ratio(cash +
marketable securities + receivables)/current liabilitiesCash
ratio(cash + marketable securities)/current liabilitiesMarket
value of equityStock price x share
outstanding126139.28124026.8490454.3298636.37book value of
equityTotal assets - total liabilities904098121240712258After
tax operating income4029193342403760long-term
debt3464346834711993equity904098121240712258cost of
capitalcapitallong-term debt +
eauity12504132801587814251Inventories at start of
year5261505548384337cost of goods
sold21643204411903817405sales39117363973435032376Total
liabilities1467712724108529121total
assets23717225362325921379EBIT4772444547494502interest1
241178233https://www.marketwatch.com/investing/stock/nke/fi
nancialsdepreciation705747706649https://www.marketwatch.co
m/investing/stock/nke/financialsNet working capitalcurrent
assets - current liabilities86599094105879667Current
assets16525151341606115025current
liabilities7866604054745358cash
4663524561795457receivables4270350036803240marketable
securitiesStock price77.9674.7653.4656.59Share
outstanding1618165916921743Cost of capital[(E/V) * Re] +
[(D/V) * Rd * (1-
Tc)]https://www.thebalancesmb.com/calculate-weighted-](https://image.slidesharecdn.com/initialvaluationreportchipotlemexicangrillinc-221017180301-6c5d3efd/85/Initial-Valuation-Report-Chipotle-Mexican-Grill-Inc-docx-83-320.jpg)