Why Precision Mattersin Physics
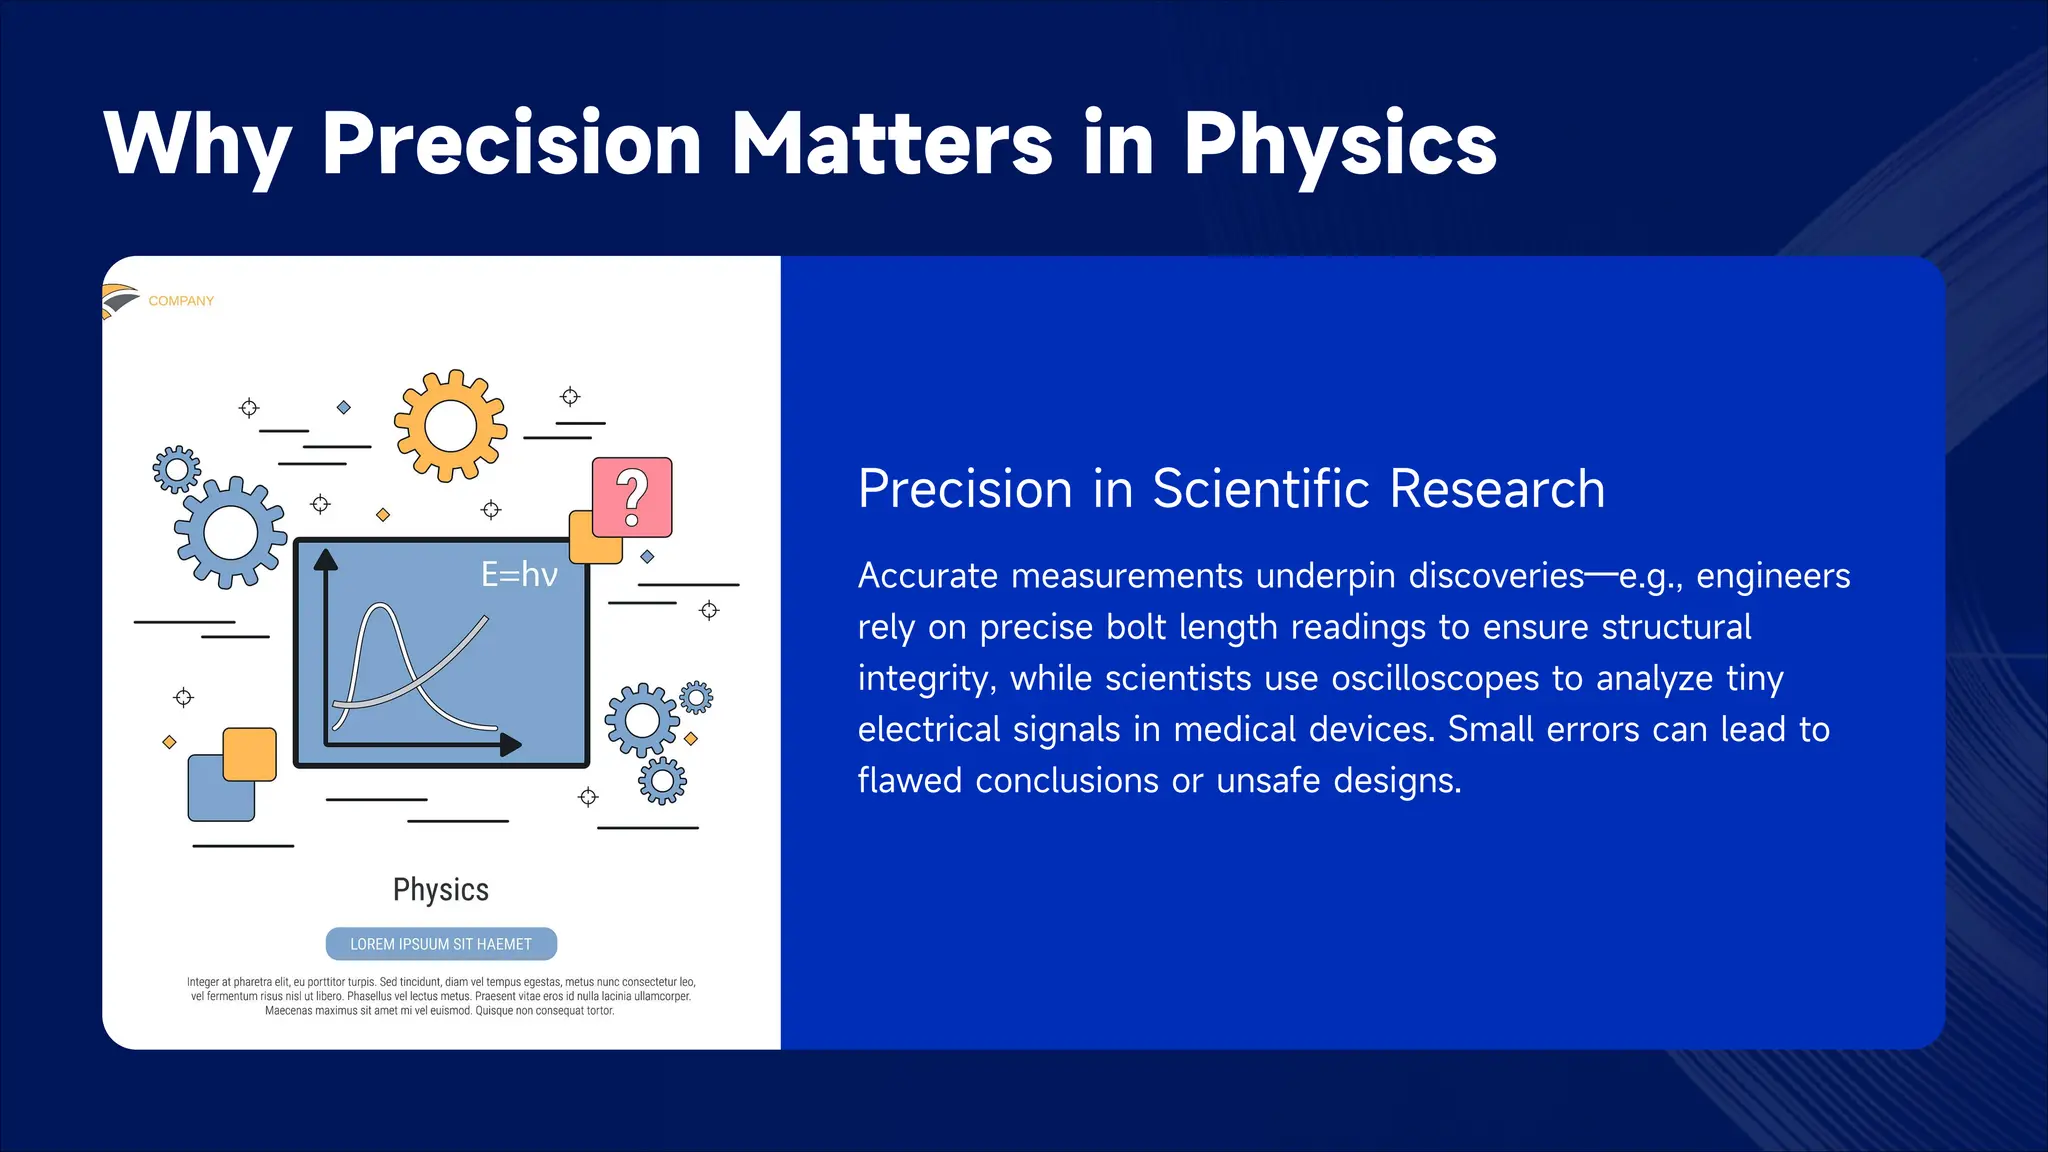
Precision in Scientific Research
Accurate measurements underpin discoveries—e.g., engineers
rely on precise bolt length readings to ensure structural
integrity, while scientists use oscilloscopes to analyze tiny
electrical signals in medical devices. Small errors can lead to
flawed conclusions or unsafe designs.
5.
Why Precision Mattersin Physics
Precision in A-Level Exams
40% of A-Level 9702 experimental questions (e.g., Q4, Q51, Q7) directly test instrument reading skills.
Misreading a micrometer or oscilloscope can cost critical exam marks, making mastery of precision essential for
success.
6.
Meter Ruler: ReadingRules
01
Scale Division & Estimation
A meter ruler has a 1 mm scale division but requires estimation to 0.1 mm. For example, a true
length of 70 mm should be recorded as 70.0 mm (not 70 mm) to reflect precision.
02
Systematic Error Example (Q4)
In Q4, a student measures a 895 mm object but records 891–892 mm due to a worn ruler edge.
This consistent under-measurement is a systematic error, highlighting the impact of instrument
condition on accuracy.
7.
Vernier Caliper: Structure& Precision
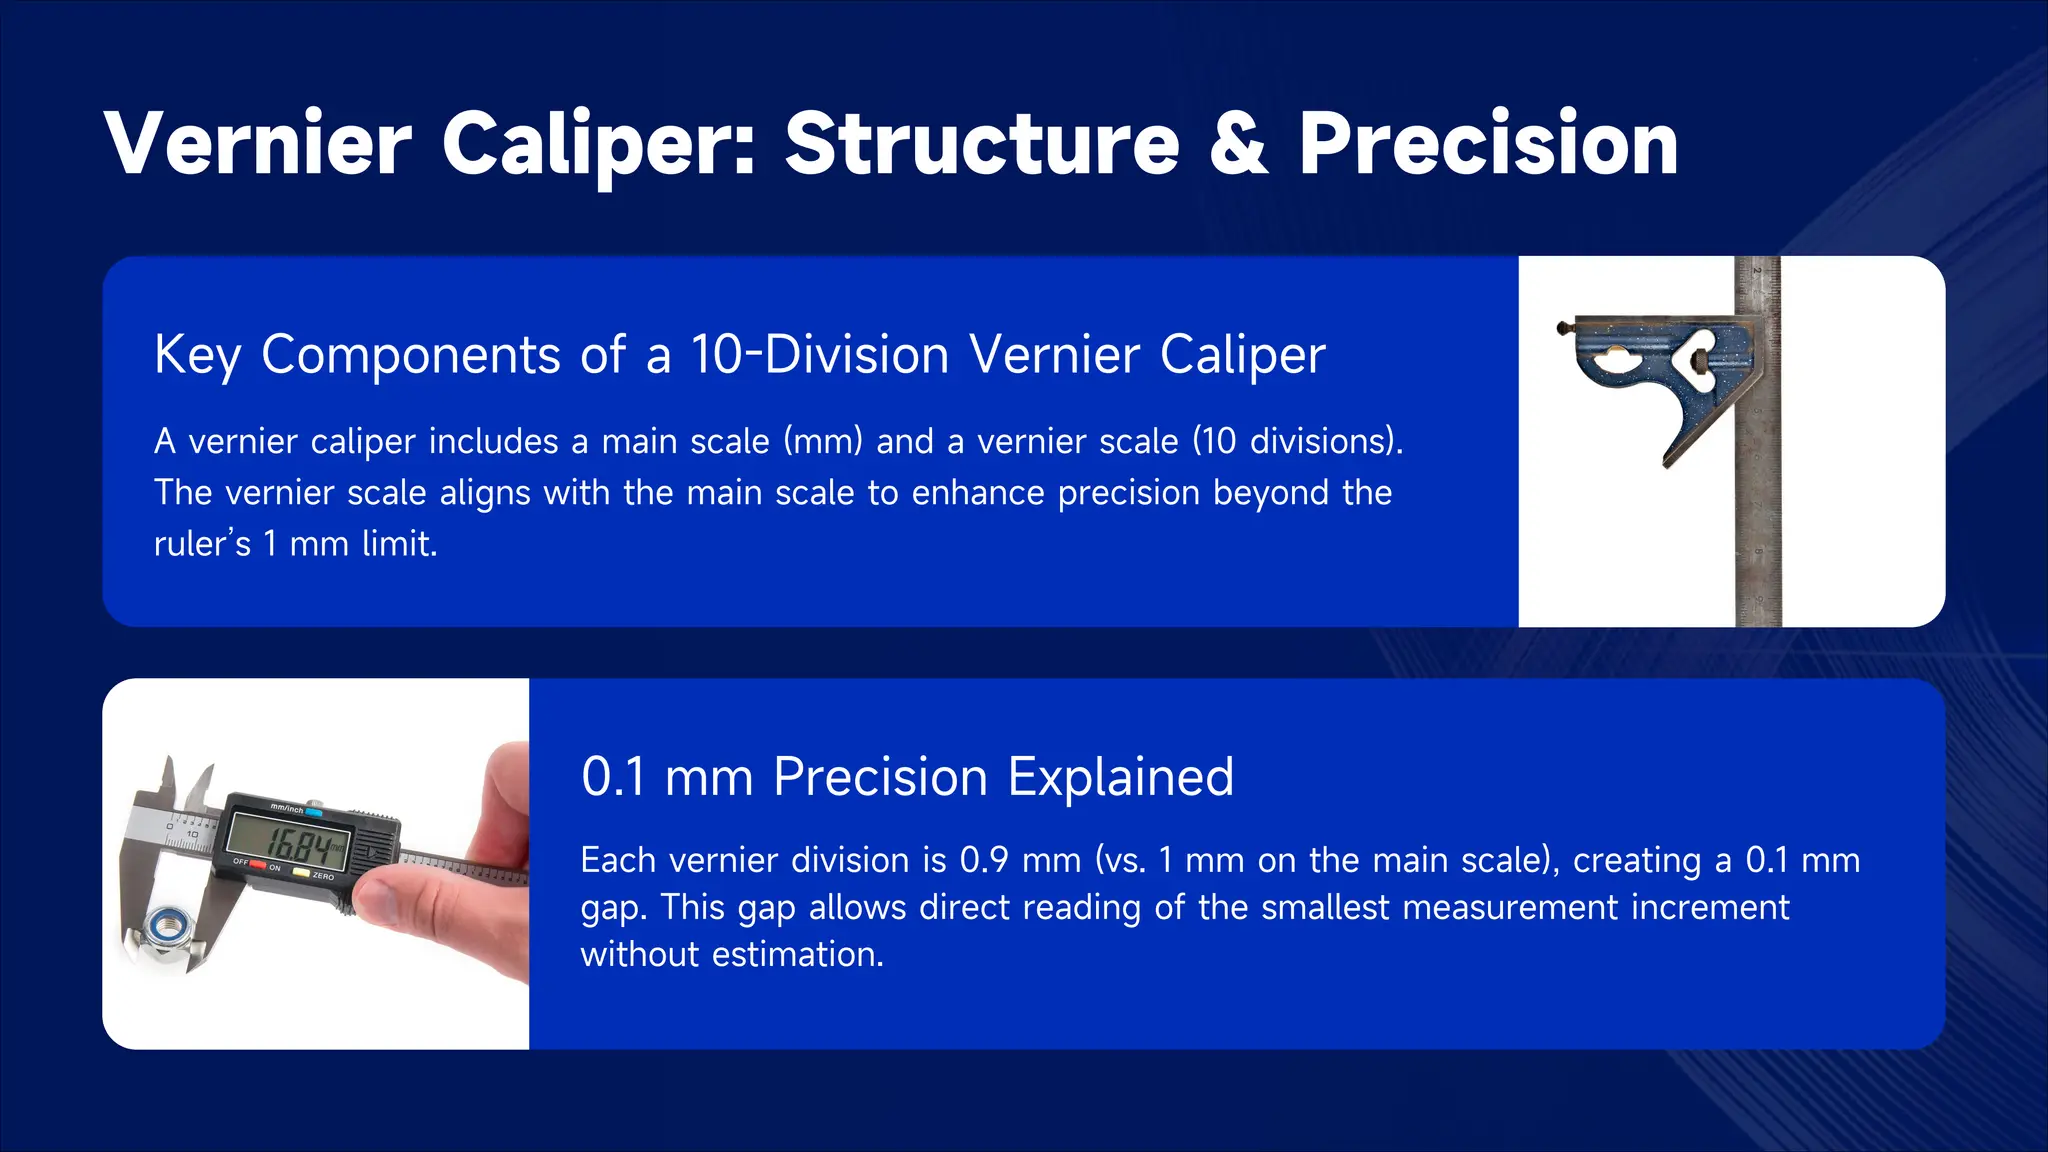
Key Components of a 10-Division Vernier Caliper
A vernier caliper includes a main scale (mm) and a vernier scale (10 divisions).
The vernier scale aligns with the main scale to enhance precision beyond the
ruler’s 1 mm limit.
0.1 mm Precision Explained
Each vernier division is 0.9 mm (vs. 1 mm on the main scale), creating a 0.1 mm
gap. This gap allows direct reading of the smallest measurement increment
without estimation.
8.
Vernier Caliper: Structure& Precision
Reading Practice Example
Example: Main scale reads 30 mm, and the 5th vernier division aligns with the main scale. Total reading =
30 mm + (5 × 0.1 mm) = 30.5 mm.
9.
Micrometer Screw Gauge:Key Components
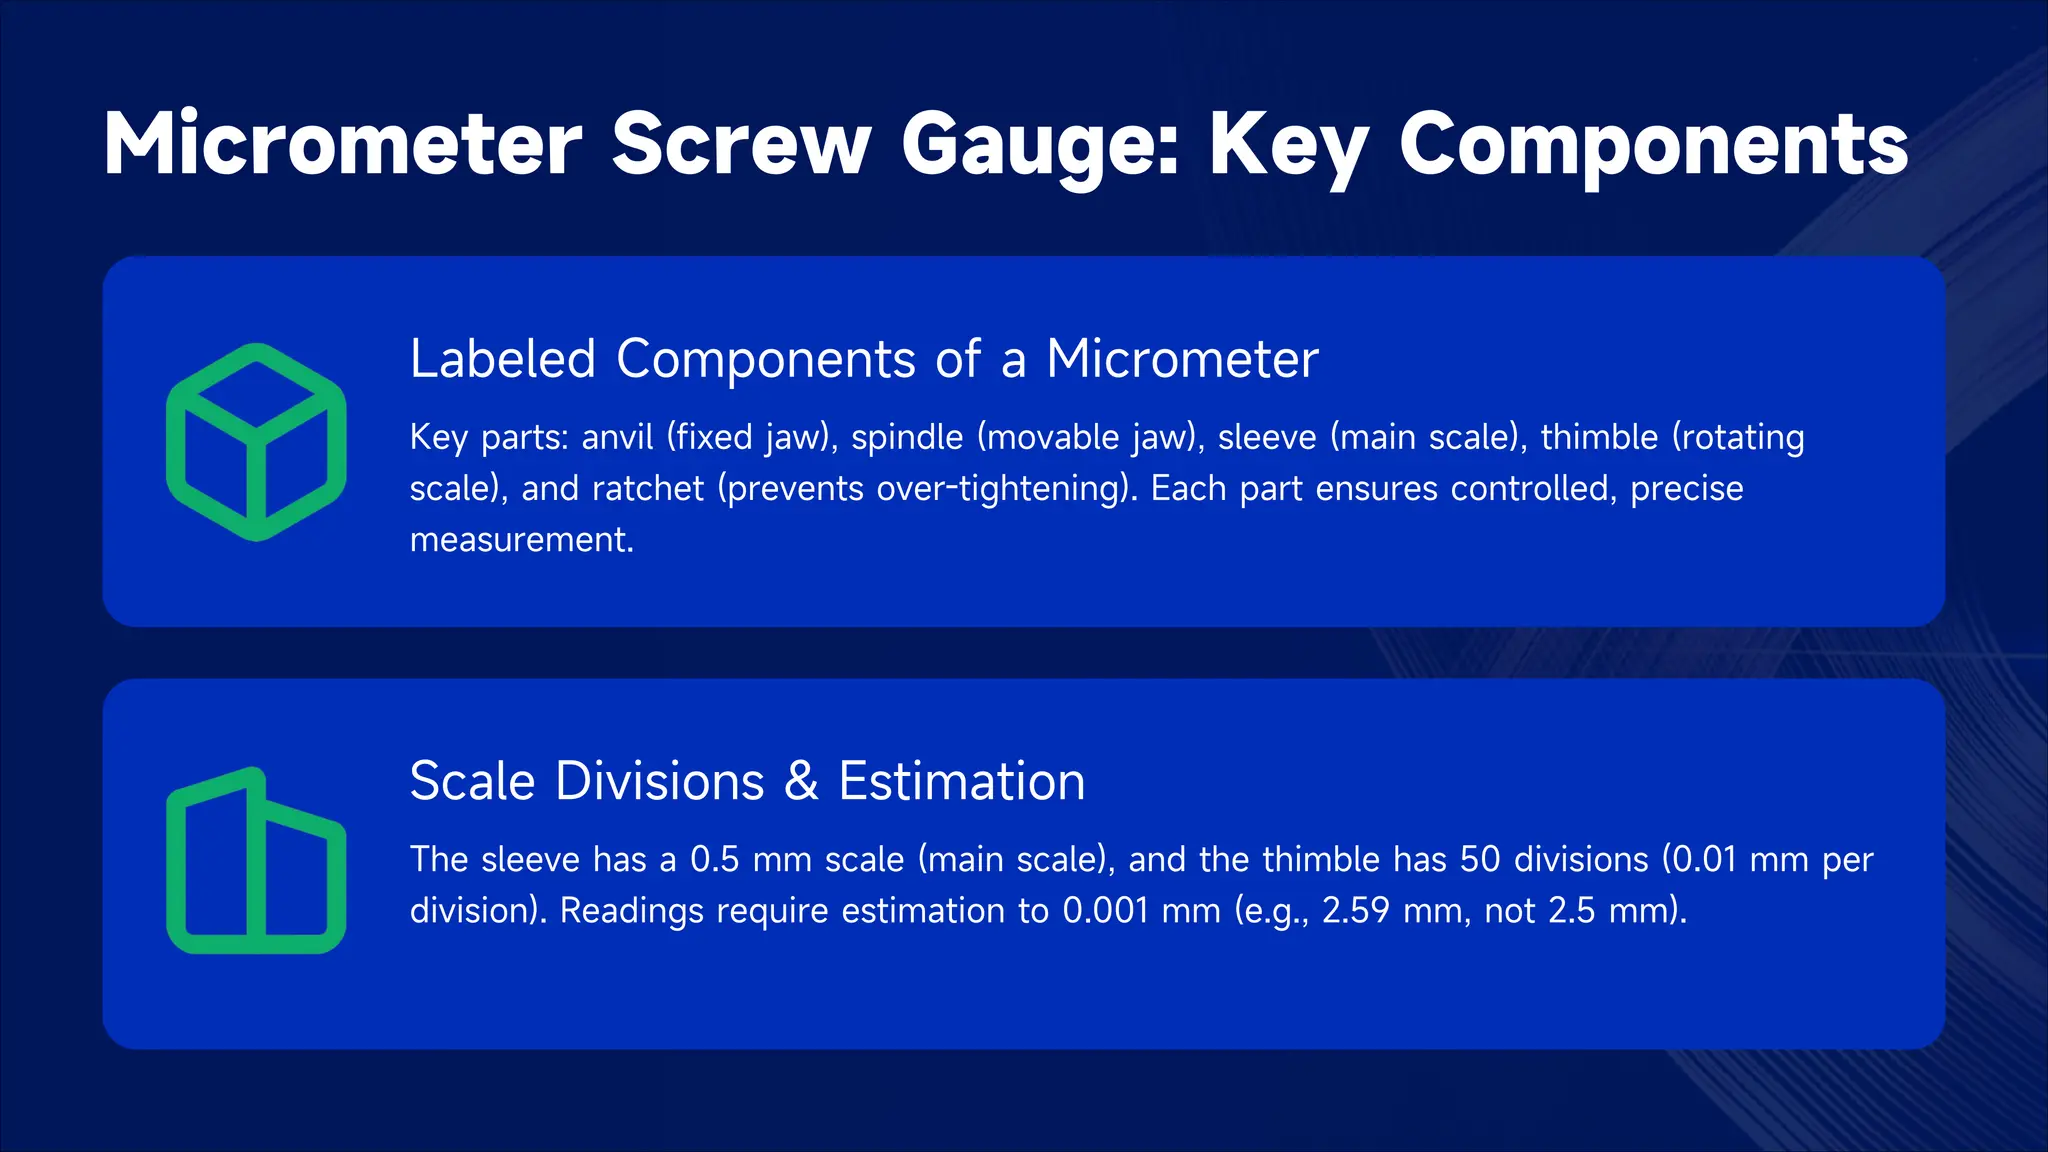
Labeled Components of a Micrometer
Key parts: anvil (fixed jaw), spindle (movable jaw), sleeve (main scale), thimble (rotating
scale), and ratchet (prevents over-tightening). Each part ensures controlled, precise
measurement.
Scale Divisions & Estimation
The sleeve has a 0.5 mm scale (main scale), and the thimble has 50 divisions (0.01 mm per
division). Readings require estimation to 0.001 mm (e.g., 2.59 mm, not 2.5 mm).
10.
Micrometer Screw Gauge:Key Components
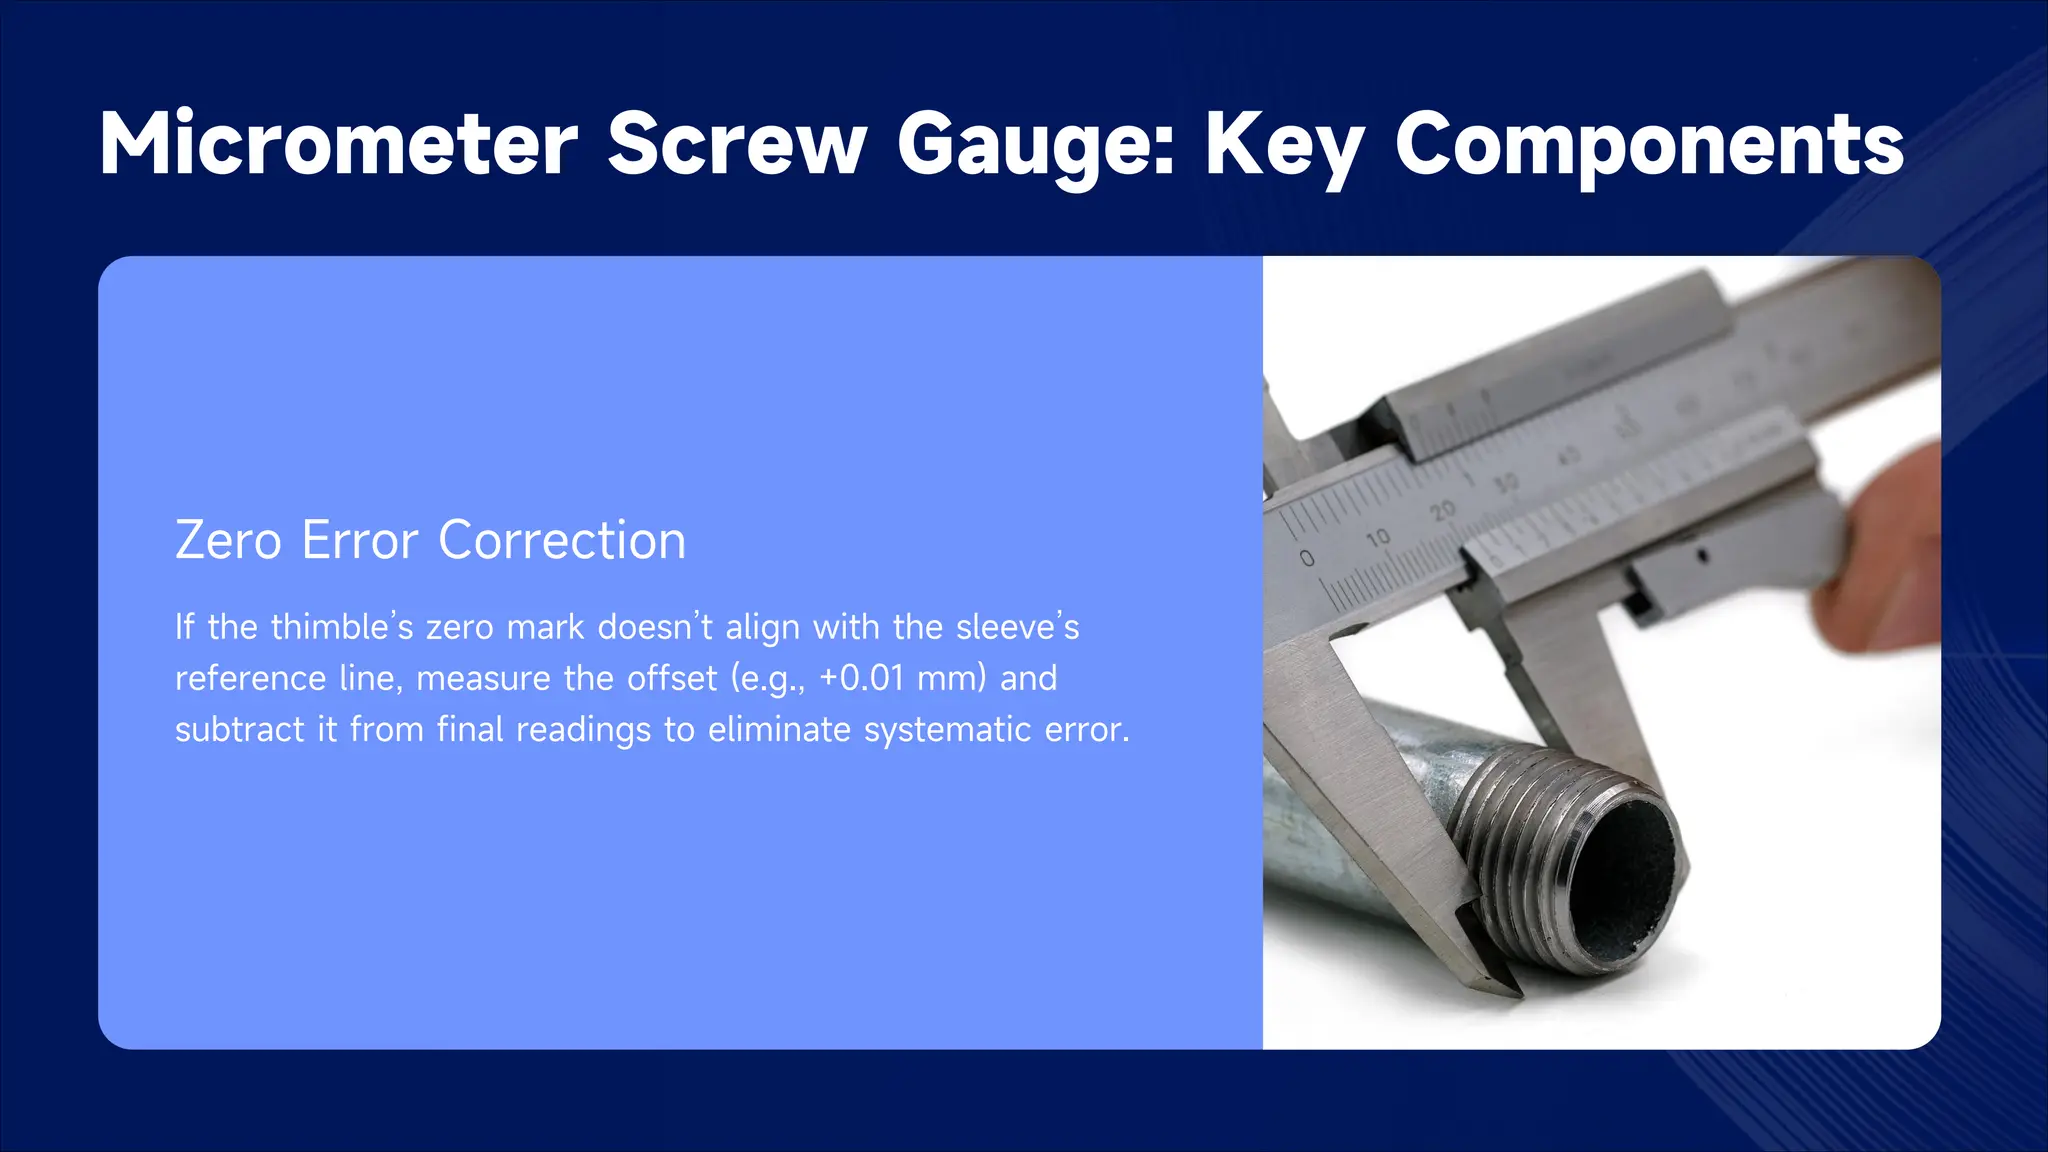
Zero Error Correction
If the thimble’s zero mark doesn’t align with the sleeve’s
reference line, measure the offset (e.g., +0.01 mm) and
subtract it from final readings to eliminate systematic error.
11.
Micrometer Reading Practice
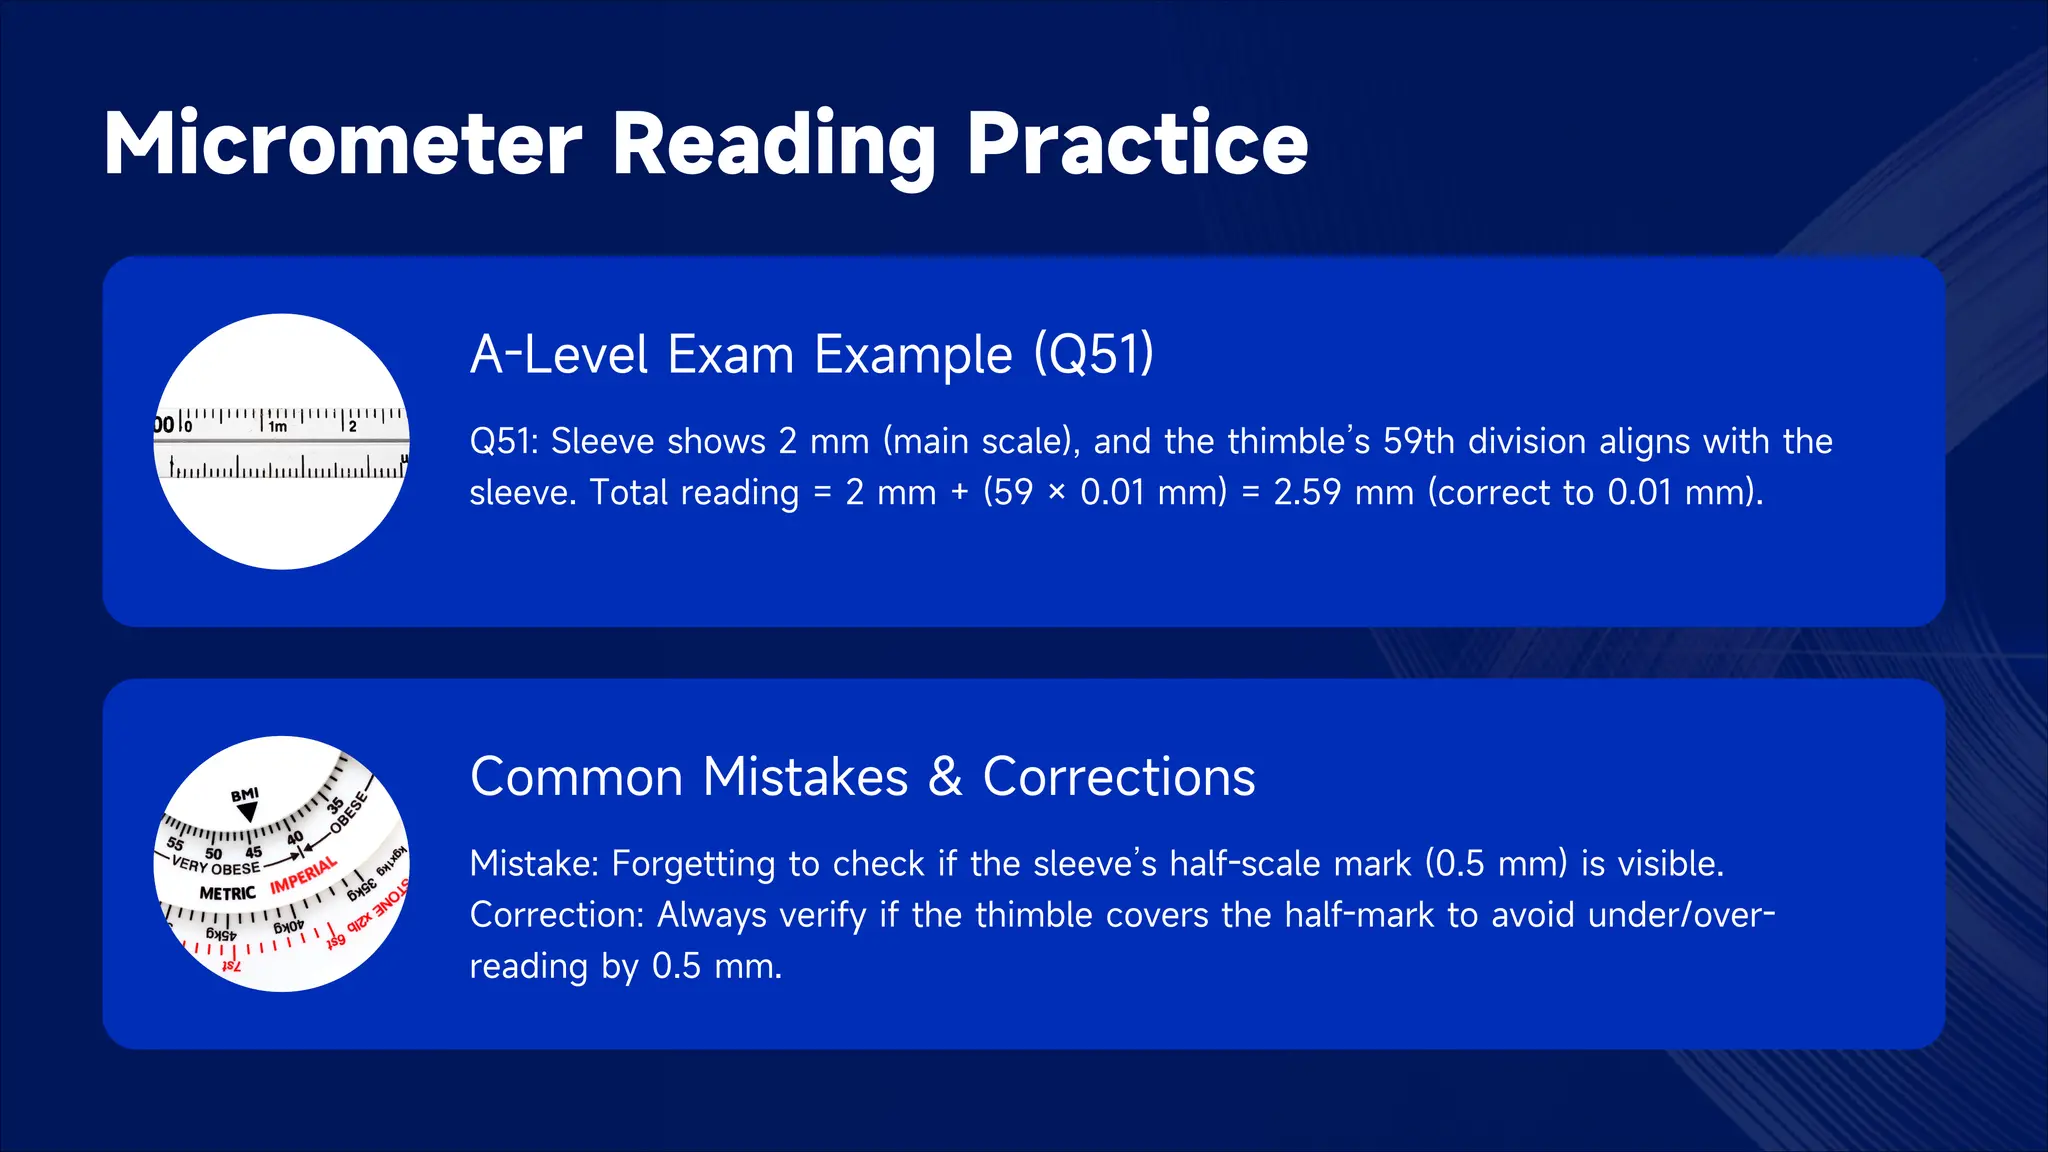
A-LevelExam Example (Q51)
Q51: Sleeve shows 2 mm (main scale), and the thimble’s 59th division aligns with the
sleeve. Total reading = 2 mm + (59 × 0.01 mm) = 2.59 mm (correct to 0.01 mm).
Common Mistakes & Corrections
Mistake: Forgetting to check if the sleeve’s half-scale mark (0.5 mm) is visible.
Correction: Always verify if the thimble covers the half-mark to avoid under/over-
reading by 0.5 mm.
12.
CRO Basics: Time-Base& Y-Gain
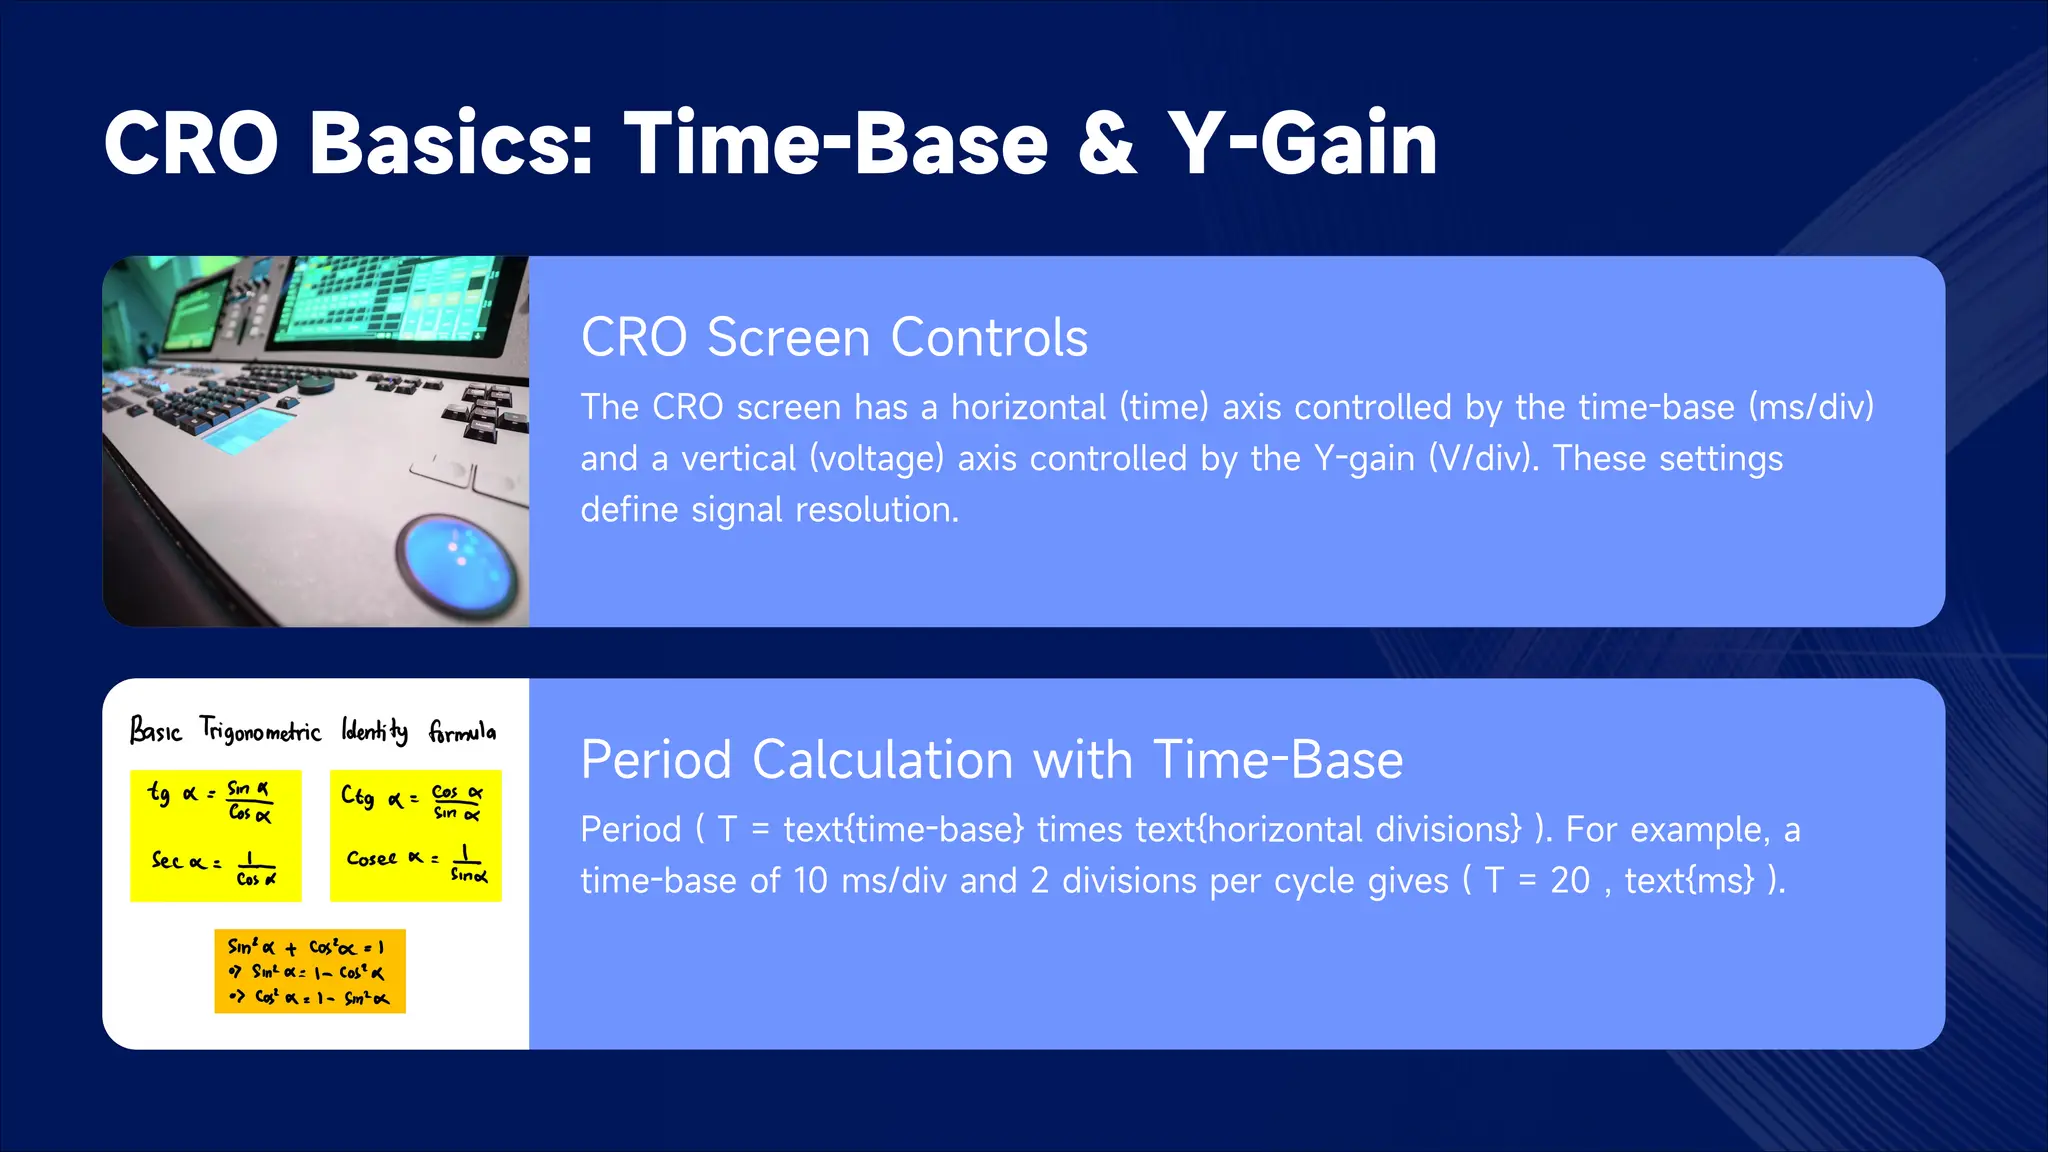
CRO Screen Controls
The CRO screen has a horizontal (time) axis controlled by the time-base (ms/div)
and a vertical (voltage) axis controlled by the Y-gain (V/div). These settings
define signal resolution.
Period Calculation with Time-Base
Period ( T = text{time-base} times text{horizontal divisions} ). For example, a
time-base of 10 ms/div and 2 divisions per cycle gives ( T = 20 , text{ms} ).
13.
CRO Basics: Time-Base& Y-Gain
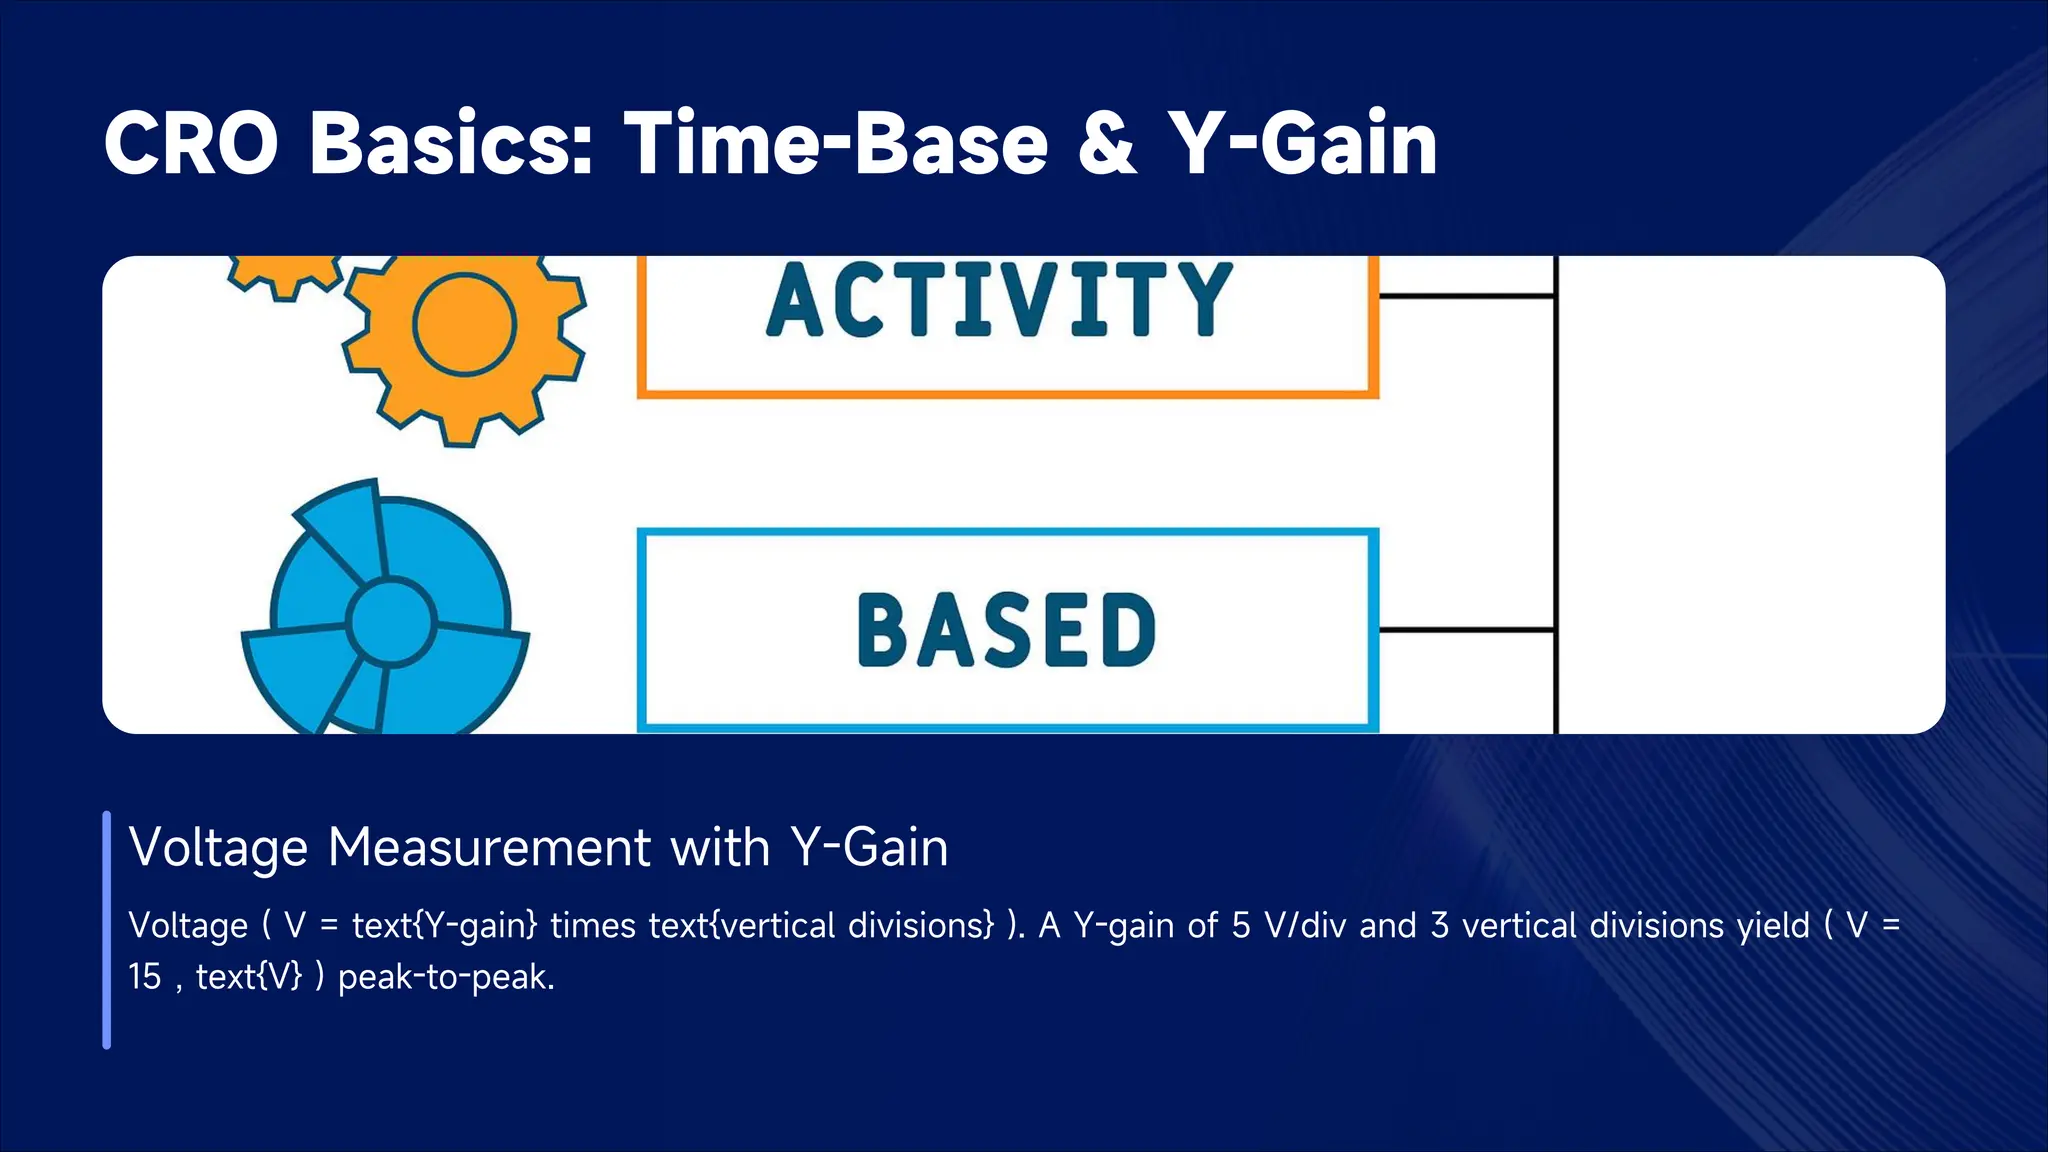
Voltage Measurement with Y-Gain
Voltage ( V = text{Y-gain} times text{vertical divisions} ). A Y-gain of 5 V/div and 3 vertical divisions yield ( V =
15 , text{V} ) peak-to-peak.
14.
CRO Waveform CalculationExample
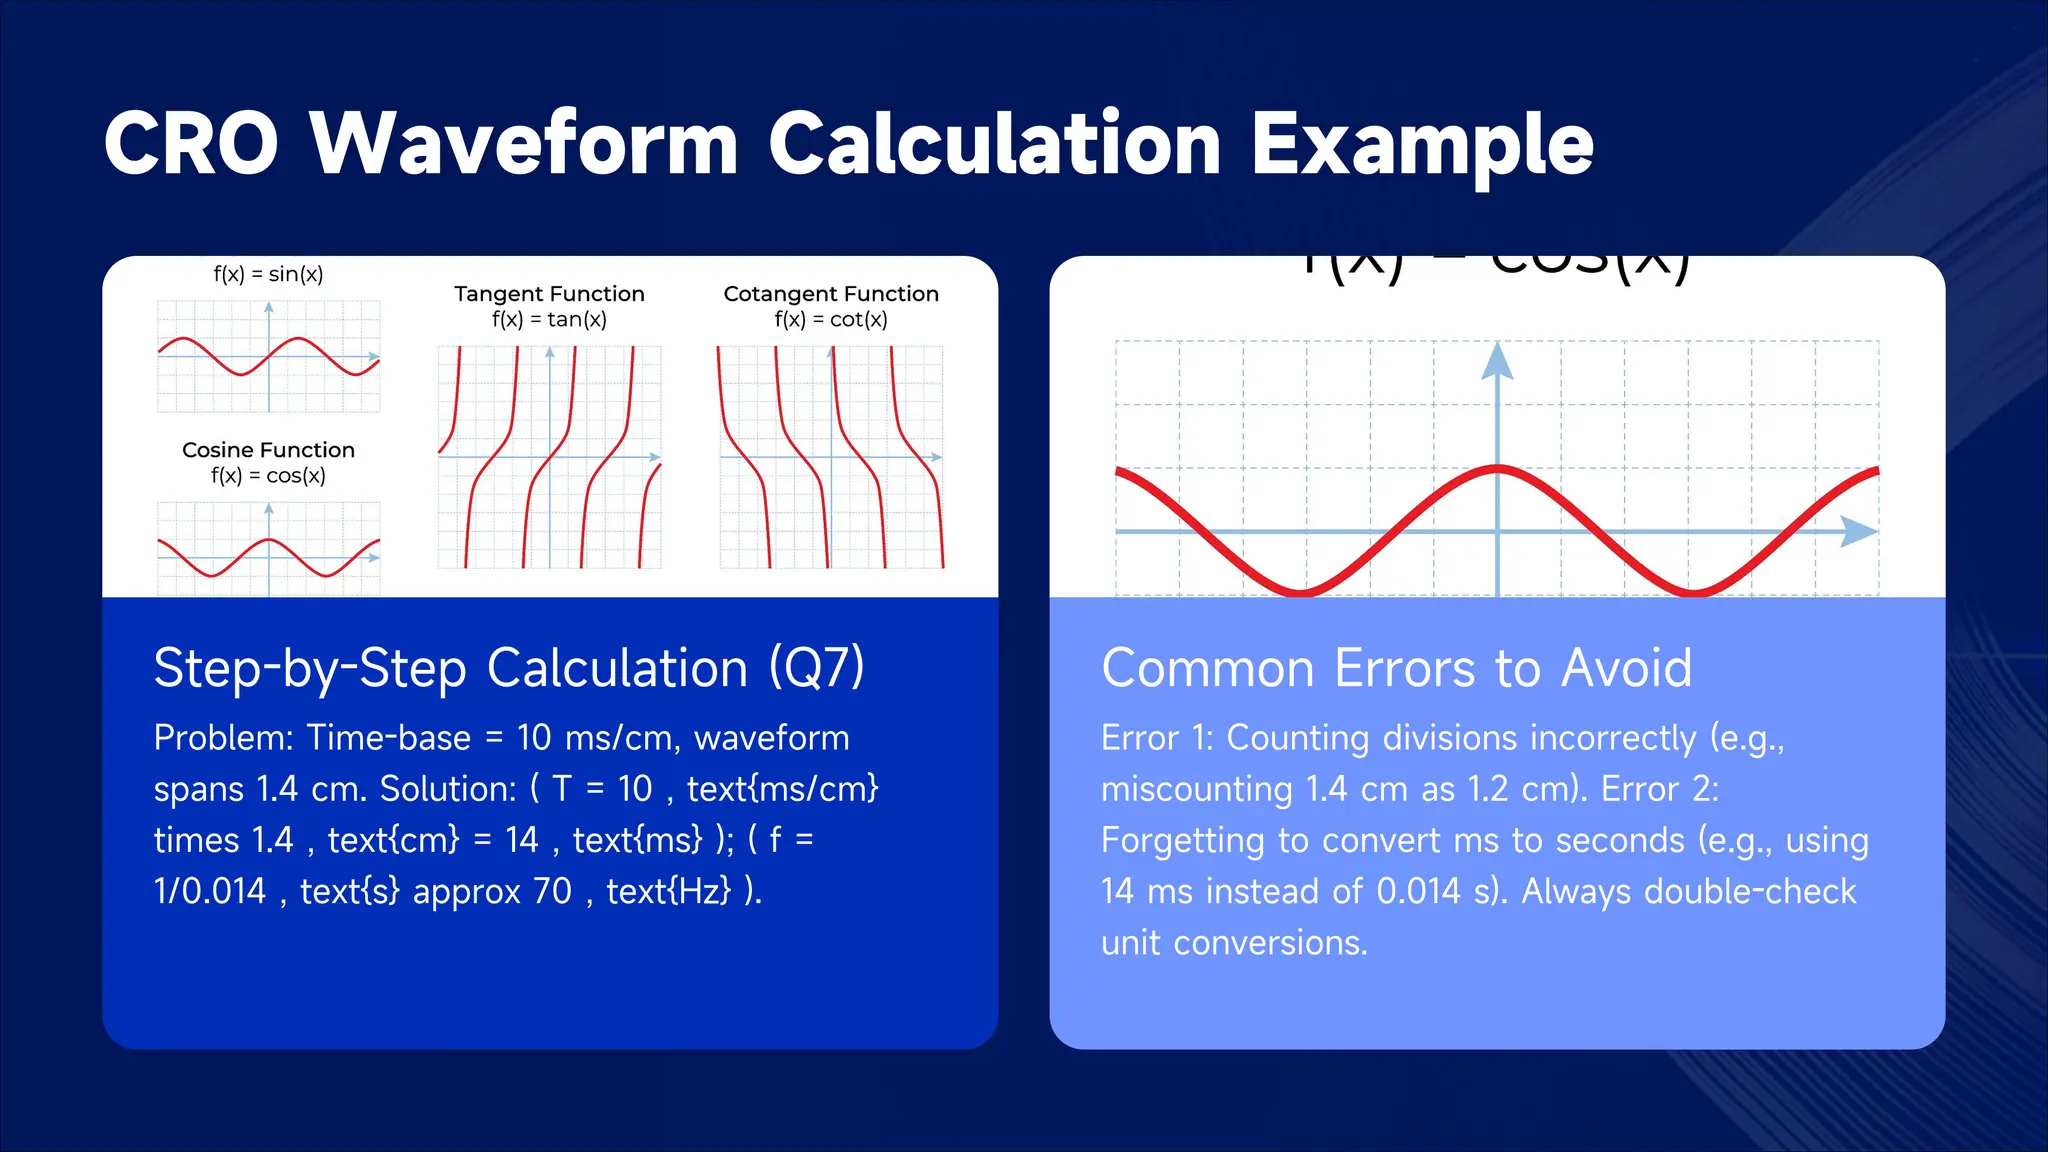
Step-by-Step Calculation (Q7)
Problem: Time-base = 10 ms/cm, waveform
spans 1.4 cm. Solution: ( T = 10 , text{ms/cm}
times 1.4 , text{cm} = 14 , text{ms} ); ( f =
1/0.014 , text{s} approx 70 , text{Hz} ).
Common Errors to Avoid
Error 1: Counting divisions incorrectly (e.g.,
miscounting 1.4 cm as 1.2 cm). Error 2:
Forgetting to convert ms to seconds (e.g., using
14 ms instead of 0.014 s). Always double-check
unit conversions.
15.
Mini-Project: Group MeasurementTasks
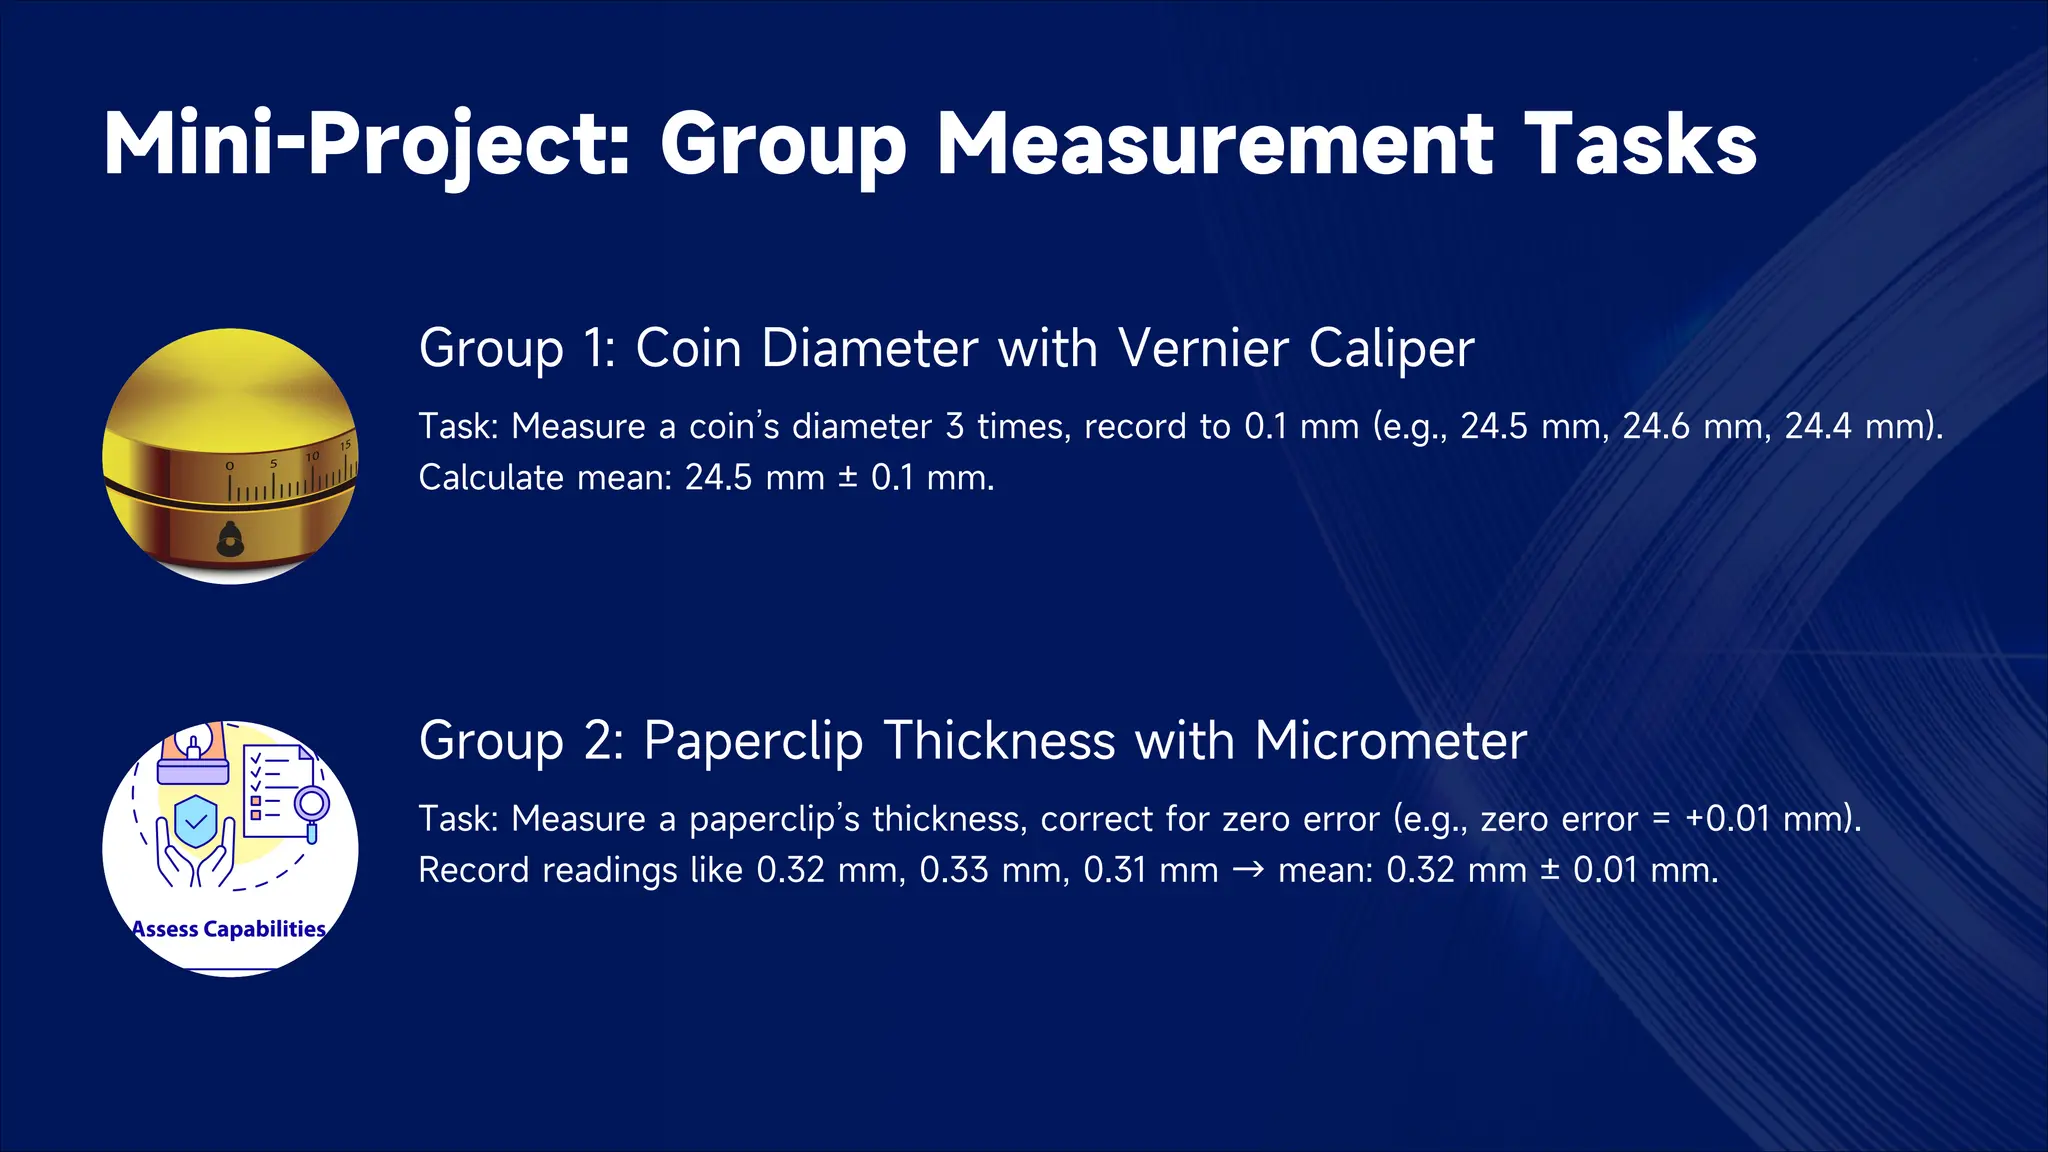
Group 1: Coin Diameter with Vernier Caliper
Task: Measure a coin’s diameter 3 times, record to 0.1 mm (e.g., 24.5 mm, 24.6 mm, 24.4 mm).
Calculate mean: 24.5 mm ± 0.1 mm.
Group 2: Paperclip Thickness with Micrometer
Task: Measure a paperclip’s thickness, correct for zero error (e.g., zero error = +0.01 mm).
Record readings like 0.32 mm, 0.33 mm, 0.31 mm → mean: 0.32 mm ± 0.01 mm.
16.
Mini-Project: Group
Measurement
Tasks
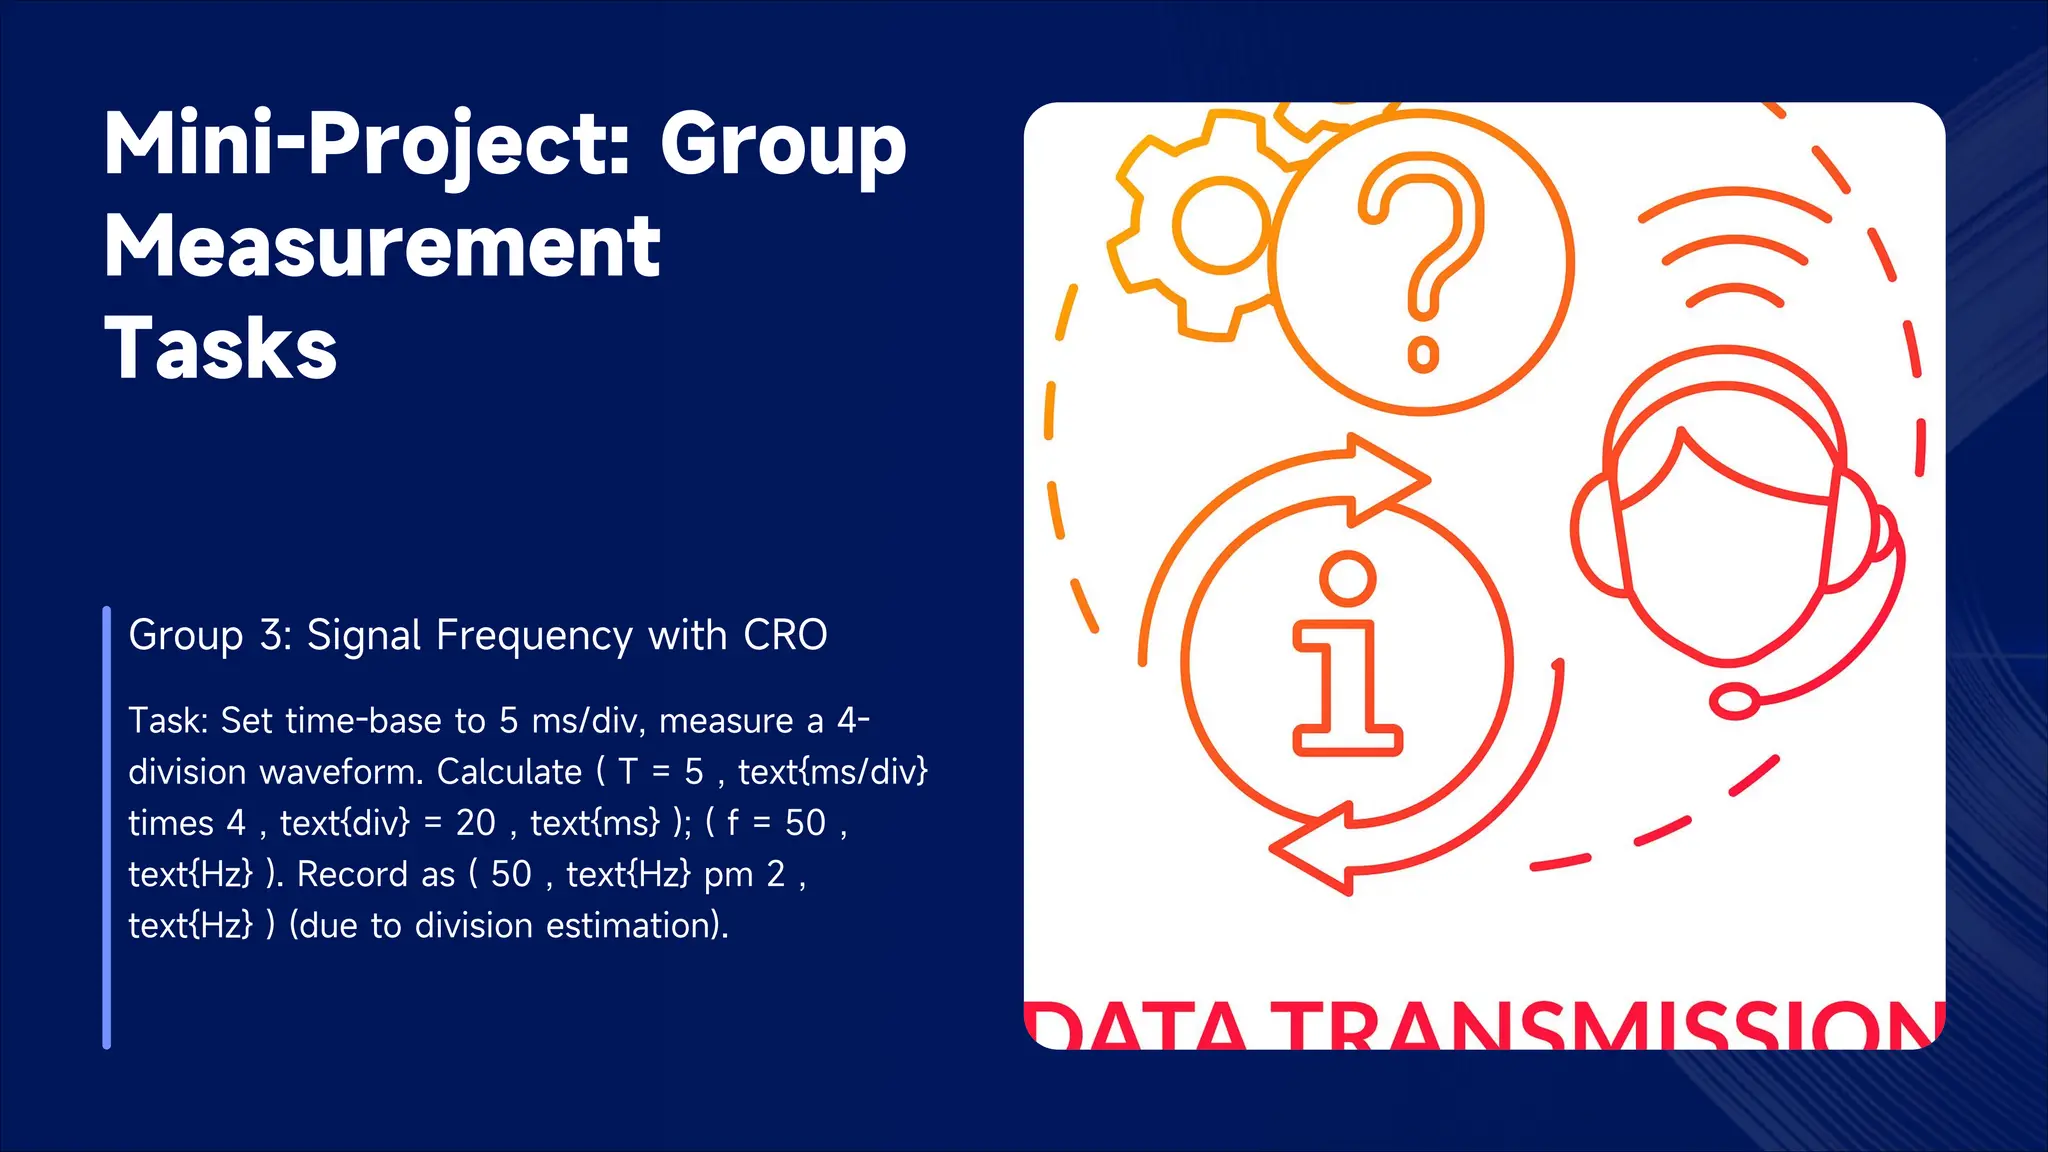
Group 3:Signal Frequency with CRO
Task: Set time-base to 5 ms/div, measure a 4-
division waveform. Calculate ( T = 5 , text{ms/div}
times 4 , text{div} = 20 , text{ms} ); ( f = 50 ,
text{Hz} ). Record as ( 50 , text{Hz} pm 2 ,
text{Hz} ) (due to division estimation).
Why Measurements
Are NeverPerfect
The Inevitability of Deviation
Show images of an uncalibrated scale giving inconsistent weights and a scatter
plot of data points from a poorly - controlled experiment. Pose the question: “Why
do measurements deviate from the true value?” In scientific experiments, no
measurement is completely free from error. This is a fundamental concept that
students need to understand.
19.
Why Measurements
Are NeverPerfect
A - Level Exam Significance
Link to the A - Level exam focus: 30% of questions in A - Level 9702
are related to error analysis. This highlights the importance of
mastering the reasons behind measurement imperfections for exam
success.
20.
Systematic vs. RandomErrors
Definition Comparison
Present a comparison table with columns for “Type”, “Definition”,
“Example”, and “Reduction Method”. For systematic errors,
define it as a consistent, one - directional deviation. For random
errors, define it as unpredictable scatter in measurements.
21.
Systematic vs. RandomErrors
A - Level Examples
Use examples from A - Level questions: In Q4, a timer starting late is a systematic error as it makes all time
measurements too long. In Q5, manual timing leading to g values ranging from 4.88 - 4.93 ms⁻² shows random
error.
22.
Systematic vs. RandomErrors
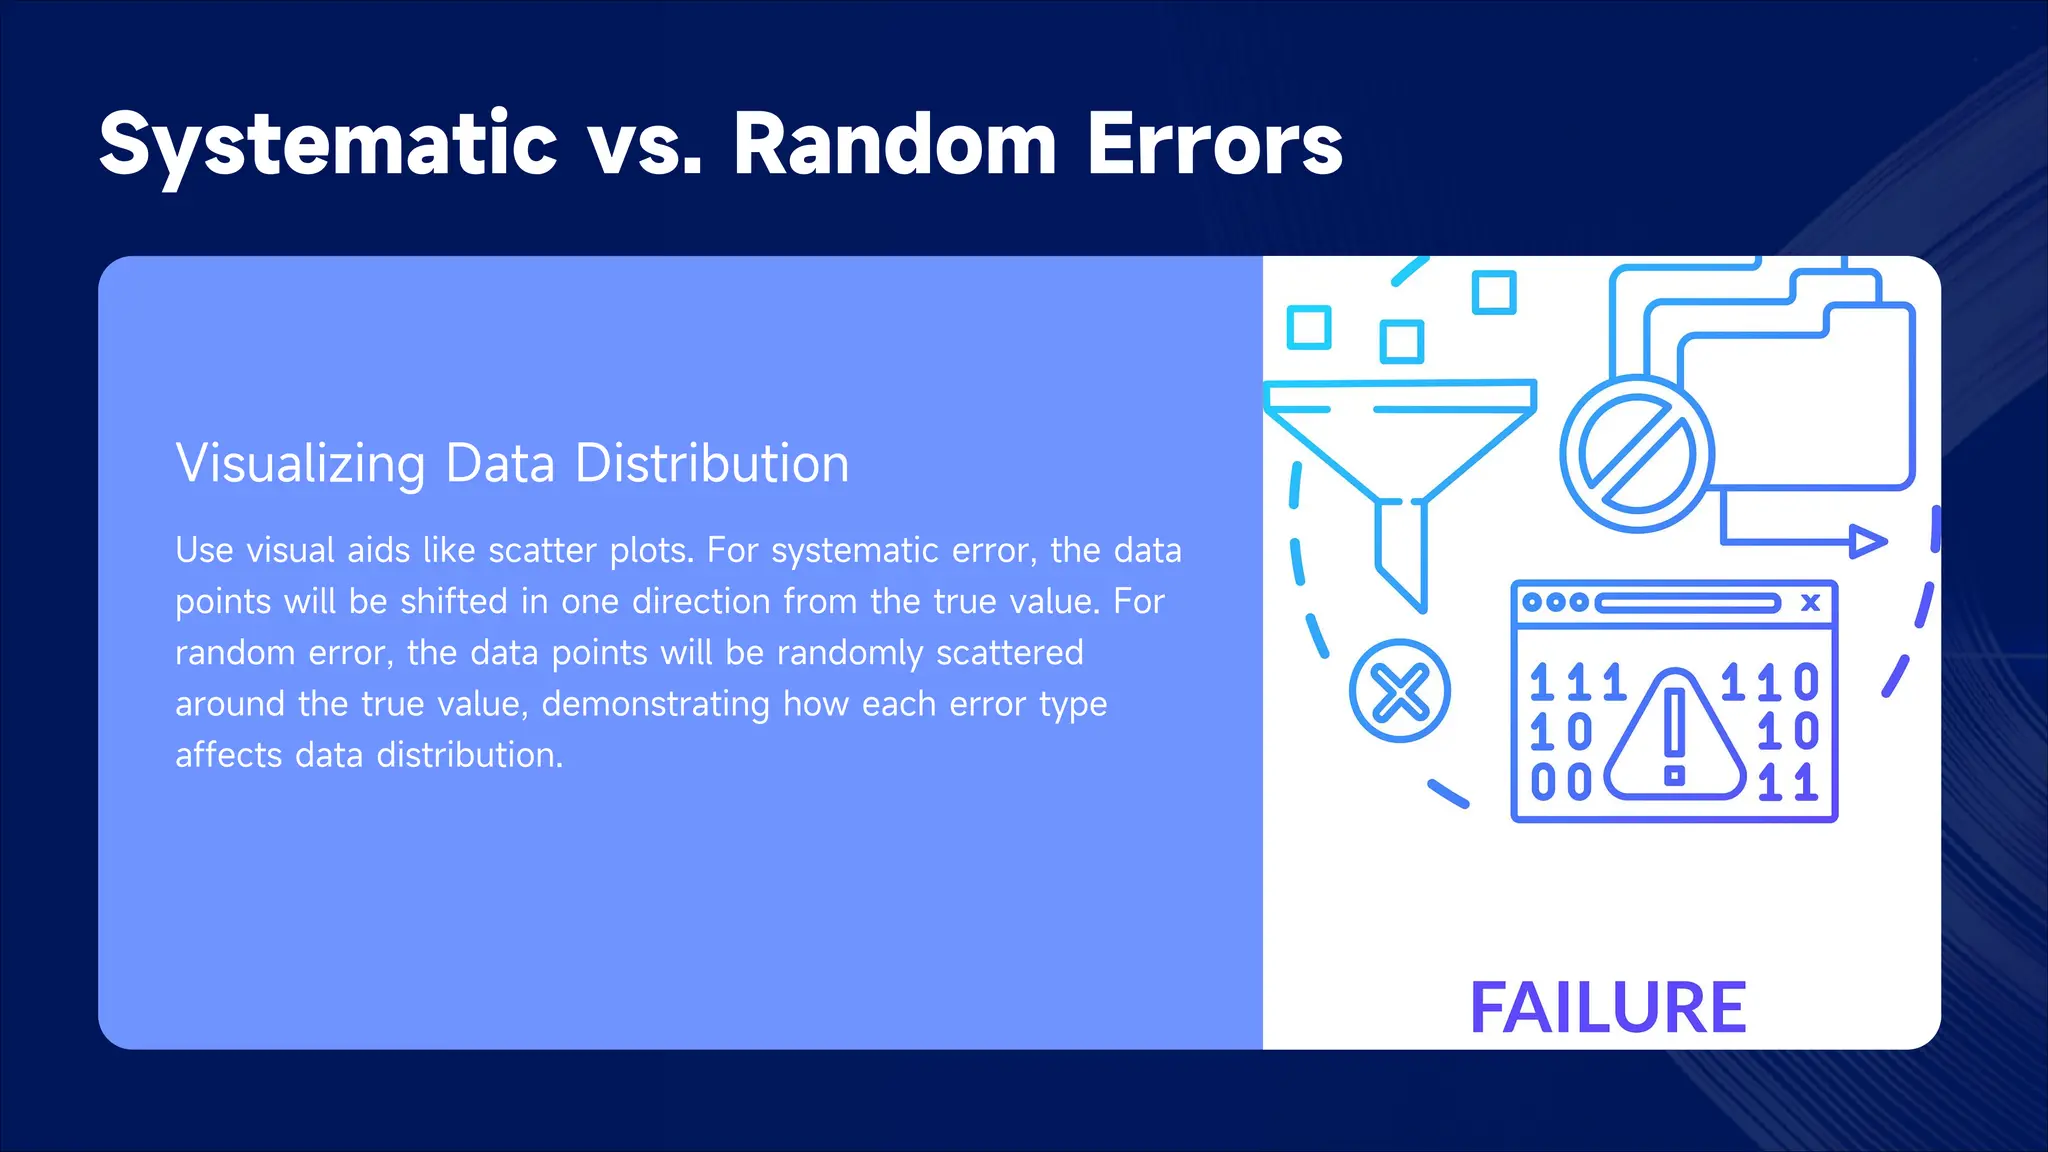
Visualizing Data Distribution
Use visual aids like scatter plots. For systematic error, the data
points will be shifted in one direction from the true value. For
random error, the data points will be randomly scattered
around the true value, demonstrating how each error type
affects data distribution.
23.
Absolute Uncertainty: InstrumentLimits
Defining Absolute Uncertainty
Define absolute uncertainty as the maximum error associated with an instrument. For instance, a meter ruler
typically has an absolute uncertainty of ±0.5 mm. This is the limit of the instrument's precision.
24.
Absolute Uncertainty: InstrumentLimits
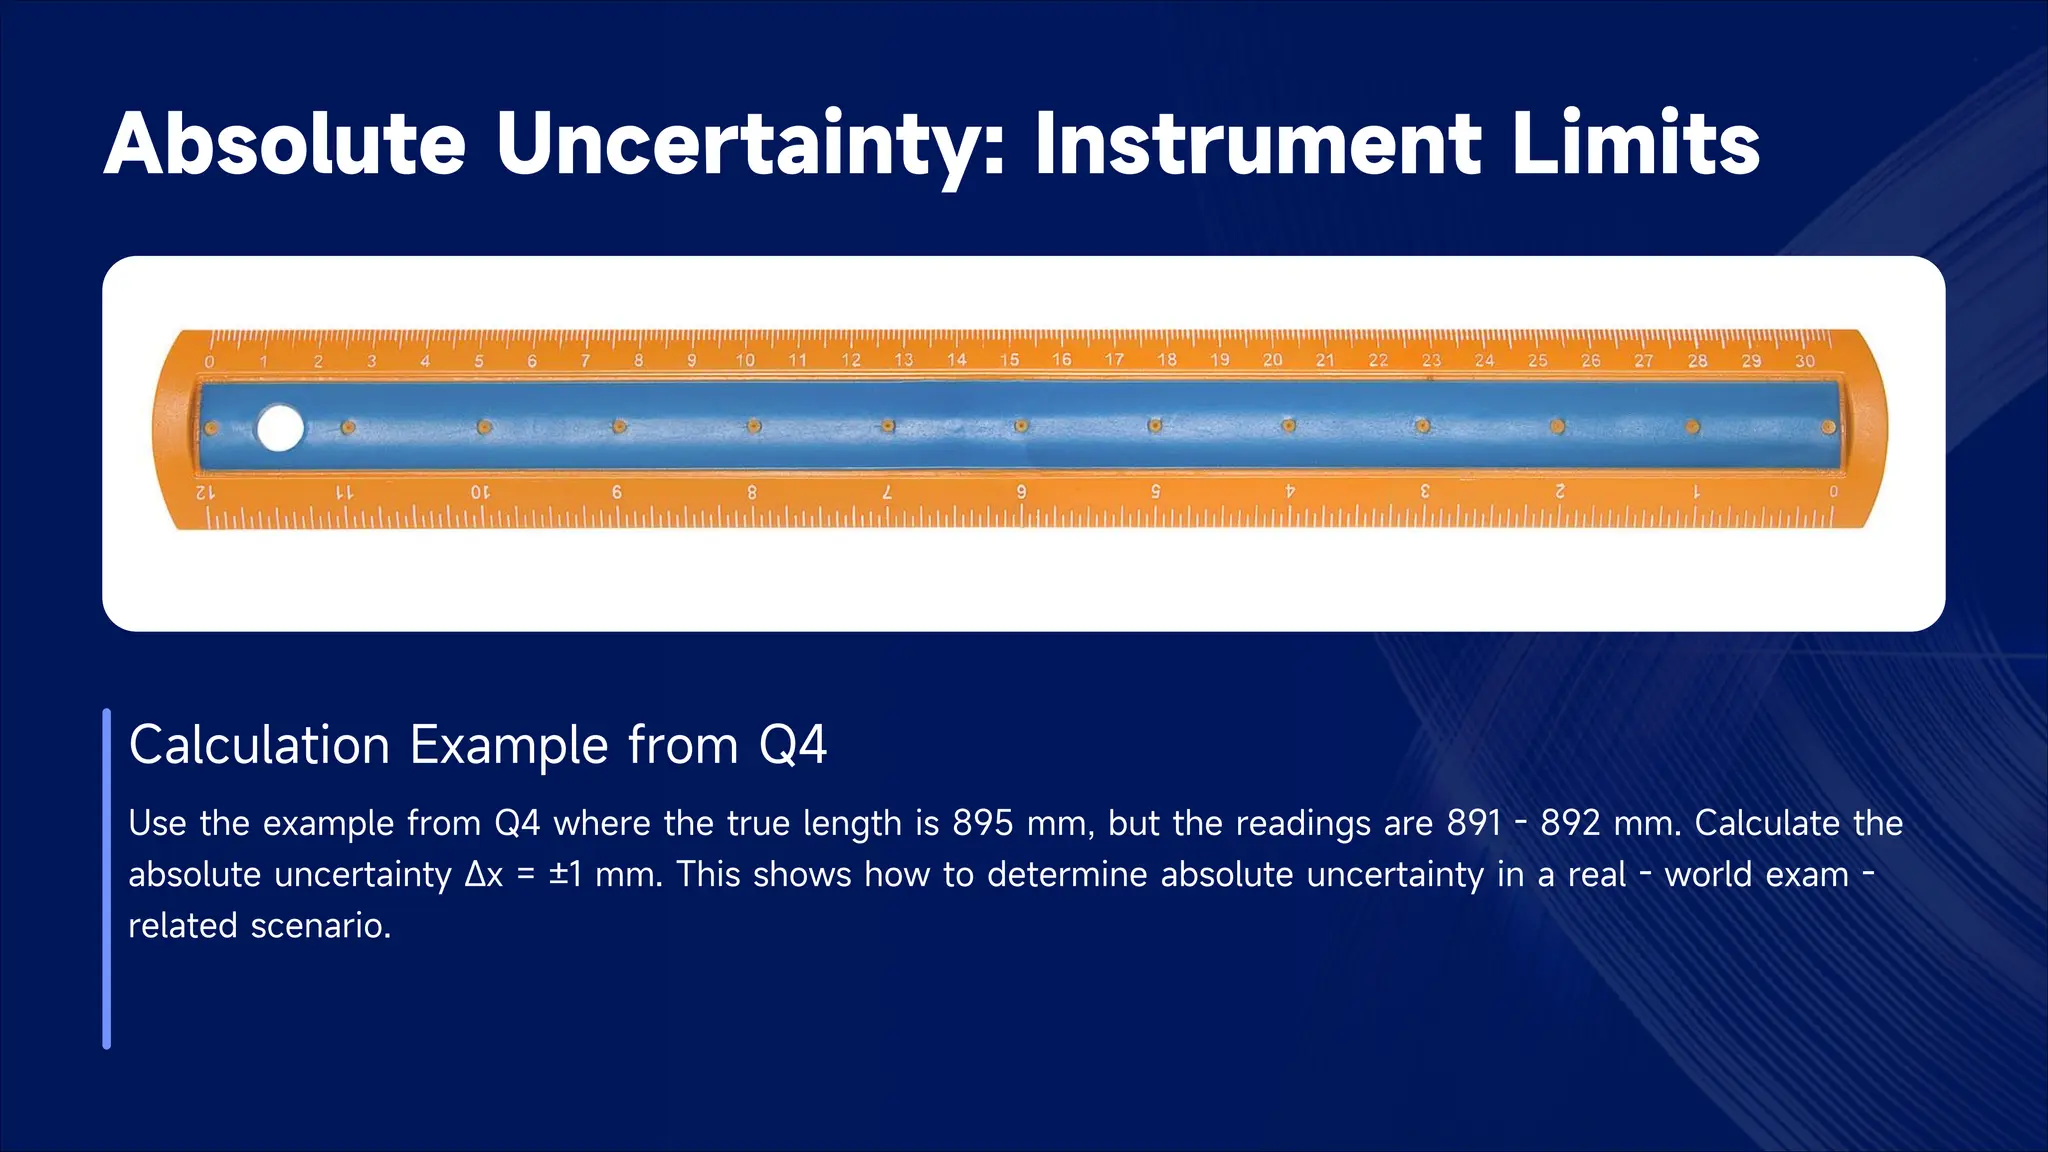
Calculation Example from Q4
Use the example from Q4 where the true length is 895 mm, but the readings are 891 - 892 mm. Calculate the
absolute uncertainty Δx = ±1 mm. This shows how to determine absolute uncertainty in a real - world exam -
related scenario.
25.
Relative Uncertainty: ProportionalError
The Relative Uncertainty Formula
Explain the relative uncertainty formula: Relative Uncertainty =
(Δx/x × 100%). This formula gives the error as a percentage of
the measured value, providing a way to compare the reliability
of different measurements.
26.
Relative Uncertainty:
Proportional Error
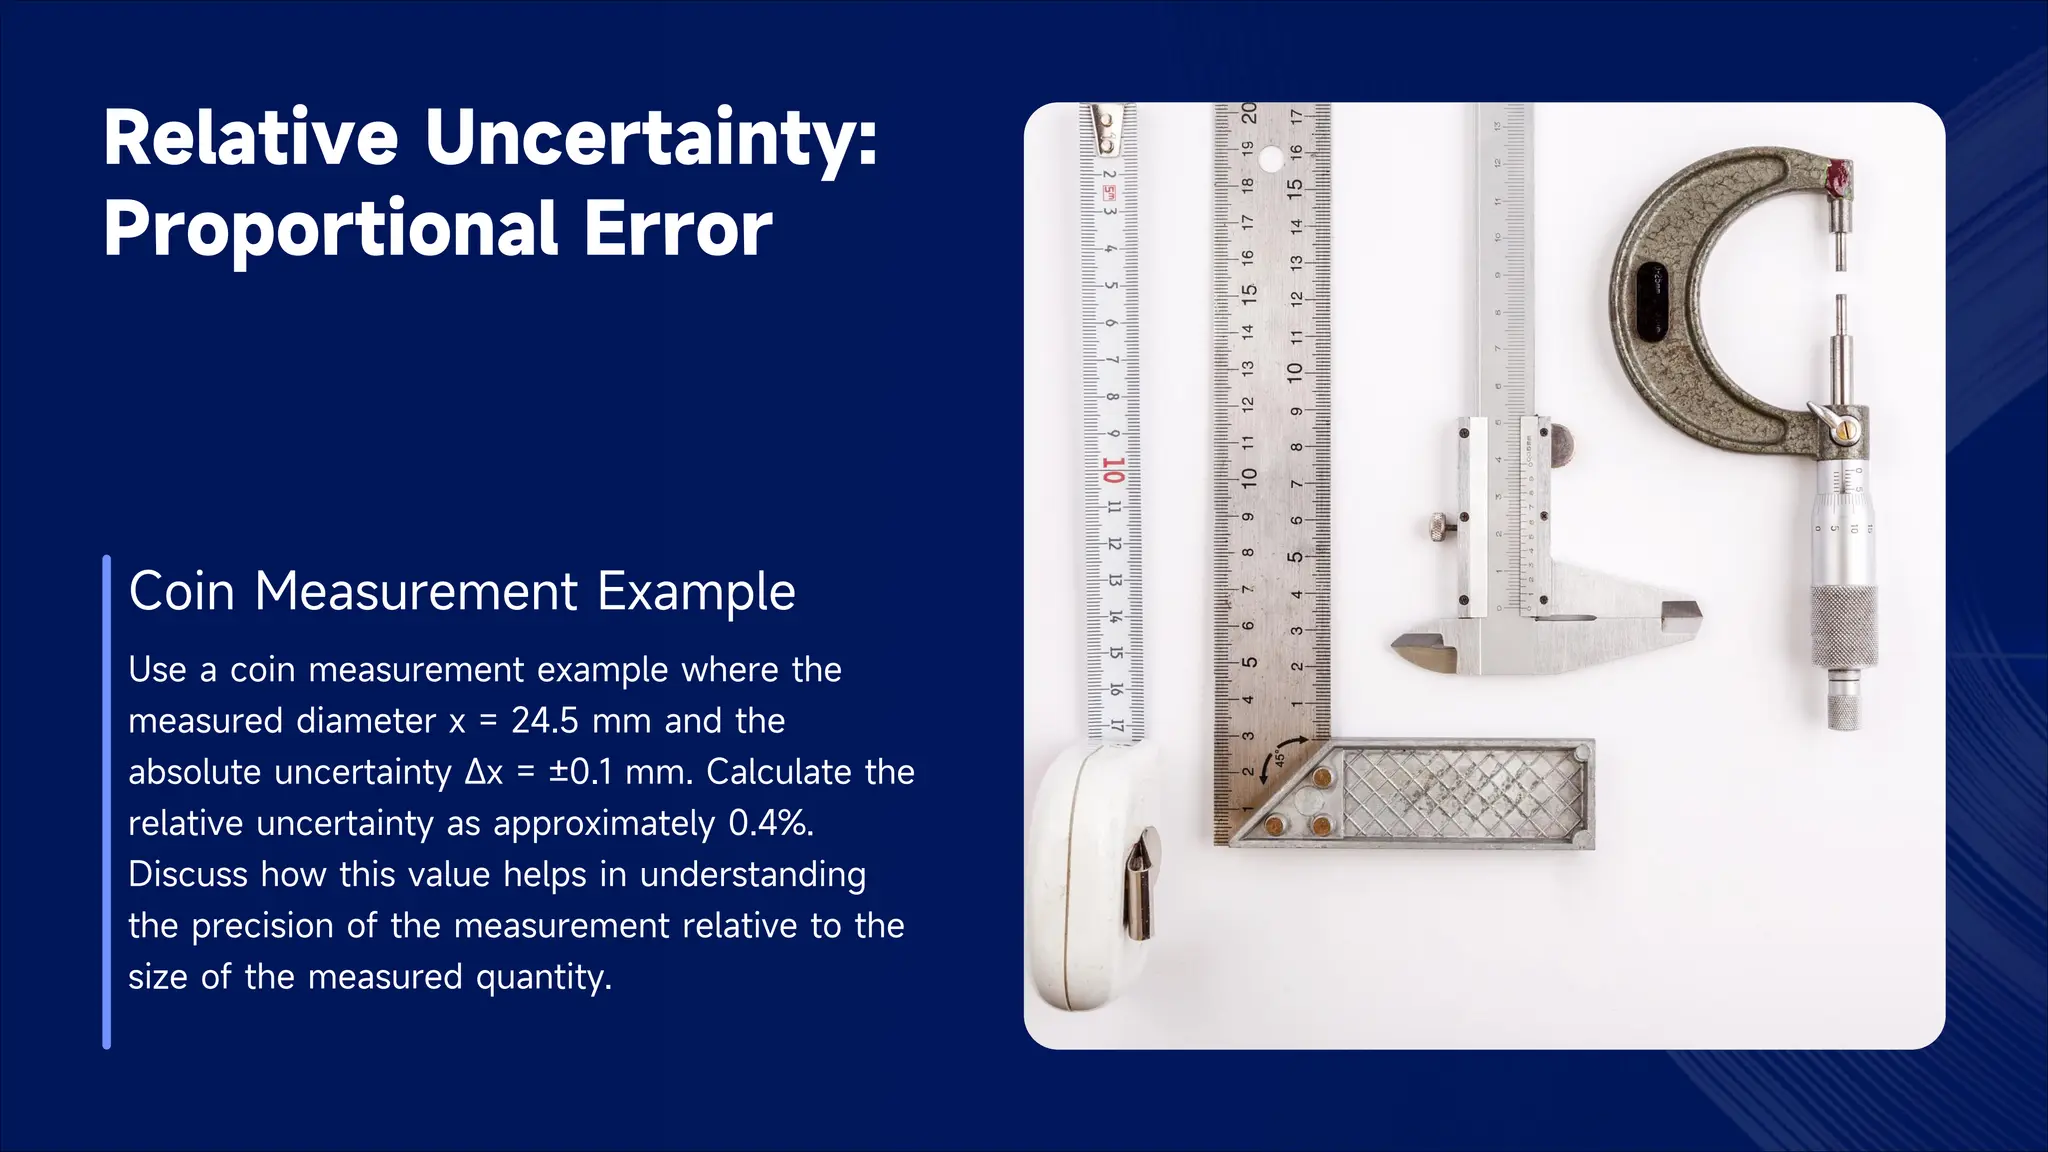
CoinMeasurement Example
Use a coin measurement example where the
measured diameter x = 24.5 mm and the
absolute uncertainty Δx = ±0.1 mm. Calculate the
relative uncertainty as approximately 0.4%.
Discuss how this value helps in understanding
the precision of the measurement relative to the
size of the measured quantity.
27.
Uncertainty Propagation Rules
Rulesfor Addition/Subtraction
Present the rule for addition and subtraction: Δ(a ± b)=Δa + Δb.
When combining measurements through addition or subtraction,
the absolute uncertainties add up. This is a crucial rule for
calculating the overall uncertainty in such cases.
28.
Uncertainty
Propagation Rules
Rules forMultiplication/Division
For multiplication and division, the rule is Δ(a/b)/(a/b)=Δa/a + Δb/b.
When measurements are multiplied or divided, the relative
uncertainties add. This rule is essential for experiments involving these
operations.
29.
Uncertainty
Propagation Rules
Rules forPower Laws
For power laws, the rule is Δ(aⁿ)/aⁿ = n×Δa/a. When a measurement is
raised to a power, the relative uncertainty is multiplied by the exponent.
Use the Q5 example where P = V²/R, with ΔV/V = 3% and ΔR/R = 2% to
derive ΔP/P = 8% to illustrate these rules in an exam - relevant context.
30.
Pendulum Experiment: ErrorAnalysis
Measurement Steps
Guide students through the steps of measuring the pendulum length (L) using a meter ruler with an uncertainty of
±0.5 mm and the period (T) using a stopwatch with an uncertainty of ±0.1 s for 10 oscillations. These
measurements are the basis for calculating the acceleration due to gravity (g).
31.
Pendulum Experiment: ErrorAnalysis
Calculating g and Uncertainty Propagation
Show how to calculate g = 4π²L/T². Also, include the uncertainty propagation formula Δg/g = ΔL/L + 2ΔT/T. This
formula takes into account the uncertainties in L and T to determine the uncertainty in g.
32.
Pendulum Experiment: ErrorAnalysis
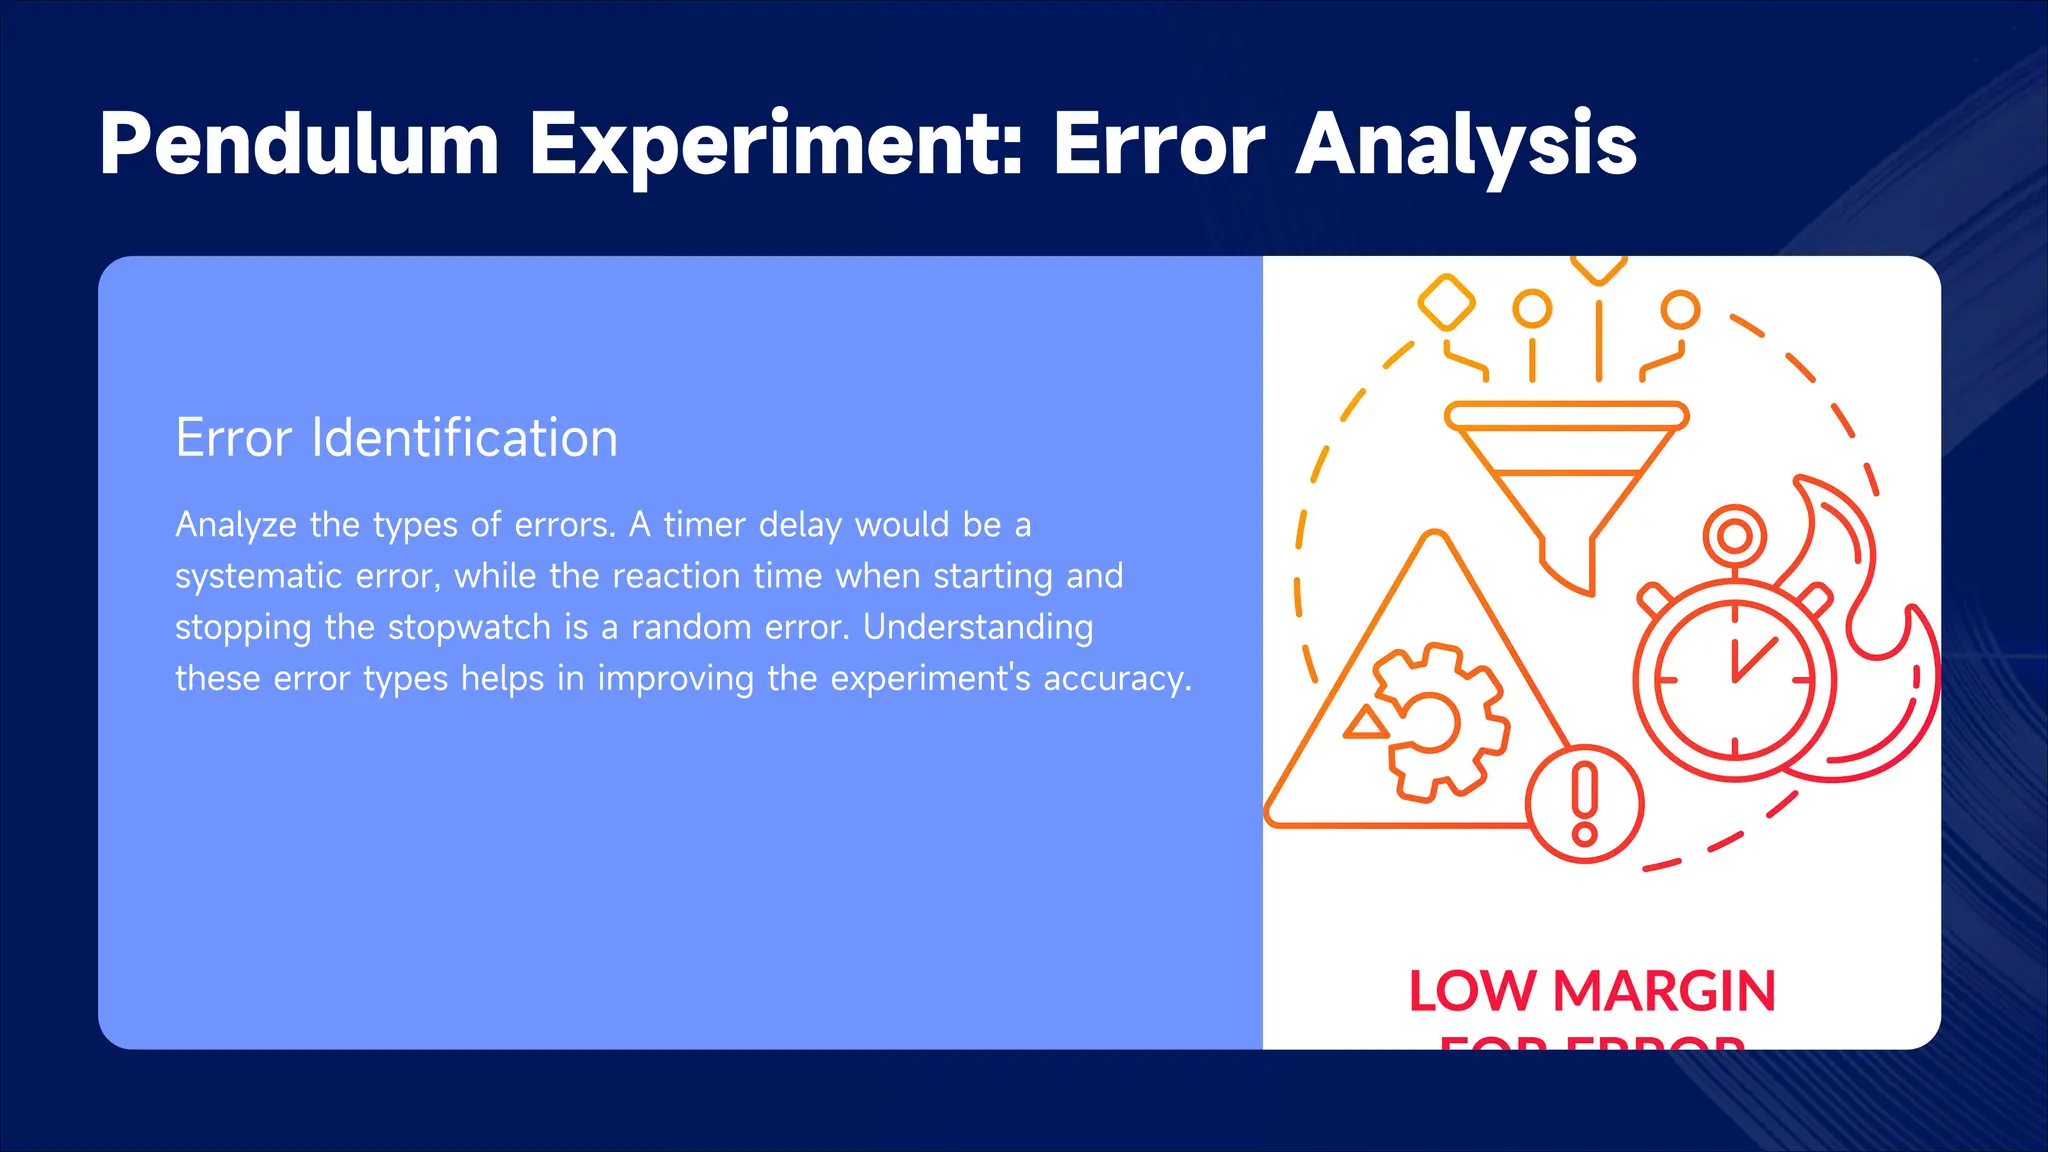
Error Identification
Analyze the types of errors. A timer delay would be a
systematic error, while the reaction time when starting and
stopping the stopwatch is a random error. Understanding
these error types helps in improving the experiment's accuracy.
33.
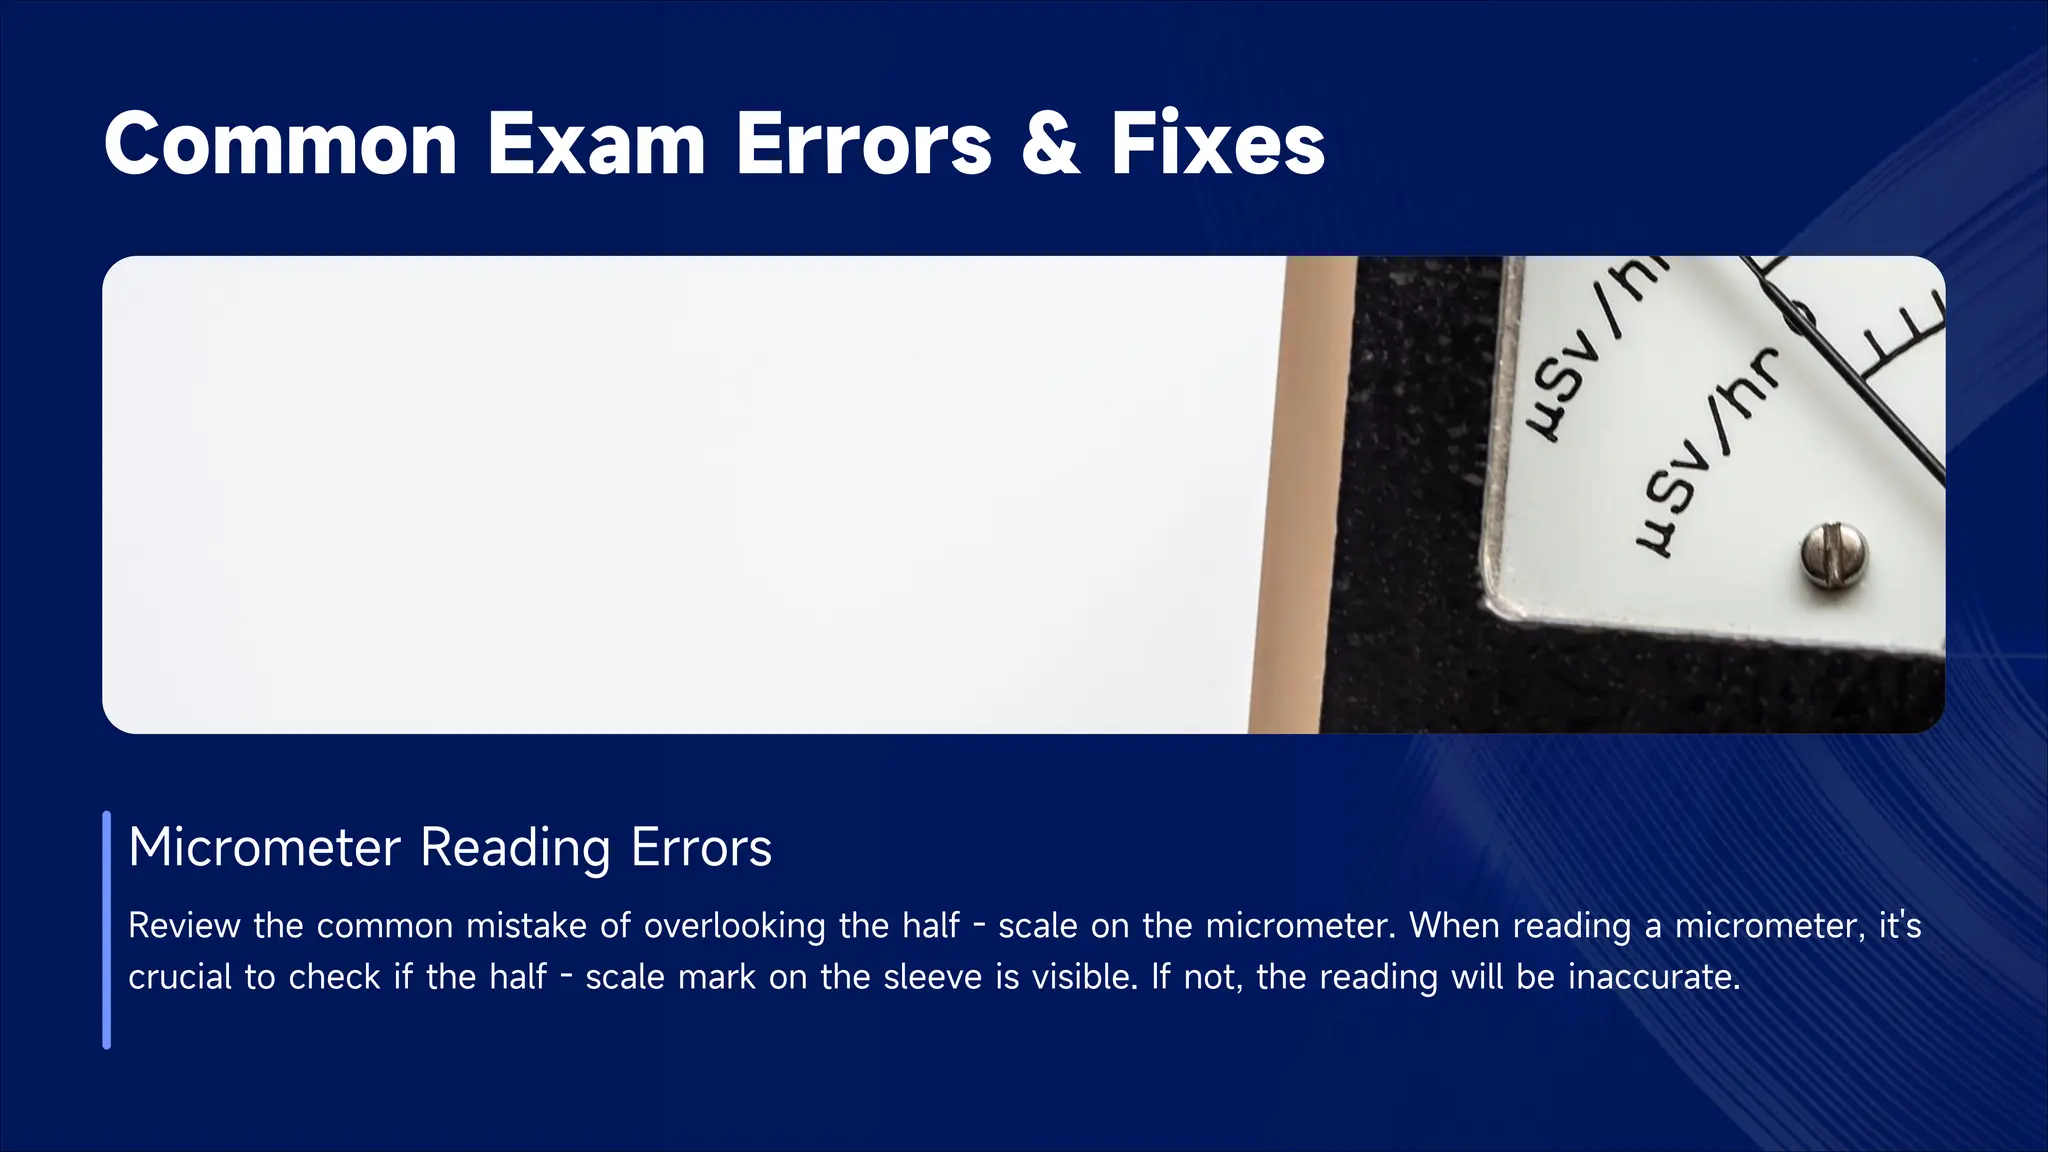
Common Exam Errors& Fixes
Micrometer Reading Errors
Review the common mistake of overlooking the half - scale on the micrometer. When reading a micrometer, it's
crucial to check if the half - scale mark on the sleeve is visible. If not, the reading will be inaccurate.
34.
Common Exam Errors& Fixes
CRO Division Counting Errors
For the cathode - ray oscilloscope (CRO), miscounting the
divisions can lead to incorrect calculations of period or voltage.
Using the grid lines on the CRO screen carefully can help
avoid this error.
35.
Common Exam
Errors &Fixes
Uncertainty Propagation Mistakes
Errors in uncertainty propagation, such as using the wrong formula for
a particular operation, are common. Provide correction strategies like
double - checking the formula based on whether the operation is
addition, subtraction, multiplication, division, or a power law.
36.
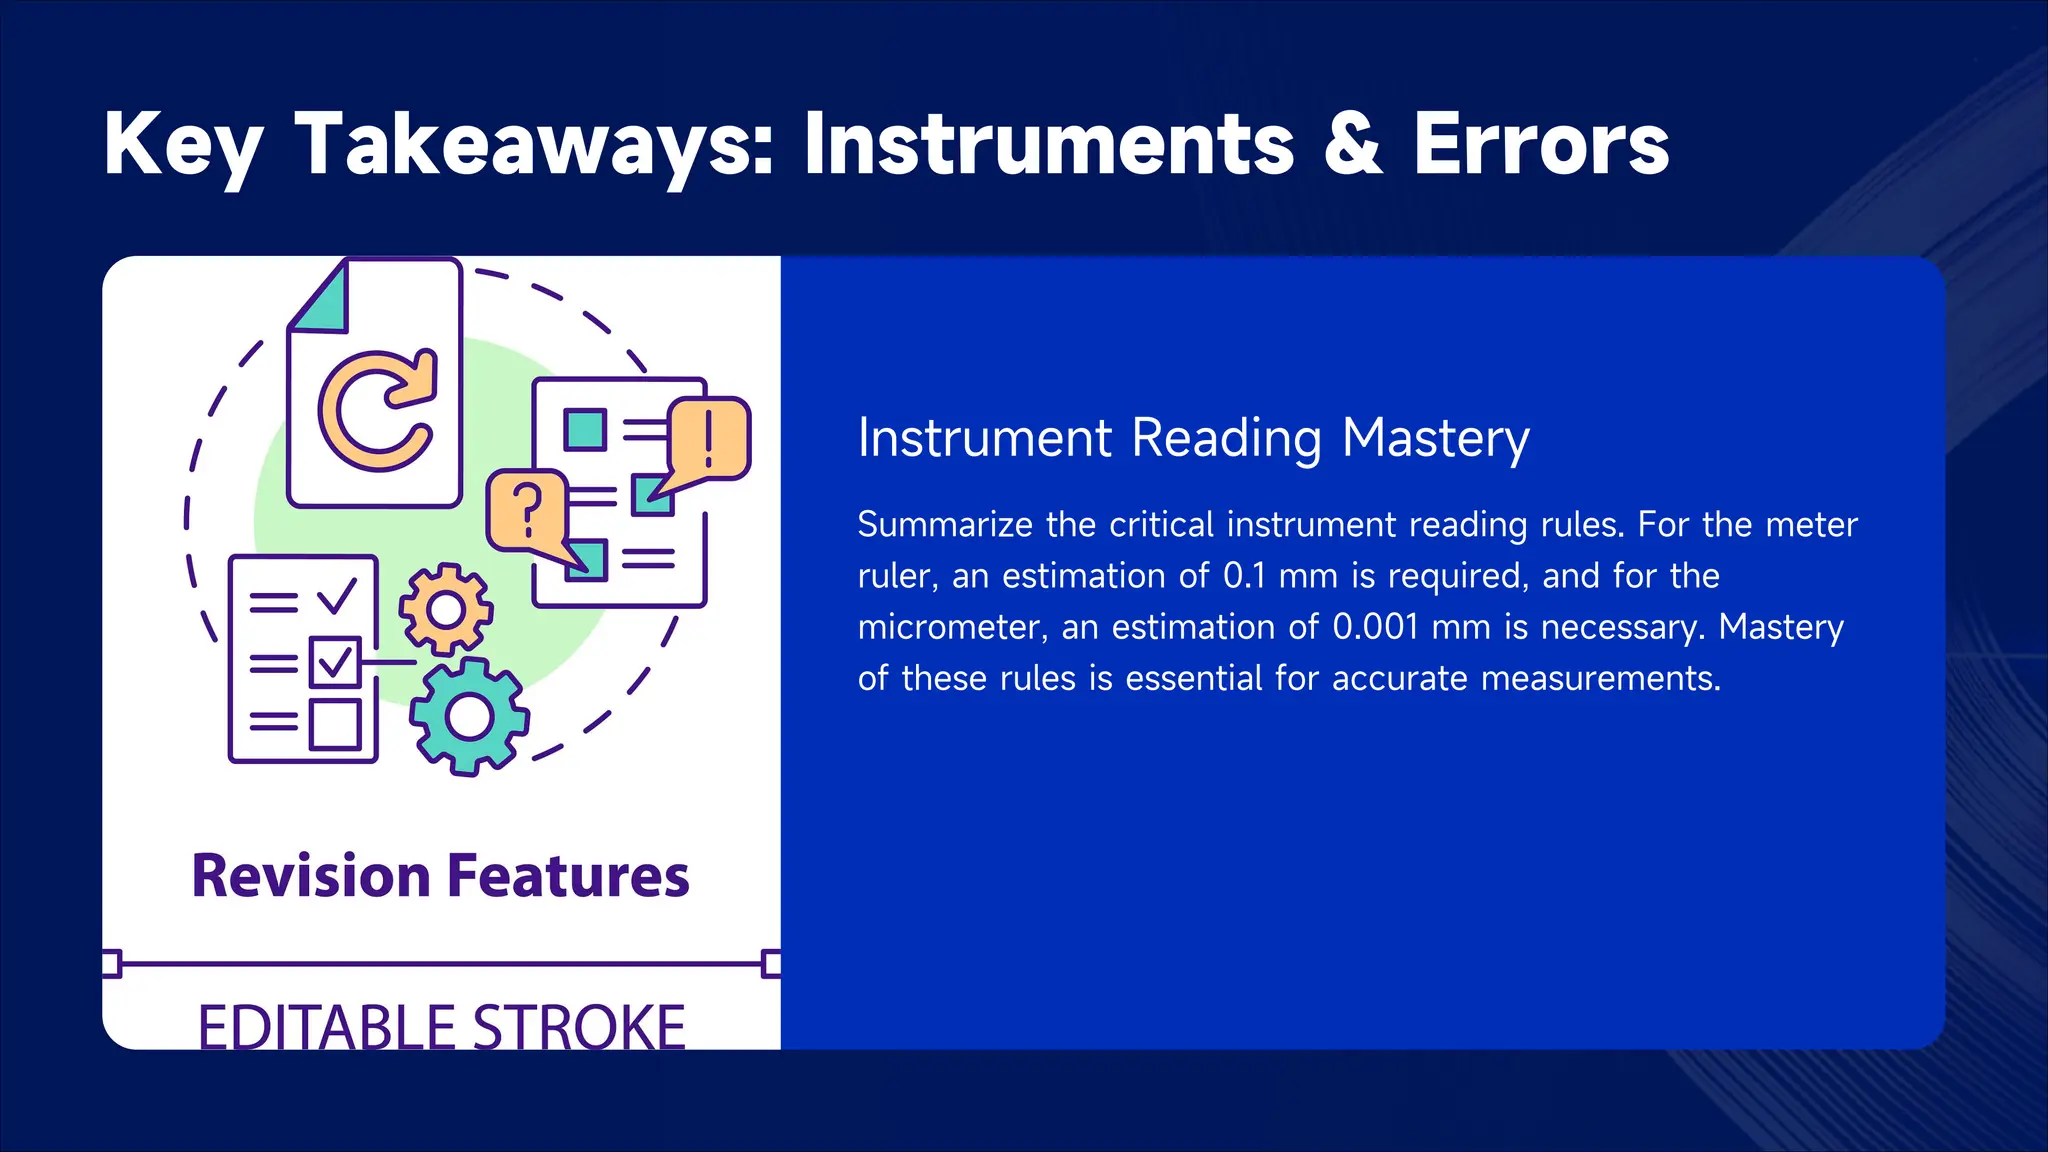
Key Takeaways: Instruments& Errors
Instrument Reading Mastery
Summarize the critical instrument reading rules. For the meter
ruler, an estimation of 0.1 mm is required, and for the
micrometer, an estimation of 0.001 mm is necessary. Mastery
of these rules is essential for accurate measurements.
37.
Key Takeaways: Instruments& Errors
01
Error Type Comprehension
Emphasize the understanding of error types.
Differentiating between systematic (consistent) and
random (scattered) errors is key to analyzing and
improving experimental results.
02
Uncertainty Skills
Highlight the importance of being able to calculate
absolute and relative uncertainty, as well as
propagate uncertainty through different mathematical
operations. These skills are fundamental in
experimental physics.
38.
Exam Practice: PastPaper Questions
Question Q4 Walk - through
Display A - Level question Q4 and walk students through the solution. Show how to identify the systematic error
(e.g., timer delay) and use the relevant concepts of error analysis to answer the question correctly.
39.
Exam Practice:
Past Paper
Questions
QuestionQ5 Walk - through
For question Q5, demonstrate how to handle
random error in g measurements and perform
uncertainty propagation. This includes using the
appropriate formulas and understanding the
context of the experiment described in the
question.
40.
Exam Practice: PastPaper Questions
Question Q7 Walk - through
With question Q7, show how to apply the knowledge of CRO frequency calculation. This involves correctly using
the time - base and waveform span information to calculate the frequency, highlighting how to apply instrument
- related knowledge in an exam setting.
41.
Homework: Density
of aCube
Experiment
Experiment Design Requirement
Assign the task of designing a “density of a cube” experiment. Students
are required to list the instruments they would use, such as a ruler for
measuring side lengths and a balance for measuring mass.
42.
Homework: Density ofa Cube Experiment
Data Recording and Uncertainty Calculation
Emphasize the need to record data accurately and calculate
the uncertainty associated with each measurement. For
example, the uncertainty in the side length measurement
using a ruler and how it propagates to the density calculation.
43.
Homework: Density
of aCube
Experiment
Error Analysis Requirement
Students should analyze the
errors in the experiment,
identifying possible systematic
and random errors. Provide a
template for structured reporting
to help students organize their
thoughts and present their
findings clearly.
44.
Next Class: LabSession Preview
Hands - on Instrument Practice
Tease the upcoming lab session by highlighting that students will get hands - on practice with various
instruments. This includes using rulers, micrometers, and potentially CROs in a real - world experimental setting.
45.
Next Class: LabSession Preview
Error Analysis in Practice
Explain that the lab session will also involve error analysis.
Students will apply the concepts learned in class to real
experiments, measuring quantities, calculating uncertainties,
and identifying error types.
46.
Next Class: LabSession Preview
Encouraging Preparation
Encourage students to prepare for the lab session by reviewing key concepts such as instrument reading rules,
error types, and uncertainty calculations. This preparation will enhance their learning experience during the lab.
47.
Q&A: Clarify Doubts
InstrumentReading Queries
Invite students to ask questions about instrument reading.
Common questions may include how to handle zero - error
correction in a micrometer or how to estimate readings on a
particular instrument more accurately.
48.
Q&A: Clarify Doubts
ErrorType Confusions
Address confusions related to error types. For example, students may be unsure
whether a particular error is systematic or random, and this is an opportunity to
clarify such doubts.
Uncertainty Calculation Questions
Answer questions regarding uncertainty calculations, such as the difference
between relative and absolute uncertainty, or how to handle complex uncertainty
propagation scenarios.
9702/1/M/J/02
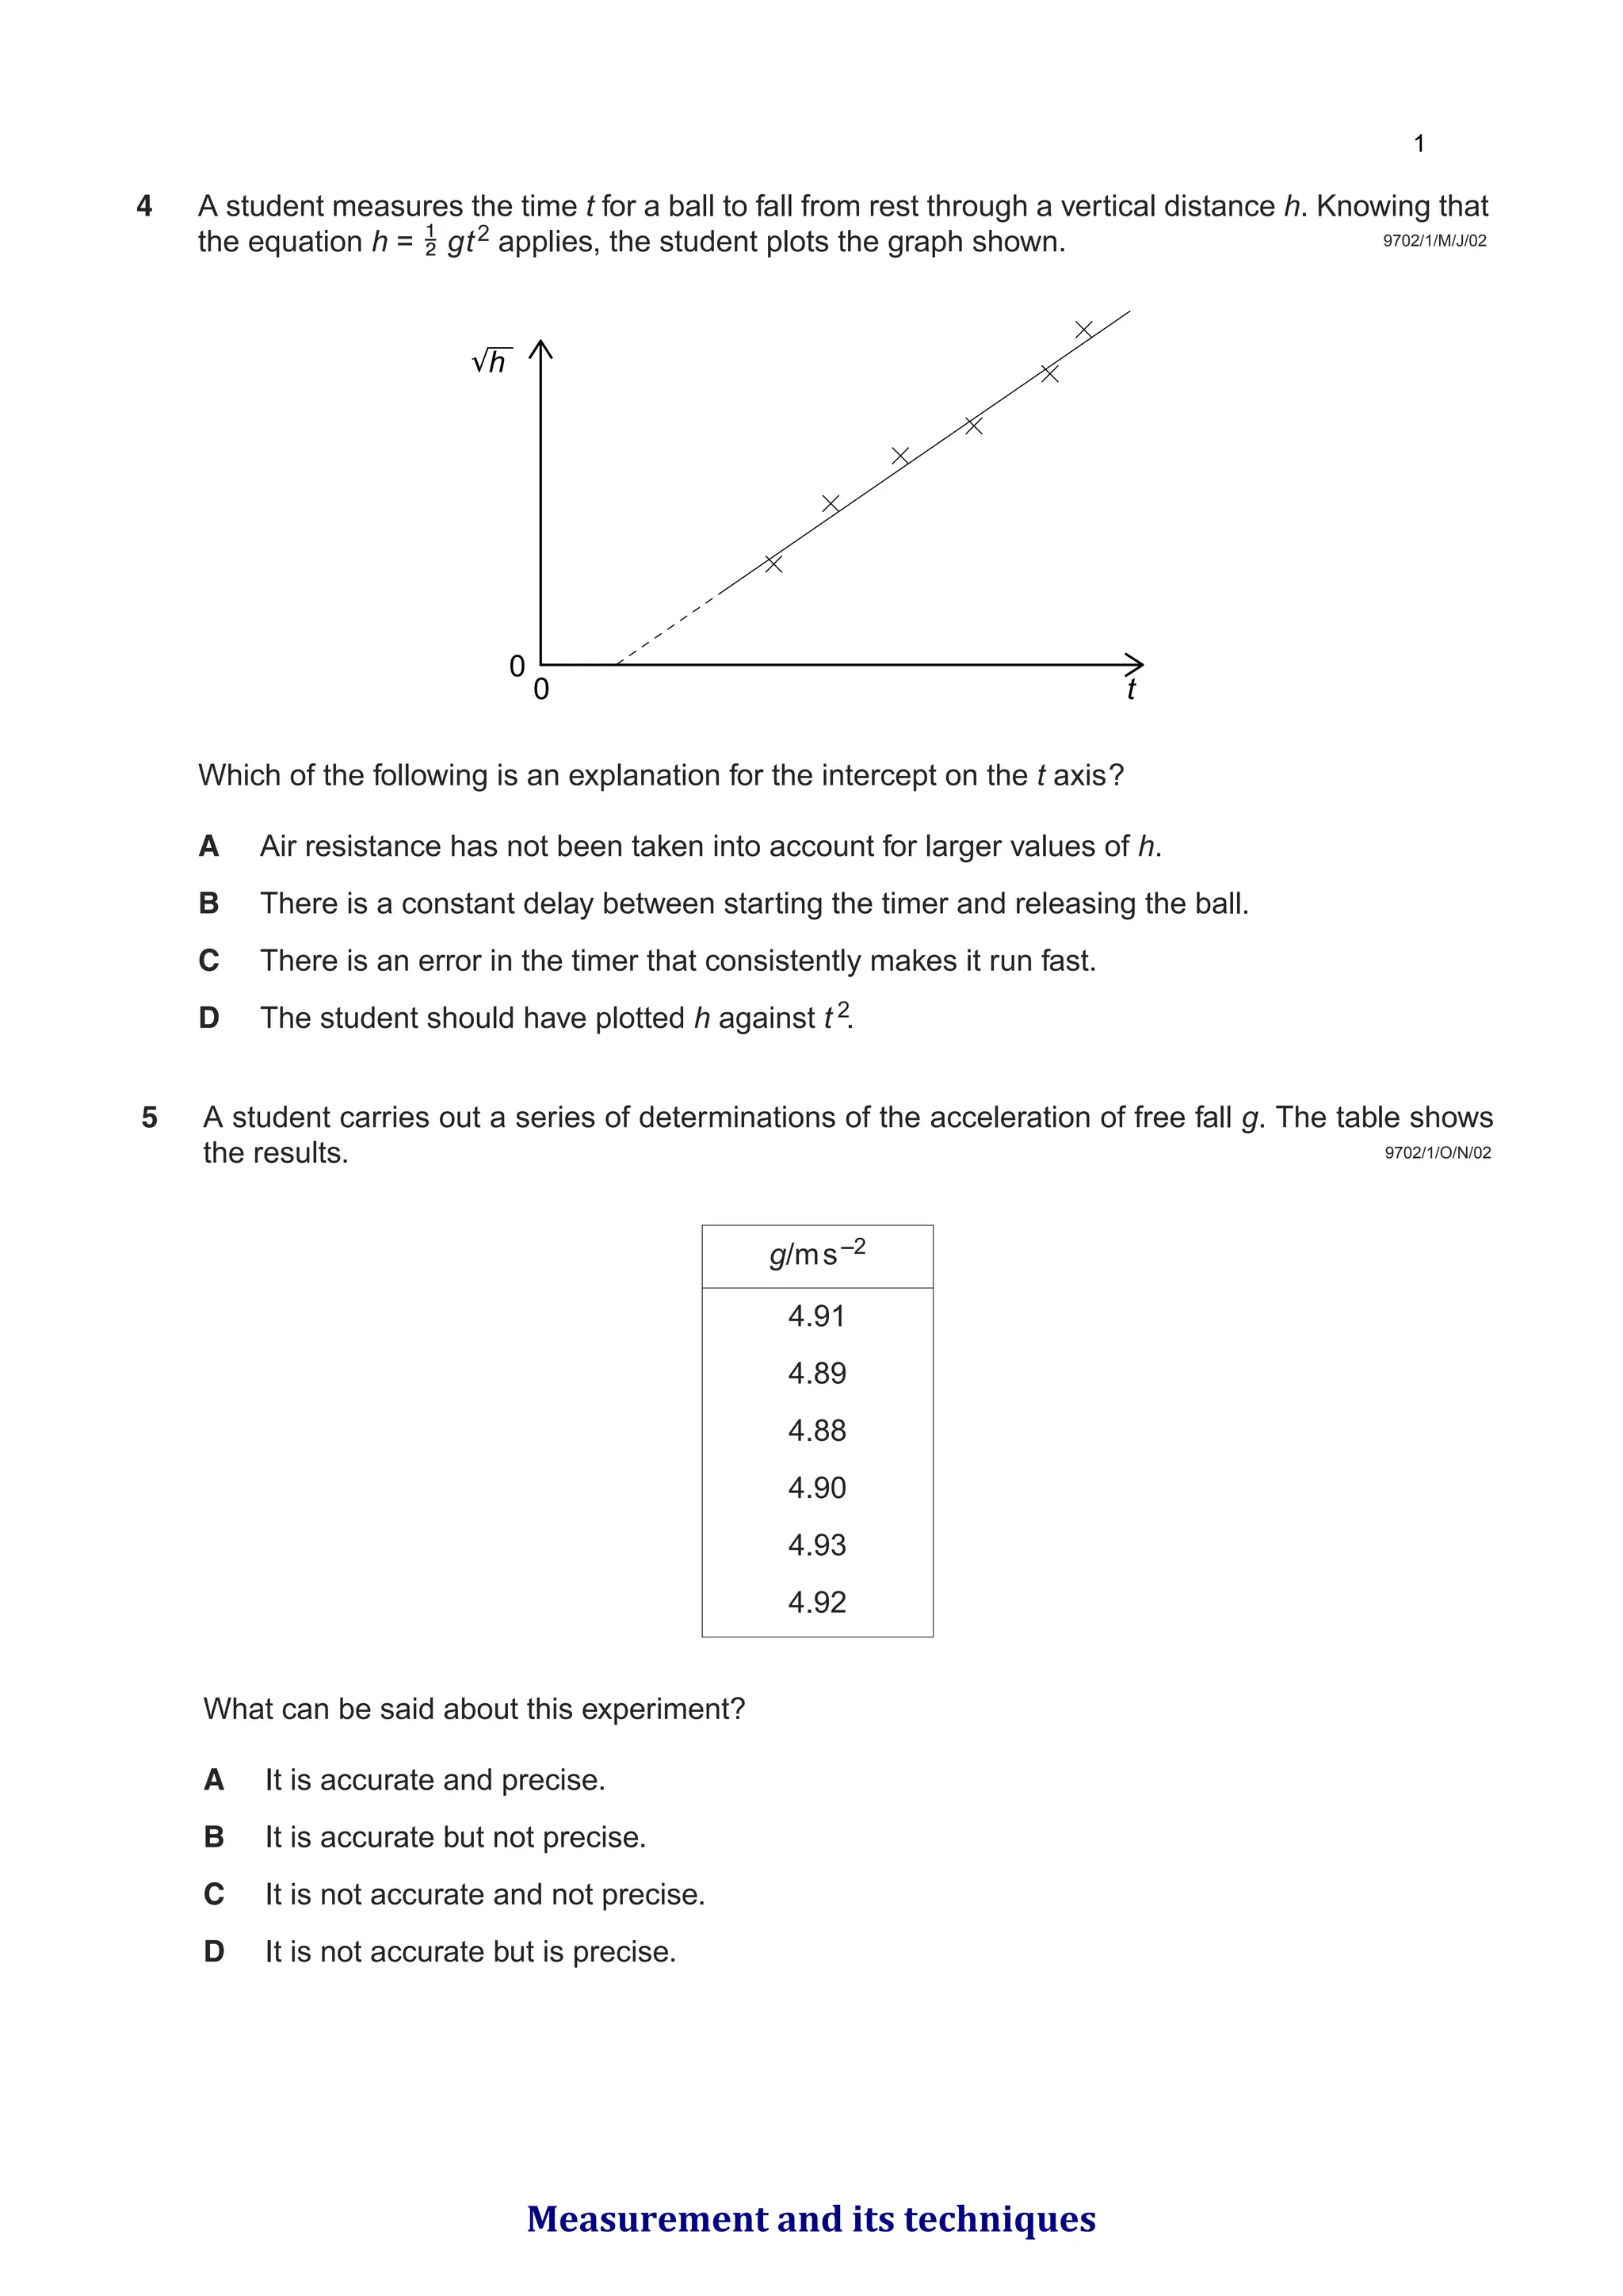
4 A studentmeasures the time t for a ball to fall from rest through a vertical distance h. Knowing that
the equation h = gt2 applies, the student plots the graph shown.
Which of the following is an explanation for the intercept on the t axis?
A Air resistance has not been taken into account for larger values of h.
B There is a constant delay between starting the timer and releasing the ball.
C There is an error in the timer that consistently makes it run fast.
D The student should have plotted h against t 2.
0 t
0
h
9702/1/O/N/02
5 A student carries out a series of determinations of the acceleration of free fall g. The table shows
the results.
What can be said about this experiment?
A It is accurate and precise.
B It is accurate but not precise.
C It is not accurate and not precise.
D It is not accurate but is precise.
g/ms–2
4.91
4.89
4.88
4.90
4.93
4.92
Measurement and its techniques
51.
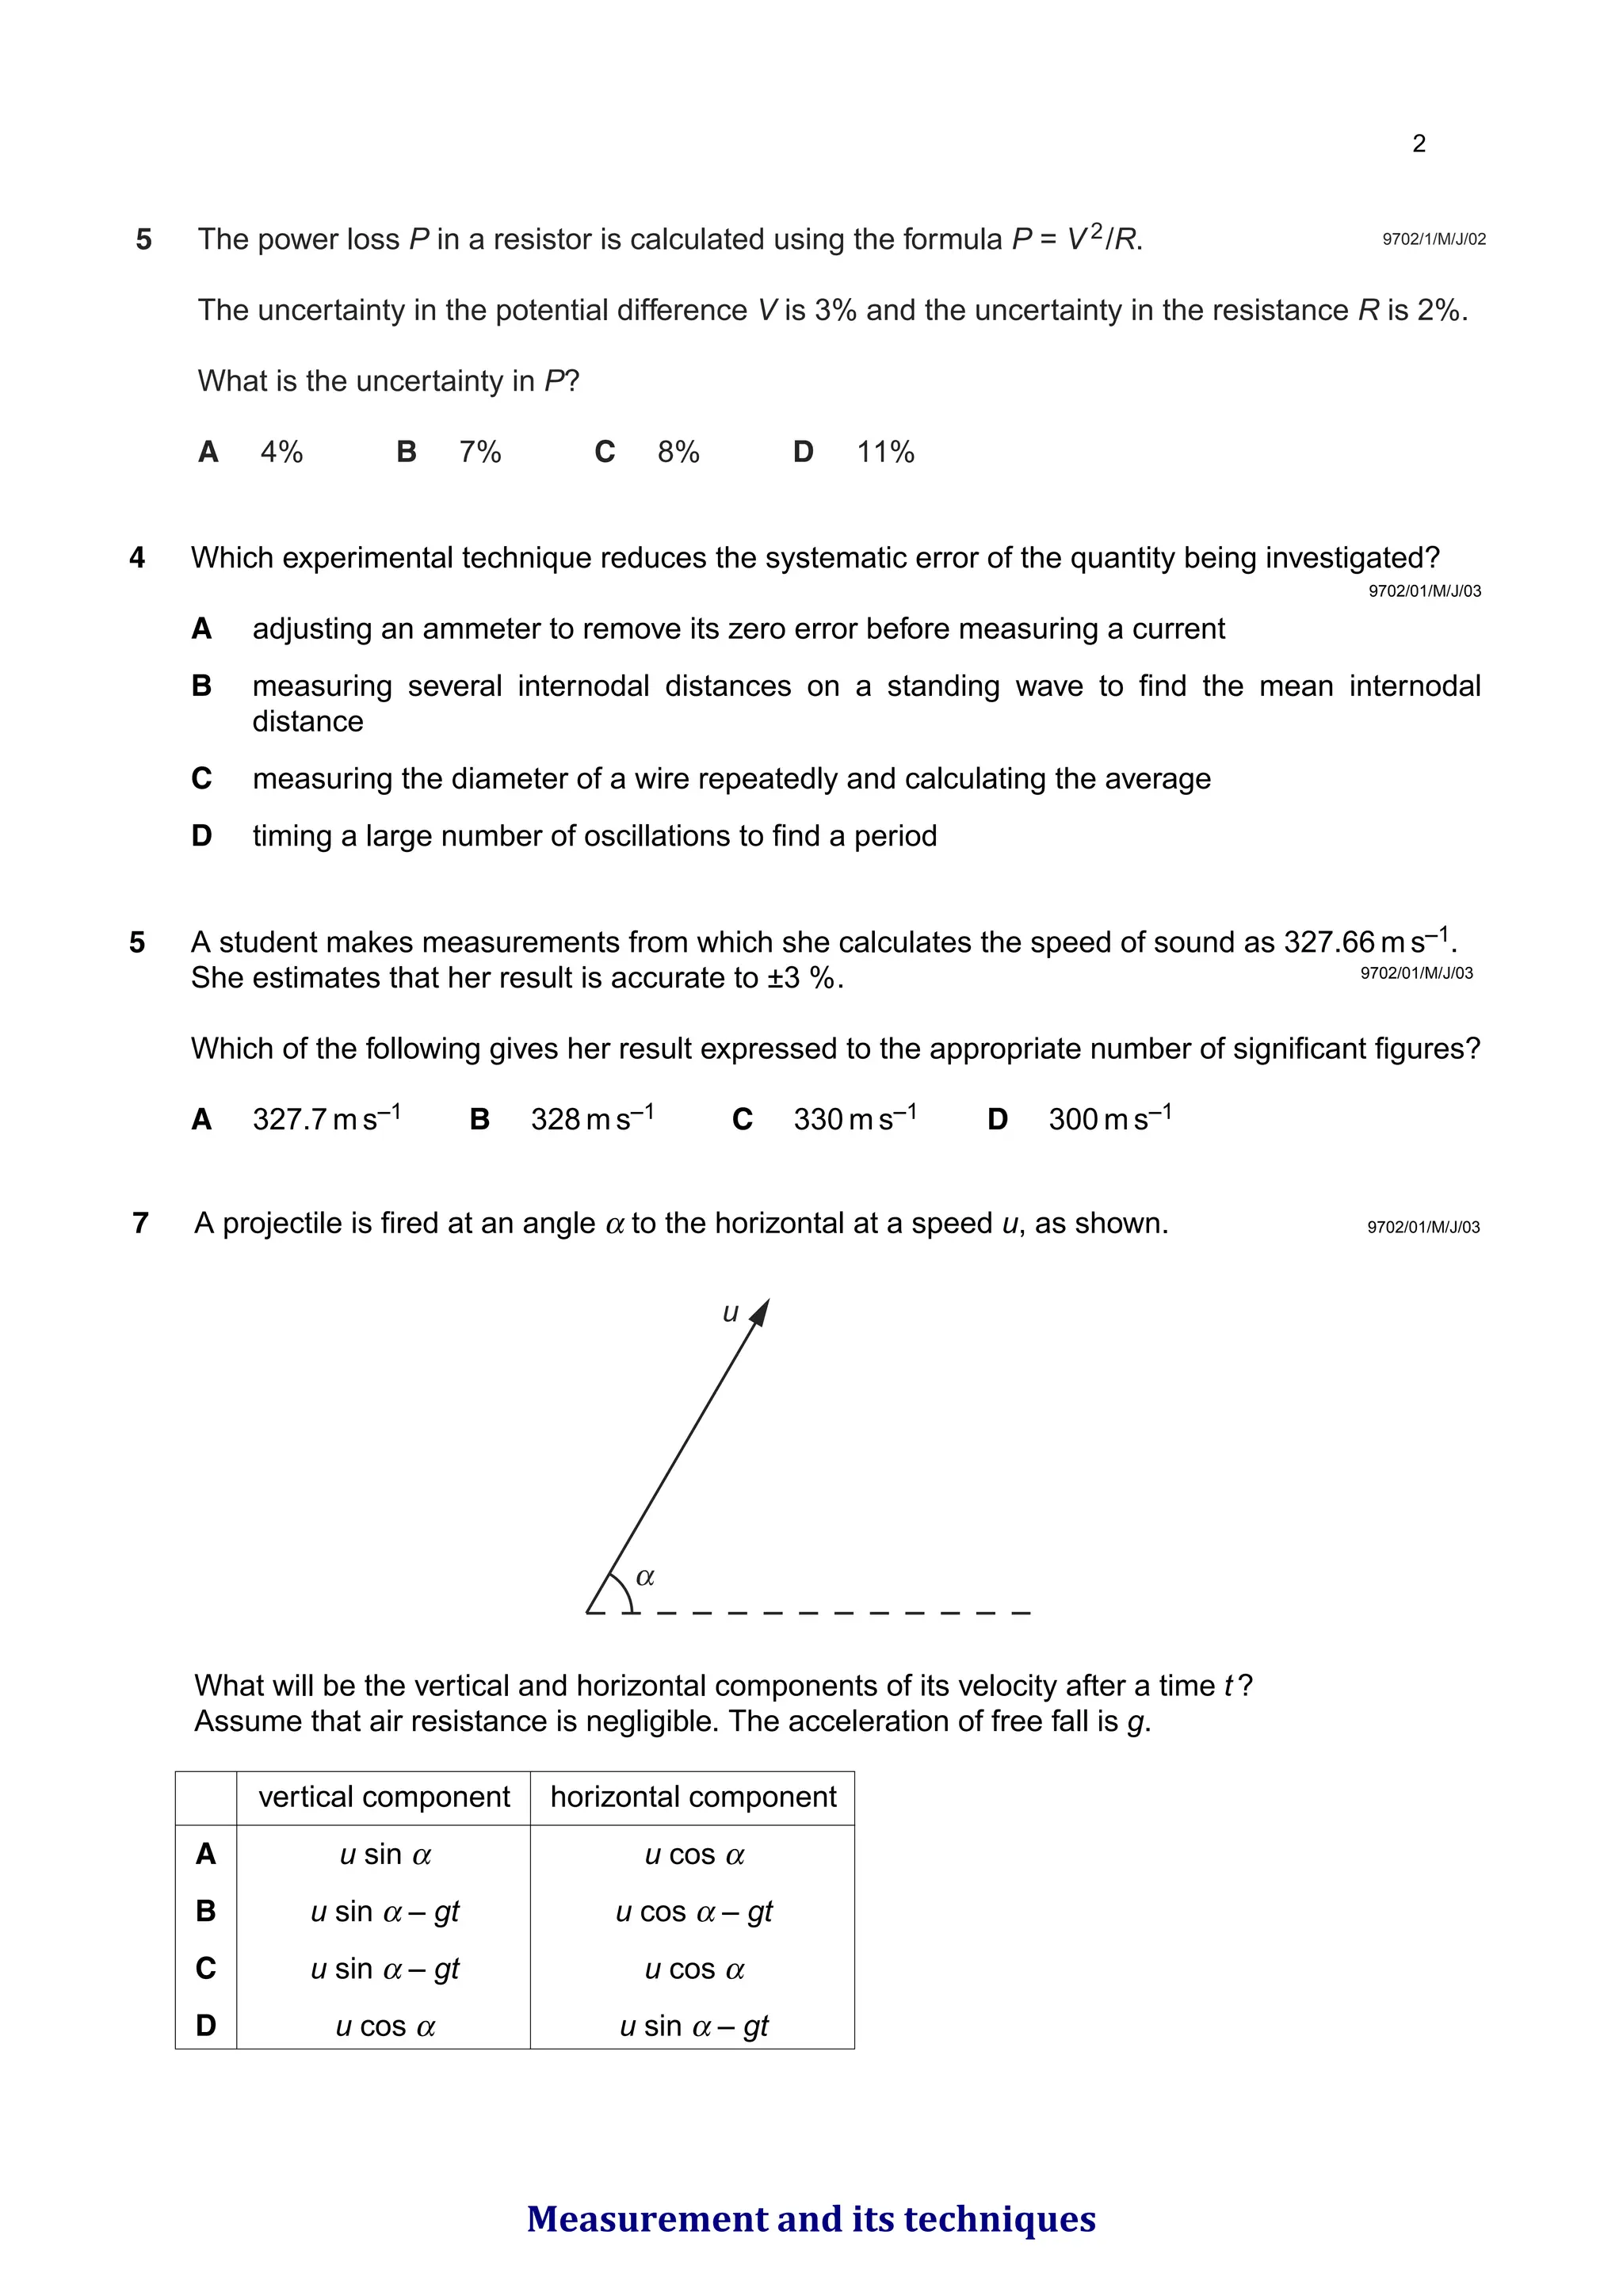
5 The powerloss P in a resistor is calculated using the formula P = V 2/R.
The uncertainty in the potential difference V is 3% and the uncertainty in the resistance R is 2%.
What is the uncertainty in P?
A 4% B 7% C 8% D 11%
9702/1/M/J/02
9702/01/M/J/03
4 Which experimental technique reduces the systematic error of the quantity being investigated?
A adjusting an ammeter to remove its zero error before measuring a current
B measuring several internodal distances on a standing wave to find the mean internodal
distance
C measuring the diameter of a wire repeatedly and calculating the average
D timing a large number of oscillations to find a period
5 A student makes measurements from which she calculates the speed of sound as 327.66 m s–1.
She estimates that her result is accurate to ±3 %.
Which of the following gives her result expressed to the appropriate number of significant figures?
A 327.7 m s–1 B 328 m s–1 C 330 m s–1 D 300 m s–1
9702/01/M/J/03
7 A projectile is fired at an angle α to the horizontal at a speed u, as shown.
What will be the vertical and horizontal components of its velocity after a time t ?
Assume that air resistance is negligible. The acceleration of free fall is g.
u
vertical component horizontal component
A u sin α u cos α
B u sin α – gt u cos α – gt
C u sin α – gt u cos α
D u cos α u sin α – gt
9702/01/M/J/03
Measurement and its techniques
52.
9702/1/O/N/02
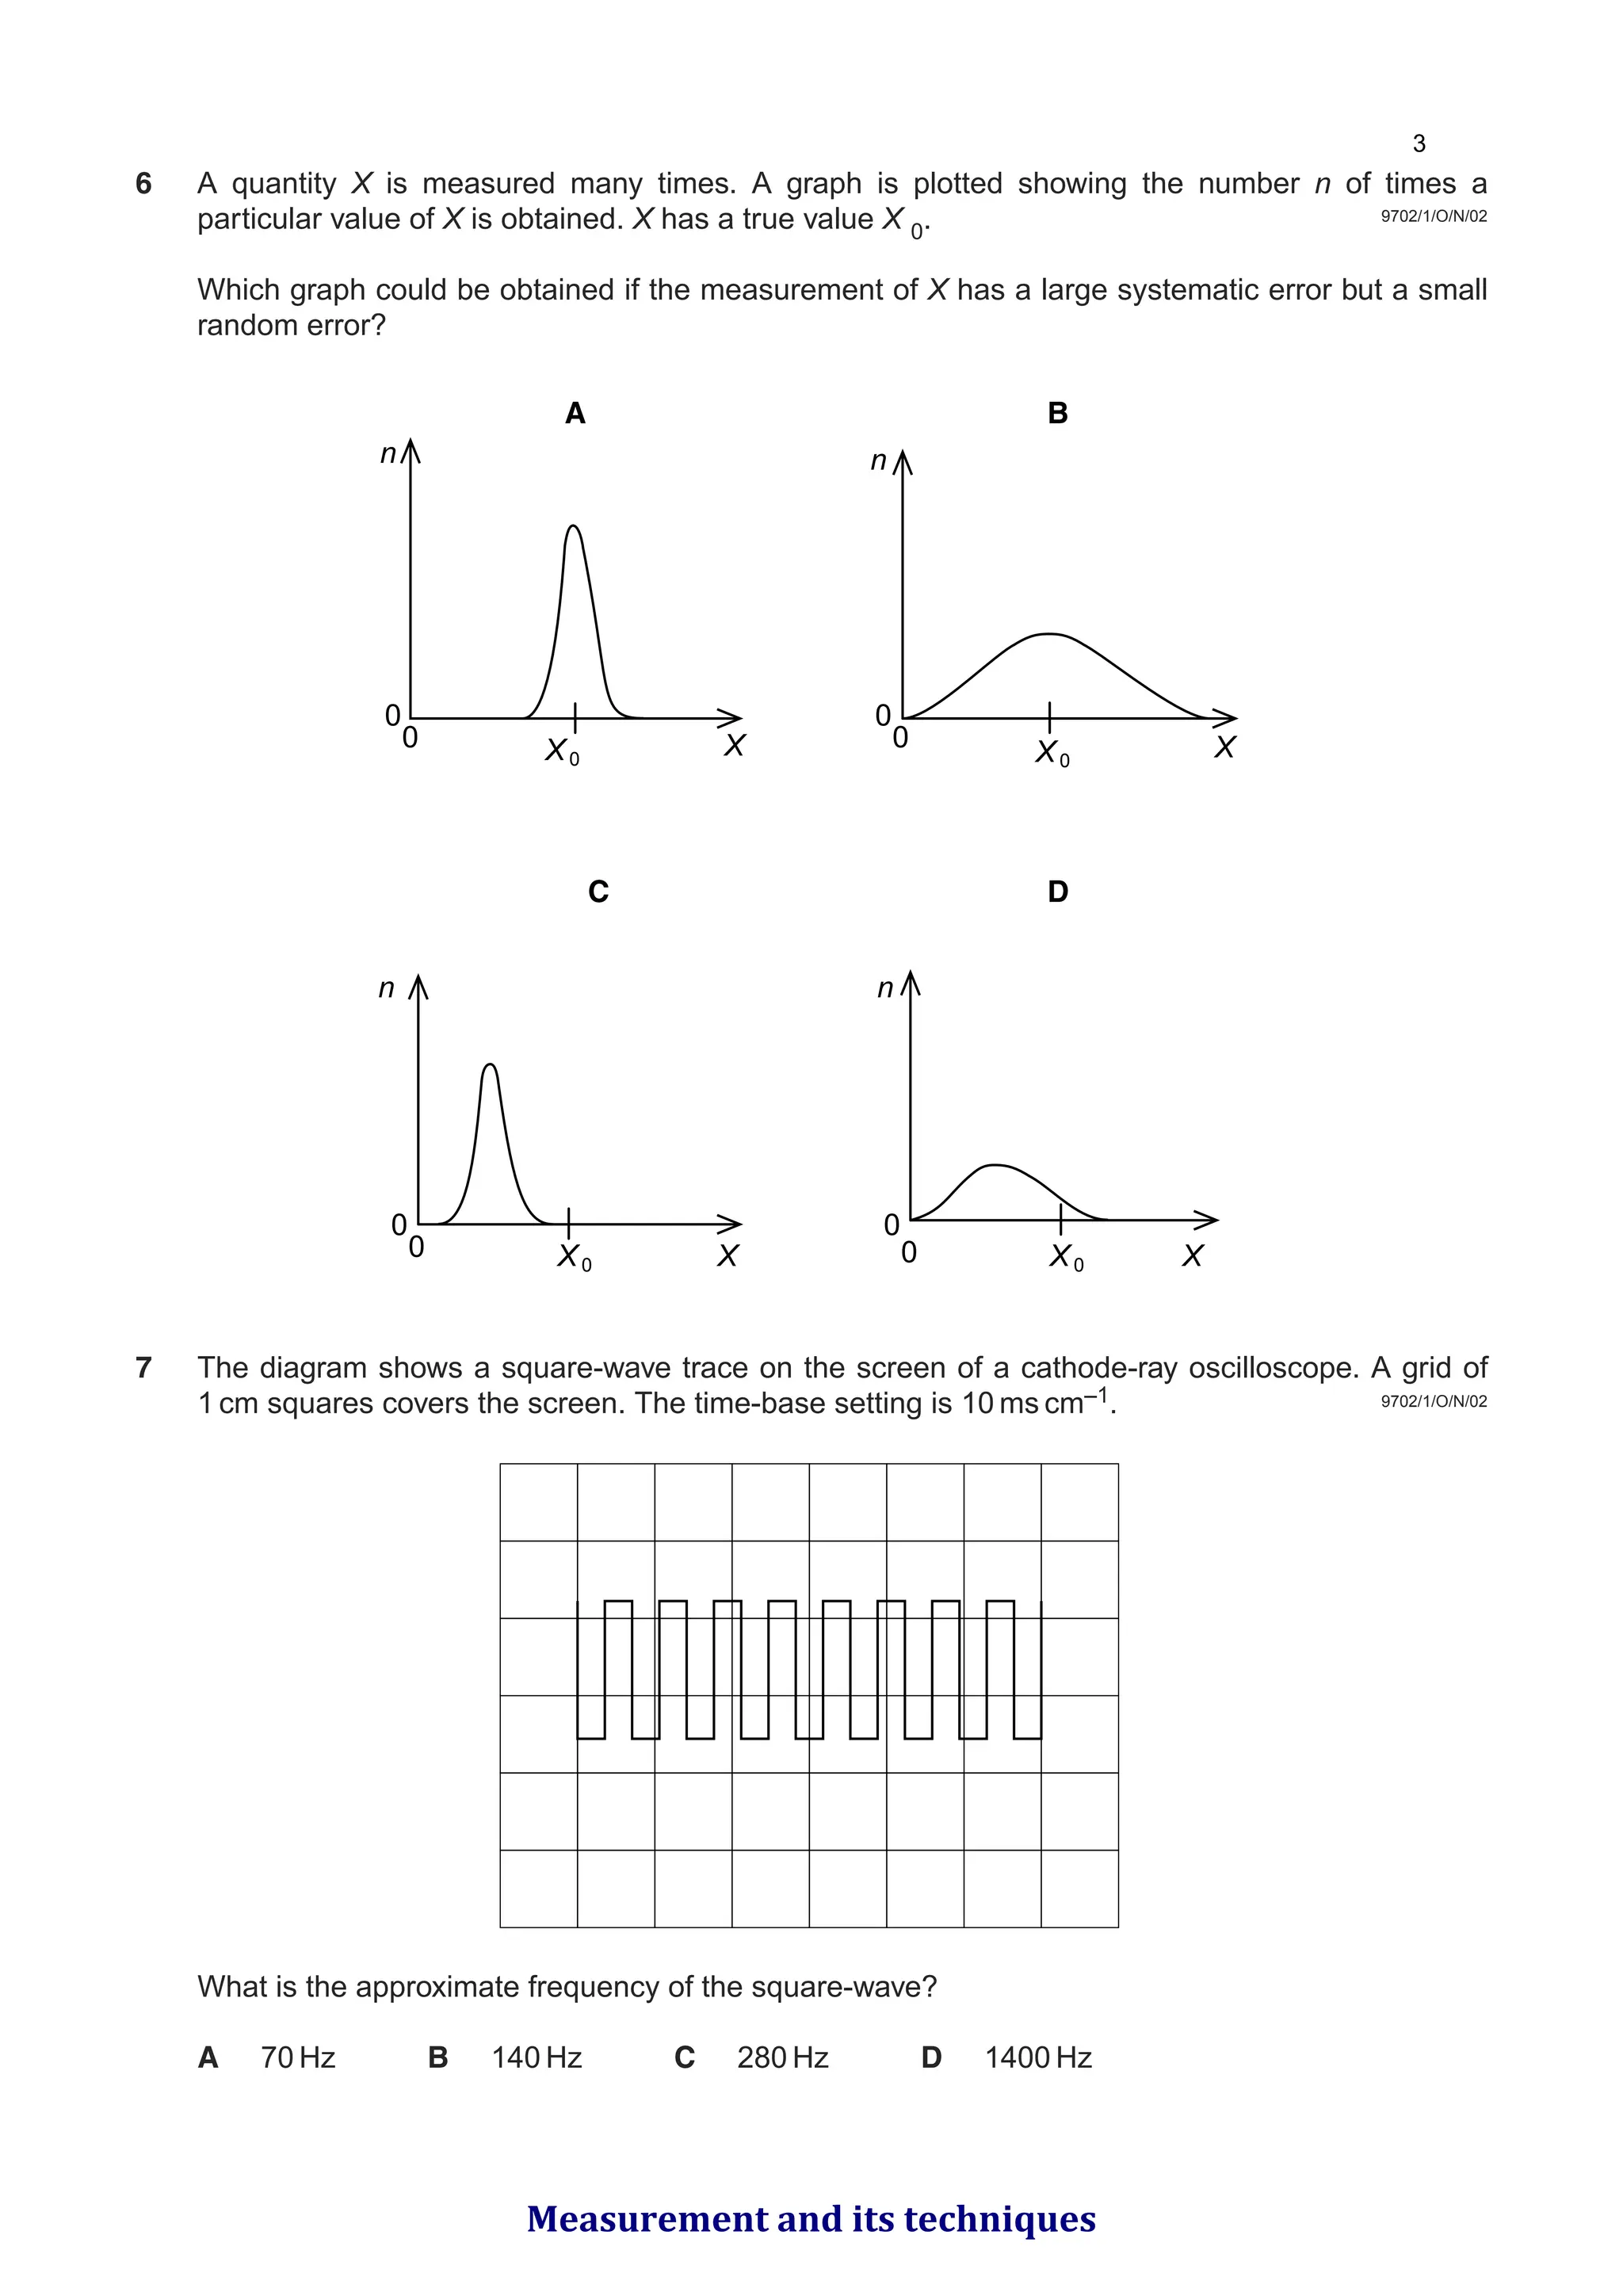
6 A quantityX is measured many times. A graph is plotted showing the number n of times a
particular value of X is obtained. X has a true value X 0.
Which graph could be obtained if the measurement of X has a large systematic error but a small
random error?
7 The diagram shows a square-wave trace on the screen of a cathode-ray oscilloscope. A grid of
1 cm squares covers the screen. The time-base setting is 10 ms cm–1.
What is the approximate frequency of the square-wave?
A 70 Hz B 140 Hz C 280 Hz D 1400 Hz
C D
B
A
n n
0 X0 X0
X X
0
0
0
n
X0
X
0
0
n
X0
X
0
0
9702/1/O/N/02
Measurement and its techniques
53.
9702/01/M/J/03
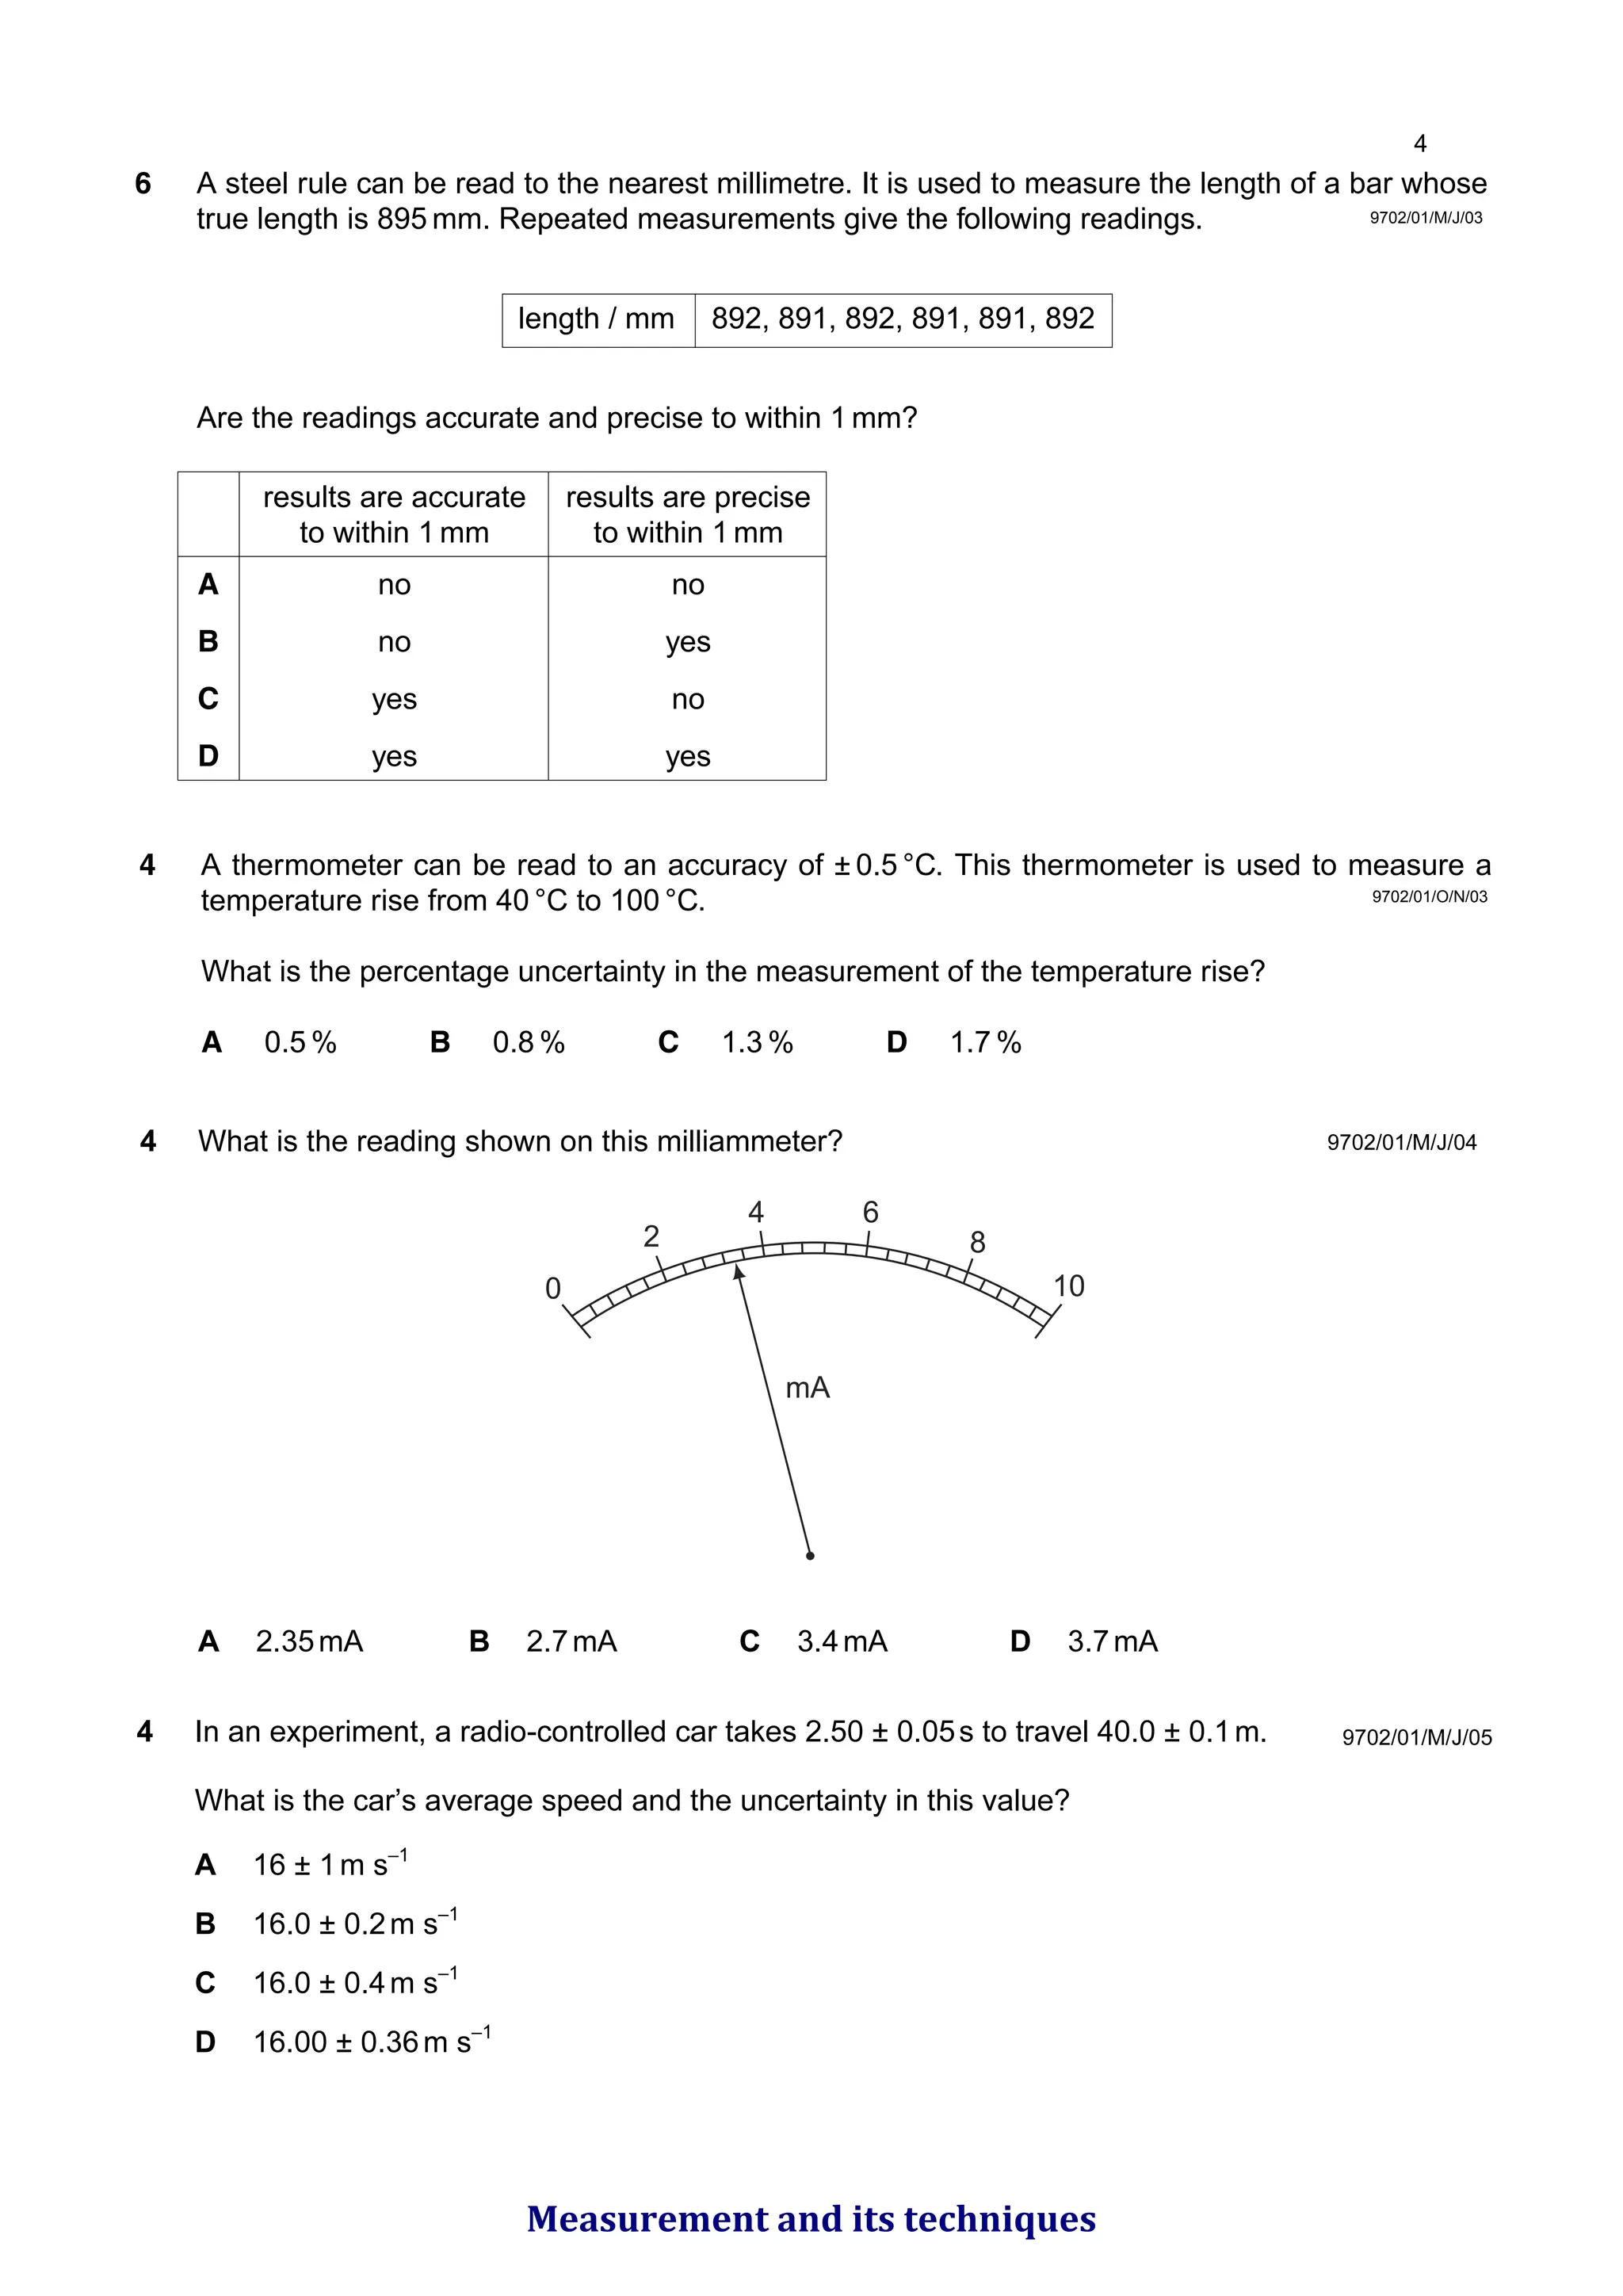
6 A steelrule can be read to the nearest millimetre. It is used to measure the length of a bar whose
true length is 895 mm. Repeated measurements give the following readings.
Are the readings accurate and precise to within 1 mm?
length / mm 892, 891, 892, 891, 891, 892
results are accurate results are precise
to within 1 mm to within 1 mm
A no no
B no yes
C yes no
D yes yes
9702/01/O/N/03
4 A thermometer can be read to an accuracy of ± 0.5 °C. This thermometer is used to measure a
temperature rise from 40 °C to 100 °C.
What is the percentage uncertainty in the measurement of the temperature rise?
A 0.5 % B 0.8 % C 1.3 % D 1.7 %
9702/01/M/J/04
4 What is the reading shown on this milliammeter?
0
2
4 6
8
10
mA
A 2.35mA B 2.7mA C 3.4mA D 3.7mA
9702/01/M/J/05
4 In an experiment, a radio-controlled car takes 2.50 ± 0.05s to travel 40.0 ± 0.1m.
What is the car’s average speed and the uncertainty in this value?
A 16 ± 1m s–1
B 16.0 ± 0.2m s–1
C 16.0 ± 0.4m s–1
D 16.00 ± 0.36m s–1
Measurement and its techniques
54.
9702/01/O/N/03
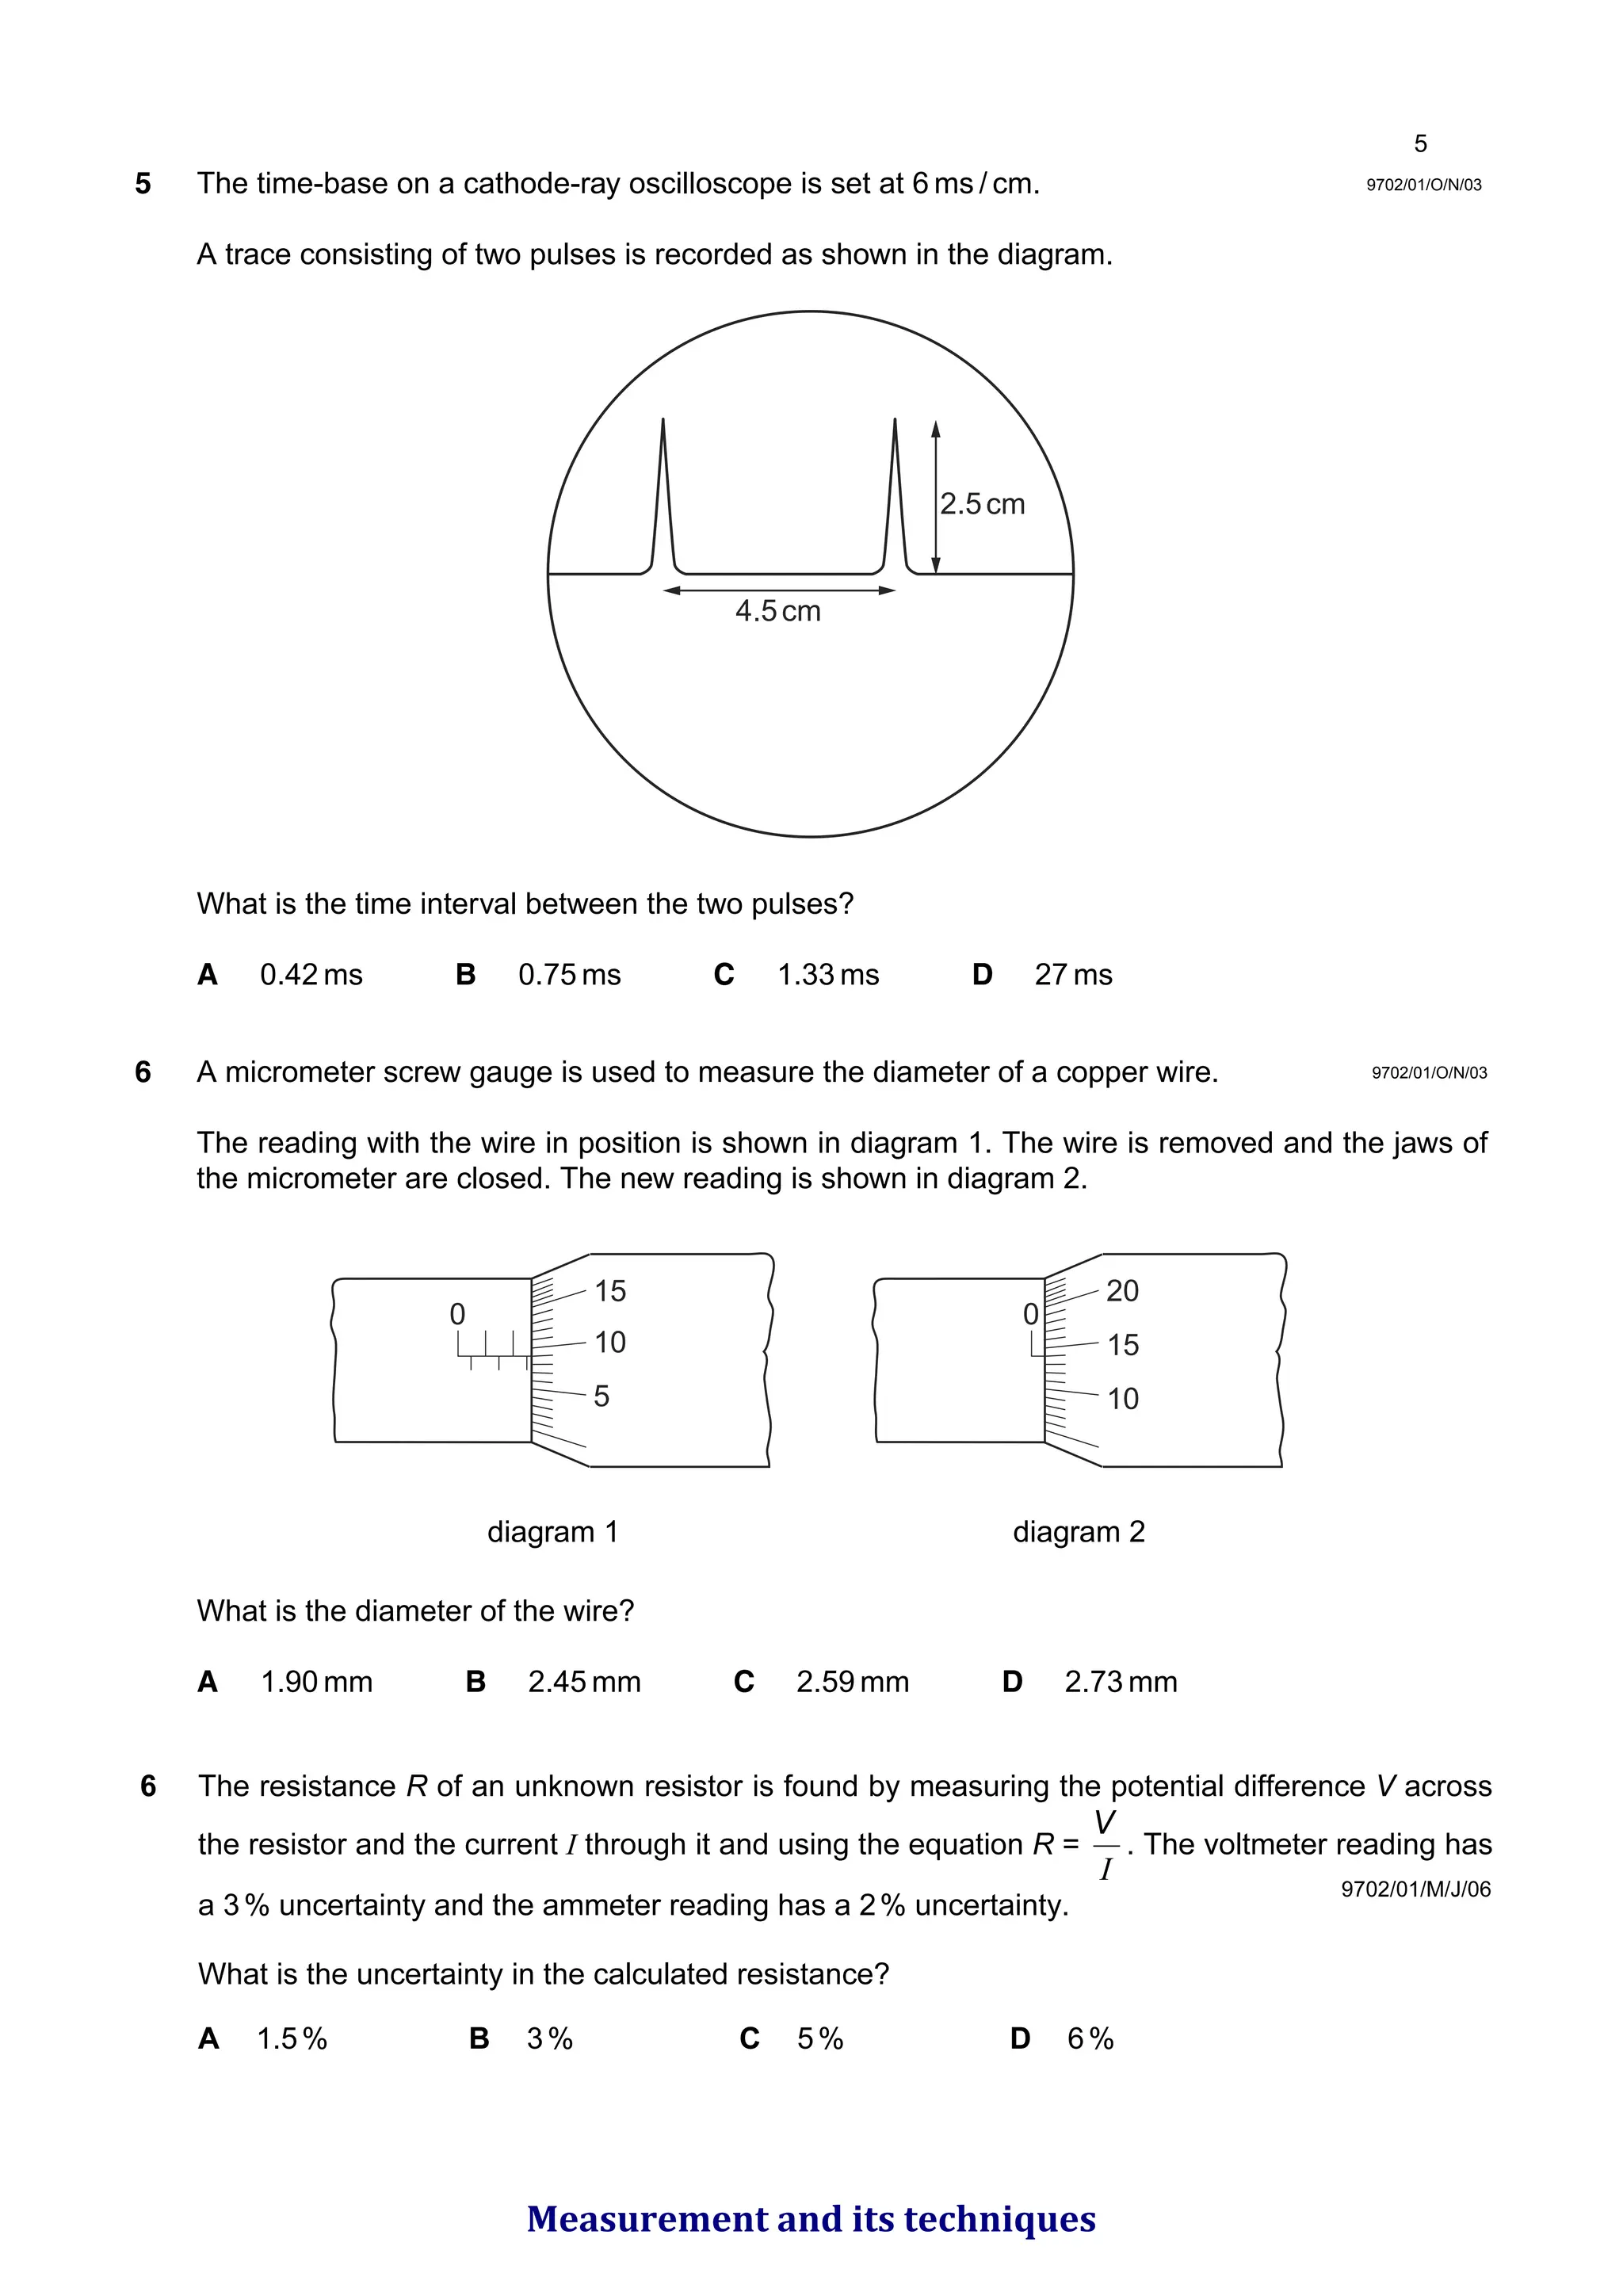
5 The time-baseon a cathode-ray oscilloscope is set at 6 ms / cm.
A trace consisting of two pulses is recorded as shown in the diagram.
What is the time interval between the two pulses?
A 0.42 ms B 0.75 ms C 1.33 ms D 27 ms
6 A micrometer screw gauge is used to measure the diameter of a copper wire.
The reading with the wire in position is shown in diagram 1. The wire is removed and the jaws of
the micrometer are closed. The new reading is shown in diagram 2.
diagram 1 diagram 2
What is the diameter of the wire?
A 1.90 mm B 2.45 mm C 2.59 mm D 2.73 mm
0
10
5
0
15
15 20
10
2.5cm
4.5cm
9702/01/O/N/03
9702/01/M/J/06
6 The resistance R of an unknown resistor is found by measuring the potential difference V across
the resistor and the current I through it and using the equation R =
I
V
. The voltmeter reading has
a 3% uncertainty and the ammeter reading has a 2% uncertainty.
What is the uncertainty in the calculated resistance?
A 1.5% B 3% C 5% D 6%
Measurement and its techniques
55.
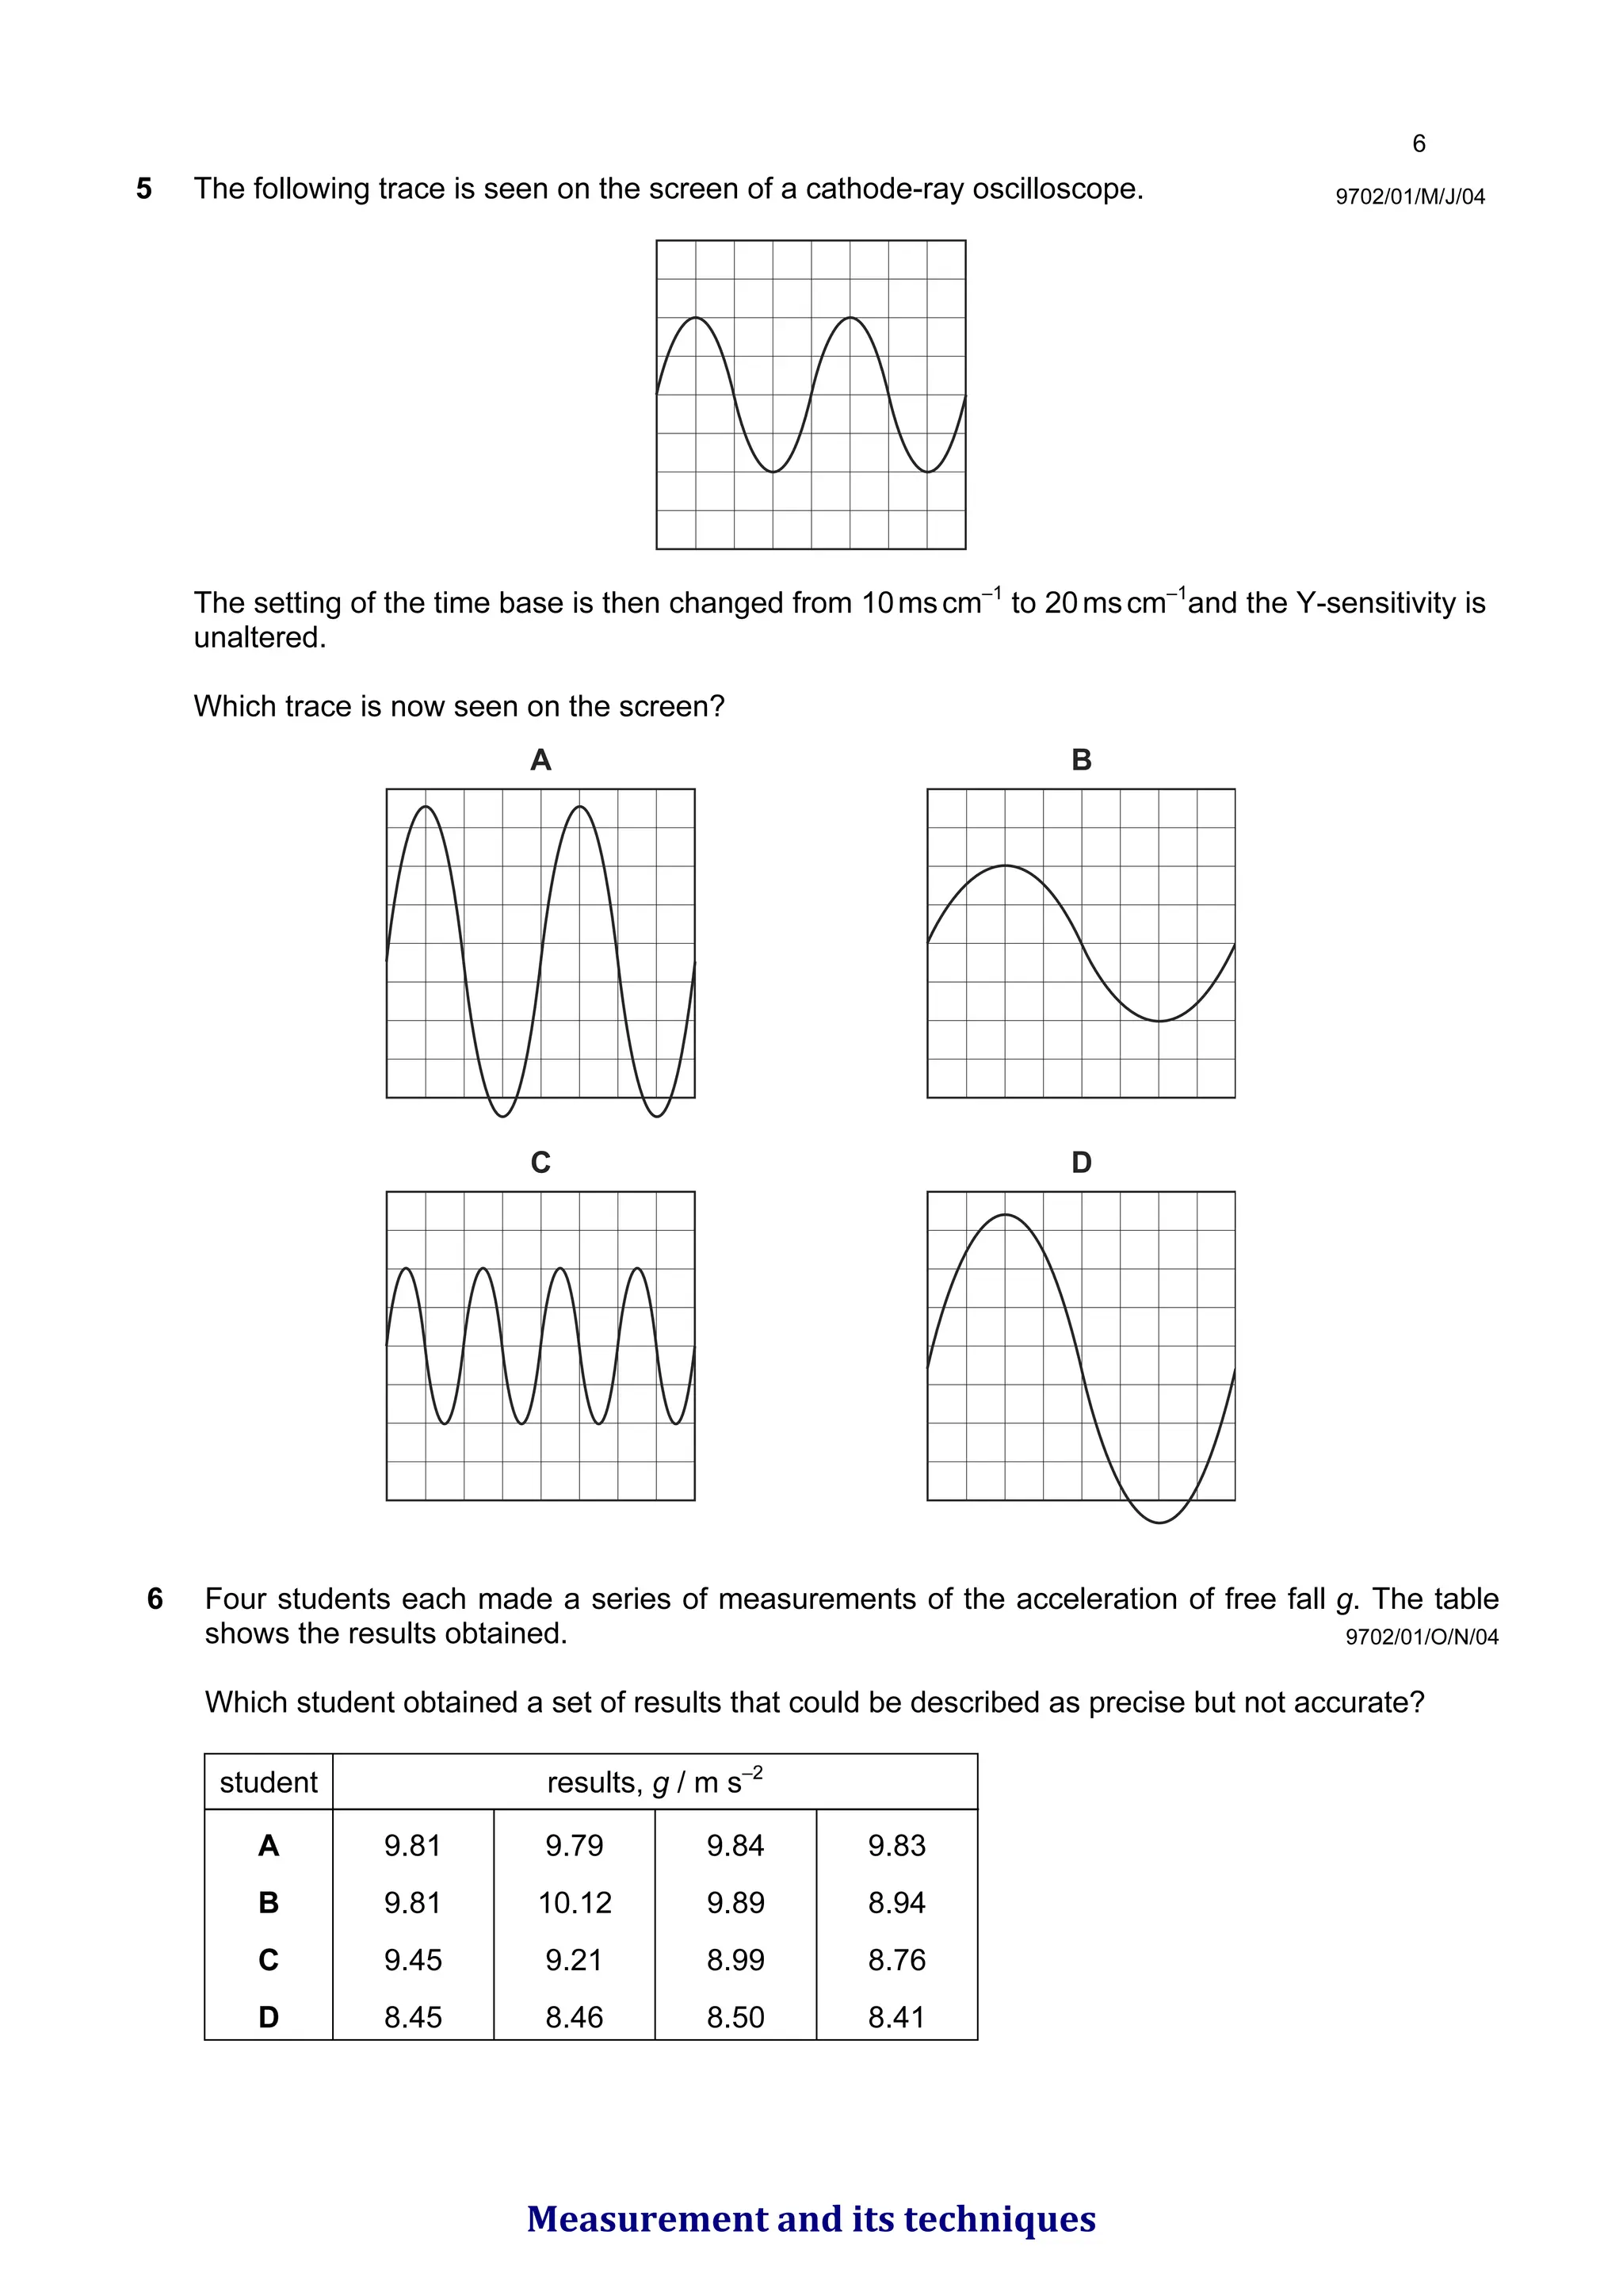
5 The followingtrace is seen on the screen of a cathode-ray oscilloscope.
The setting of the time base is then changed from 10mscm–1
to 20mscm–1
and the Y-sensitivity is
unaltered.
Which trace is now seen on the screen?
A B
C D
9702/01/M/J/04
9702/01/O/N/04
6 Four students each made a series of measurements of the acceleration of free fall g. The table
shows the results obtained.
Which student obtained a set of results that could be described as precise but not accurate?
student results, g / m s–2
A 9.81 9.79 9.84 9.83
B 9.81 10.12 9.89 8.94
C 9.45 9.21 8.99 8.76
D 8.45 8.46 8.50 8.41
Measurement and its techniques
56.
9702/01/O/N/04
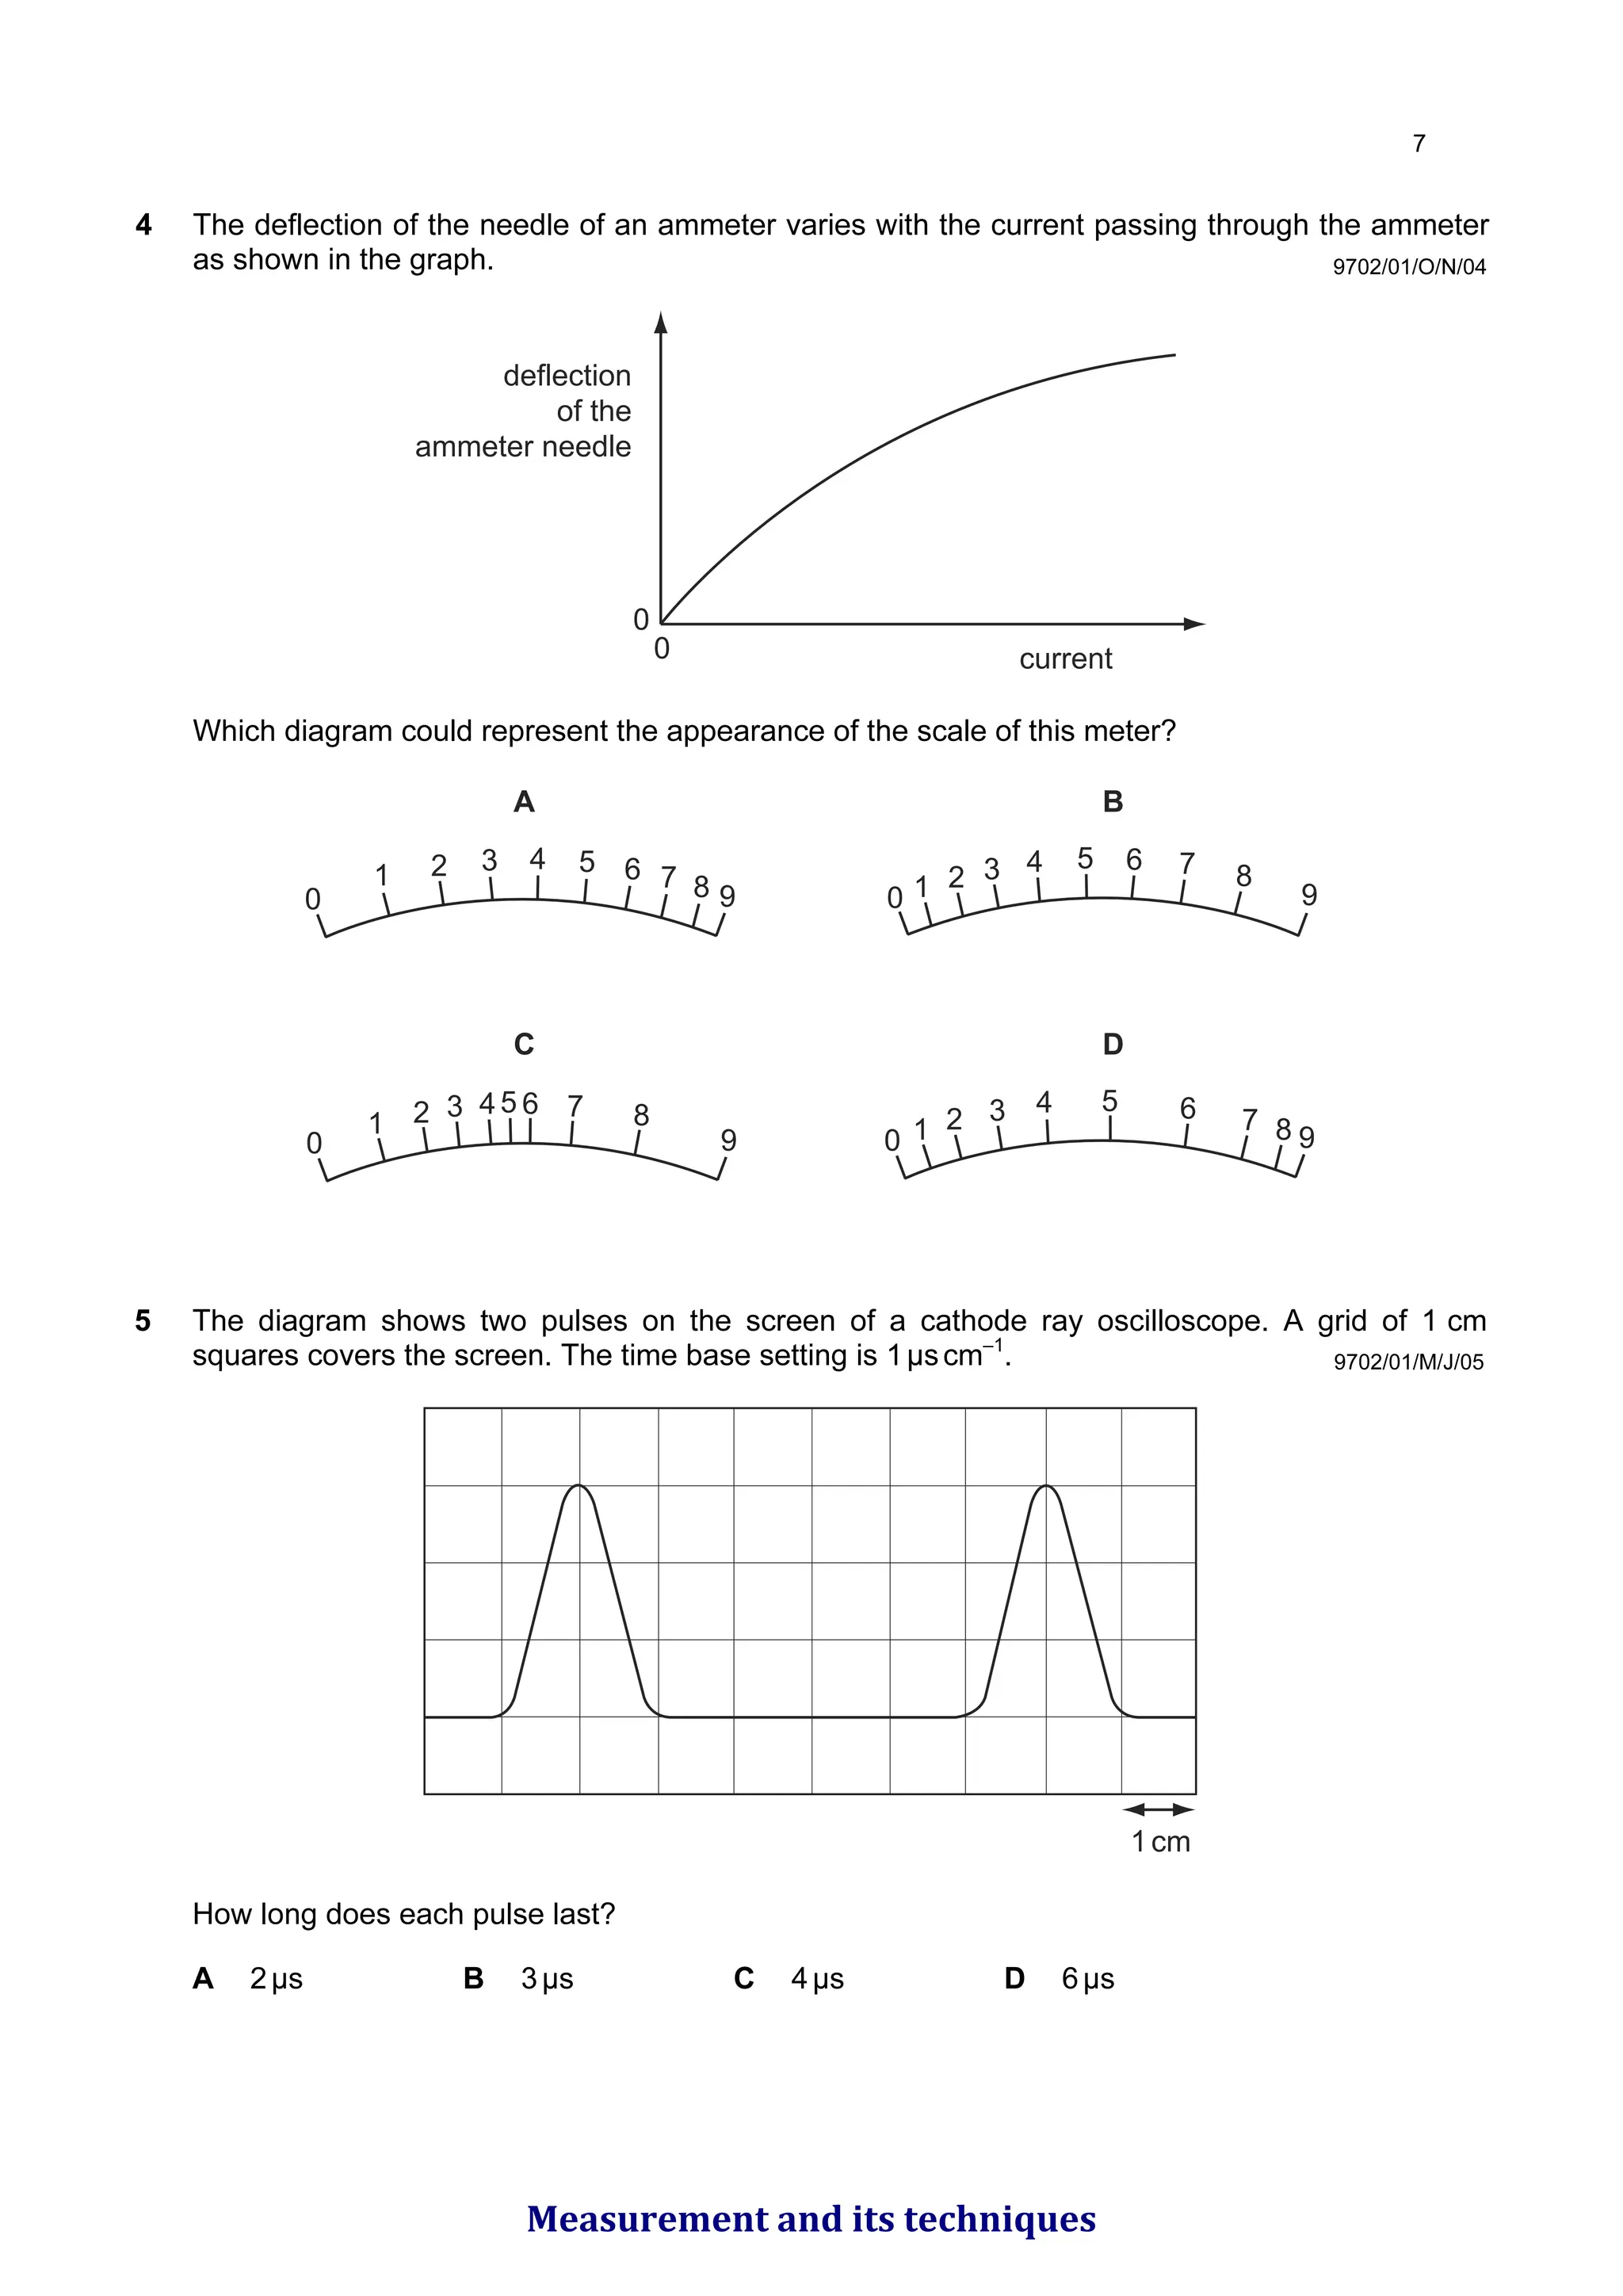
4 The deflectionof the needle of an ammeter varies with the current passing through the ammeter
as shown in the graph.
deflection
of the
ammeter needle
0
0 current
Which diagram could represent the appearance of the scale of this meter?
A B
C D
0
1 2 3 4 5 6 7 8 9 0 1 2 3 4 5 6 7 8
9
0
1 2 3 45 6 7 8
9 0 1 2 3 4 5 6 7 8 9
9702/01/M/J/05
5 The diagram shows two pulses on the screen of a cathode ray oscilloscope. A grid of 1 cm
squares covers the screen. The time base setting is 1µscm–1
.
1cm
How long does each pulse last?
A 2µs B 3µs C 4µs D 6µs
Measurement and its techniques
57.
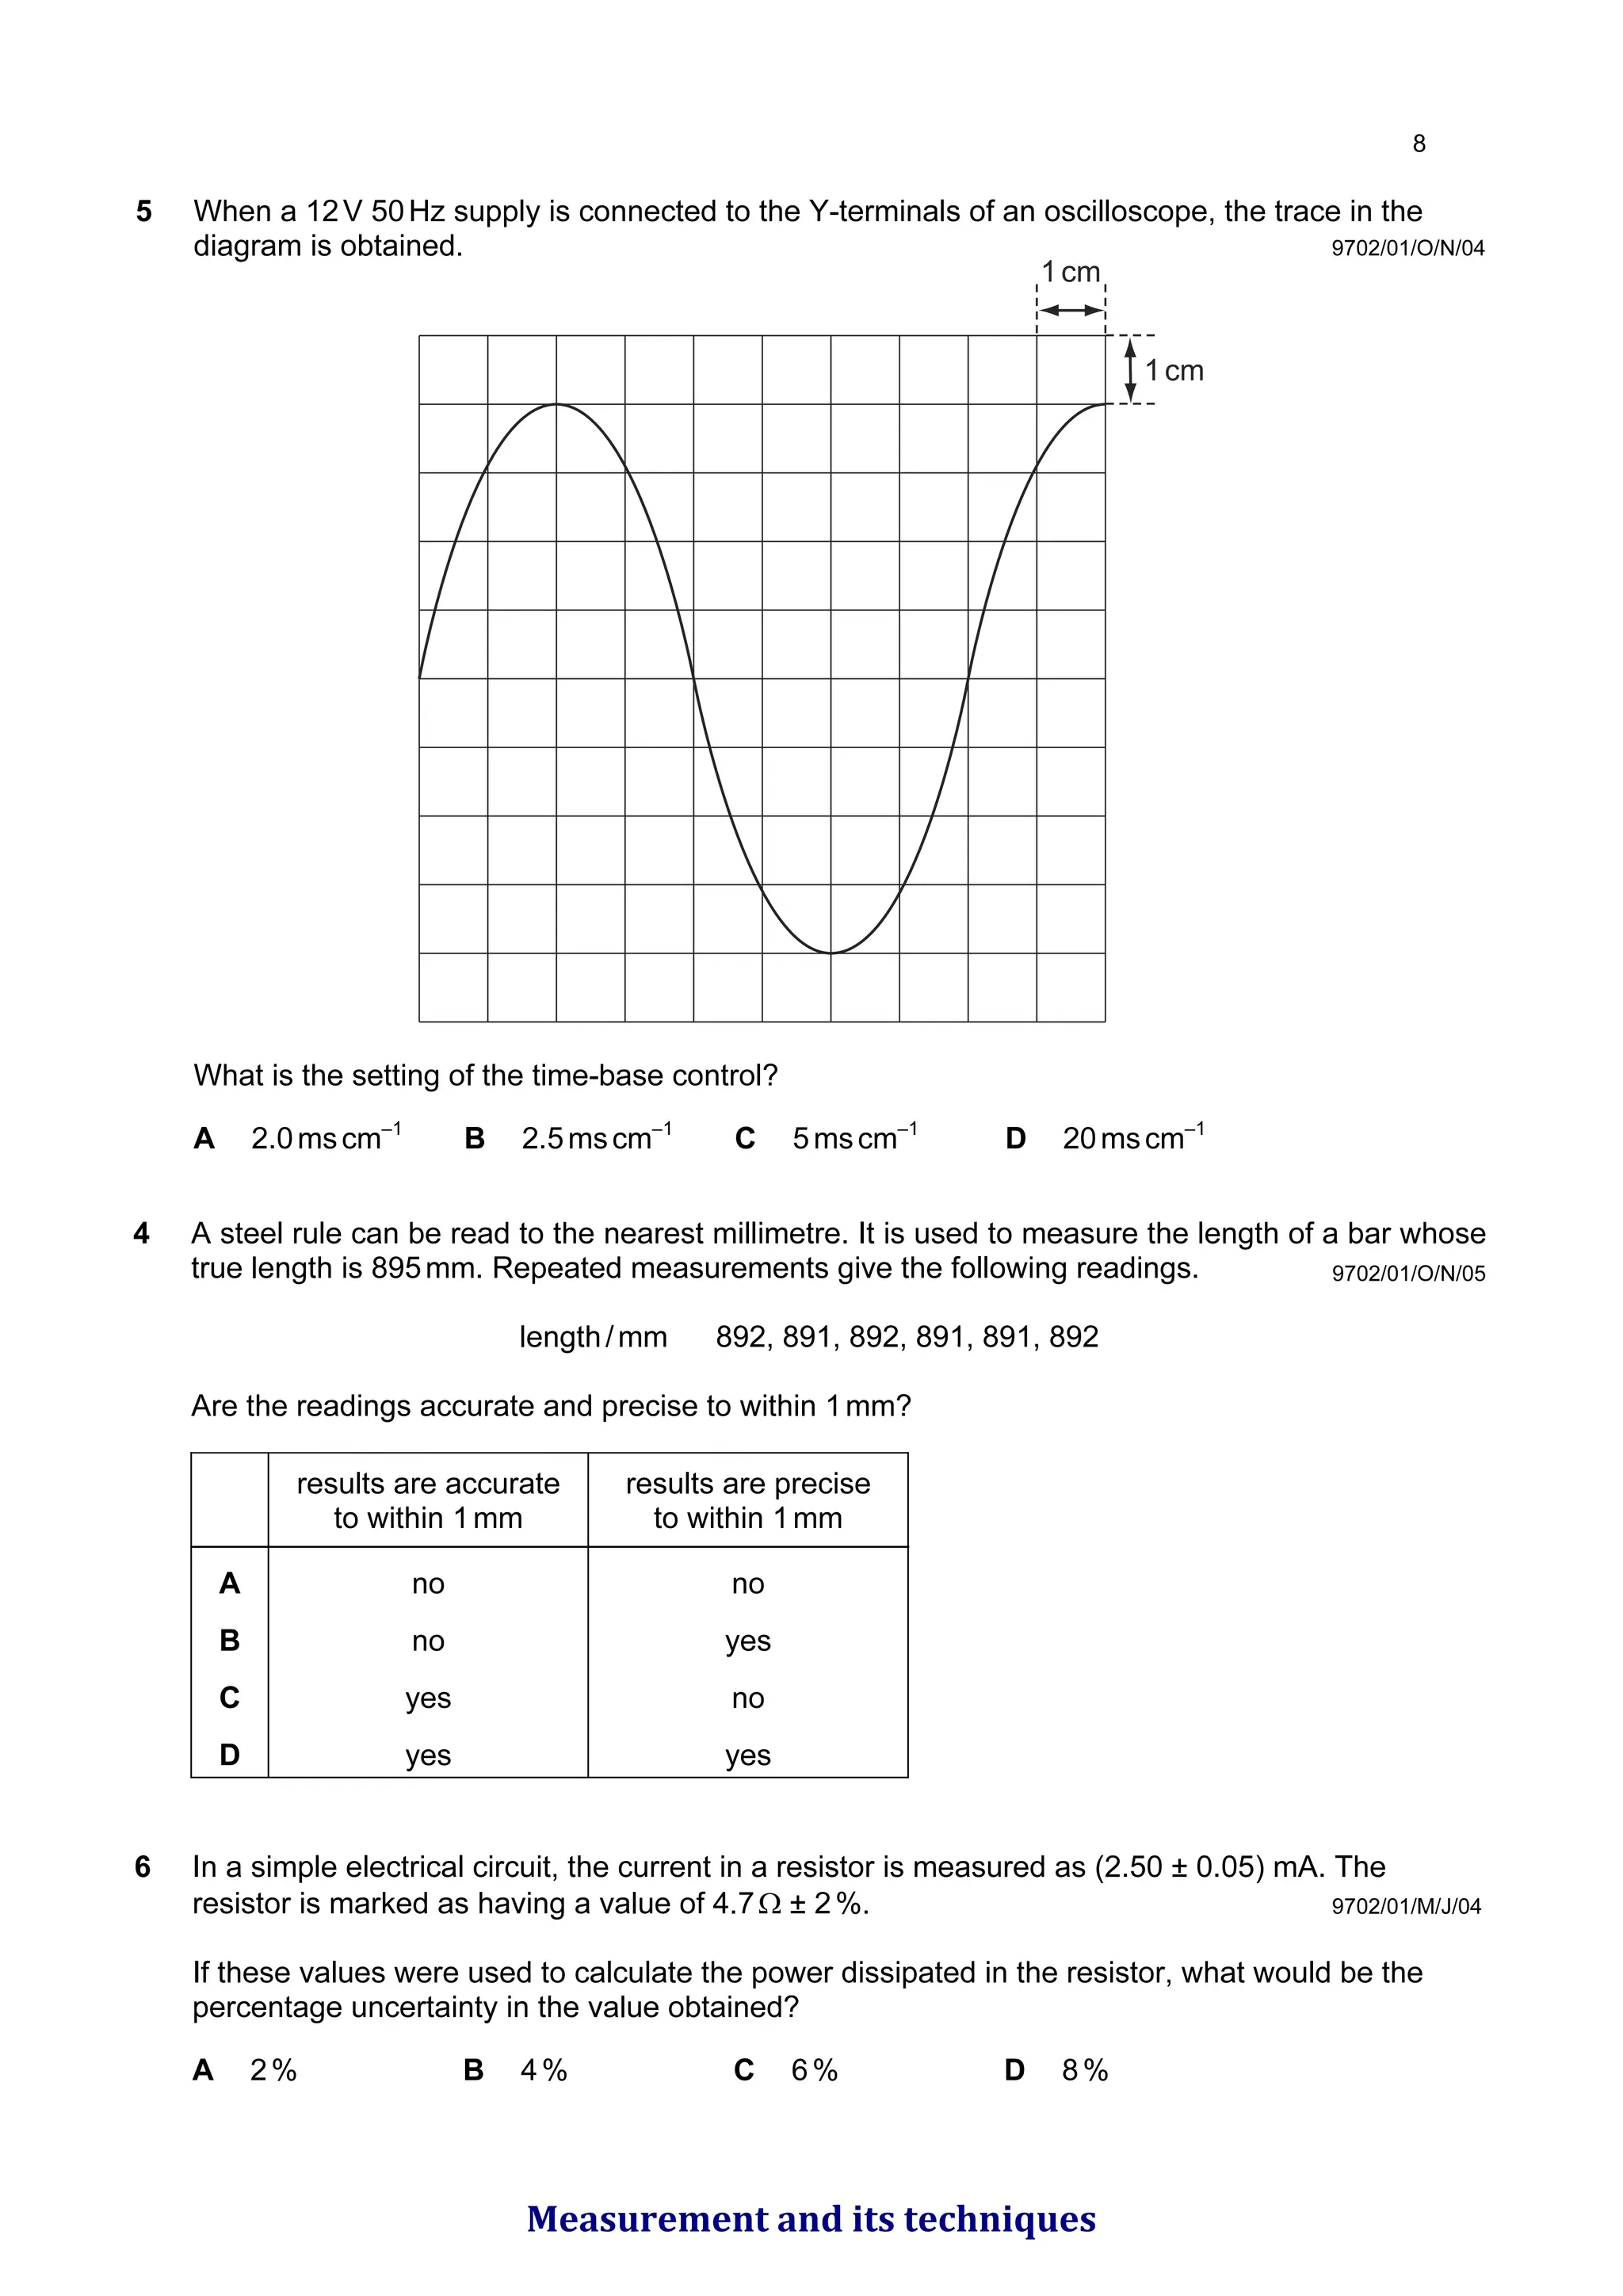
5 When a12V 50Hz supply is connected to the Y-terminals of an oscilloscope, the trace in the
diagram is obtained.
1cm
1cm
What is the setting of the time-base control?
A 2.0mscm–1
B 2.5mscm–1
C 5mscm–1
D 20mscm–1
9702/01/O/N/04
9702/01/O/N/05
4 A steel rule can be read to the nearest millimetre. It is used to measure the length of a bar whose
true length is 895mm. Repeated measurements give the following readings.
length/mm 892, 891, 892, 891, 891, 892
Are the readings accurate and precise to within 1mm?
results are accurate
to within 1mm
results are precise
to within 1mm
A no no
B no yes
C yes no
D yes yes
9702/01/M/J/04
6 In a simple electrical circuit, the current in a resistor is measured as (2.50 ± 0.05) mA. The
resistor is marked as having a value of 4.7Ω ± 2%.
If these values were used to calculate the power dissipated in the resistor, what would be the
percentage uncertainty in the value obtained?
A 2% B 4% C 6% D 8%
Measurement and its techniques
58.
9702/01/O/N/05
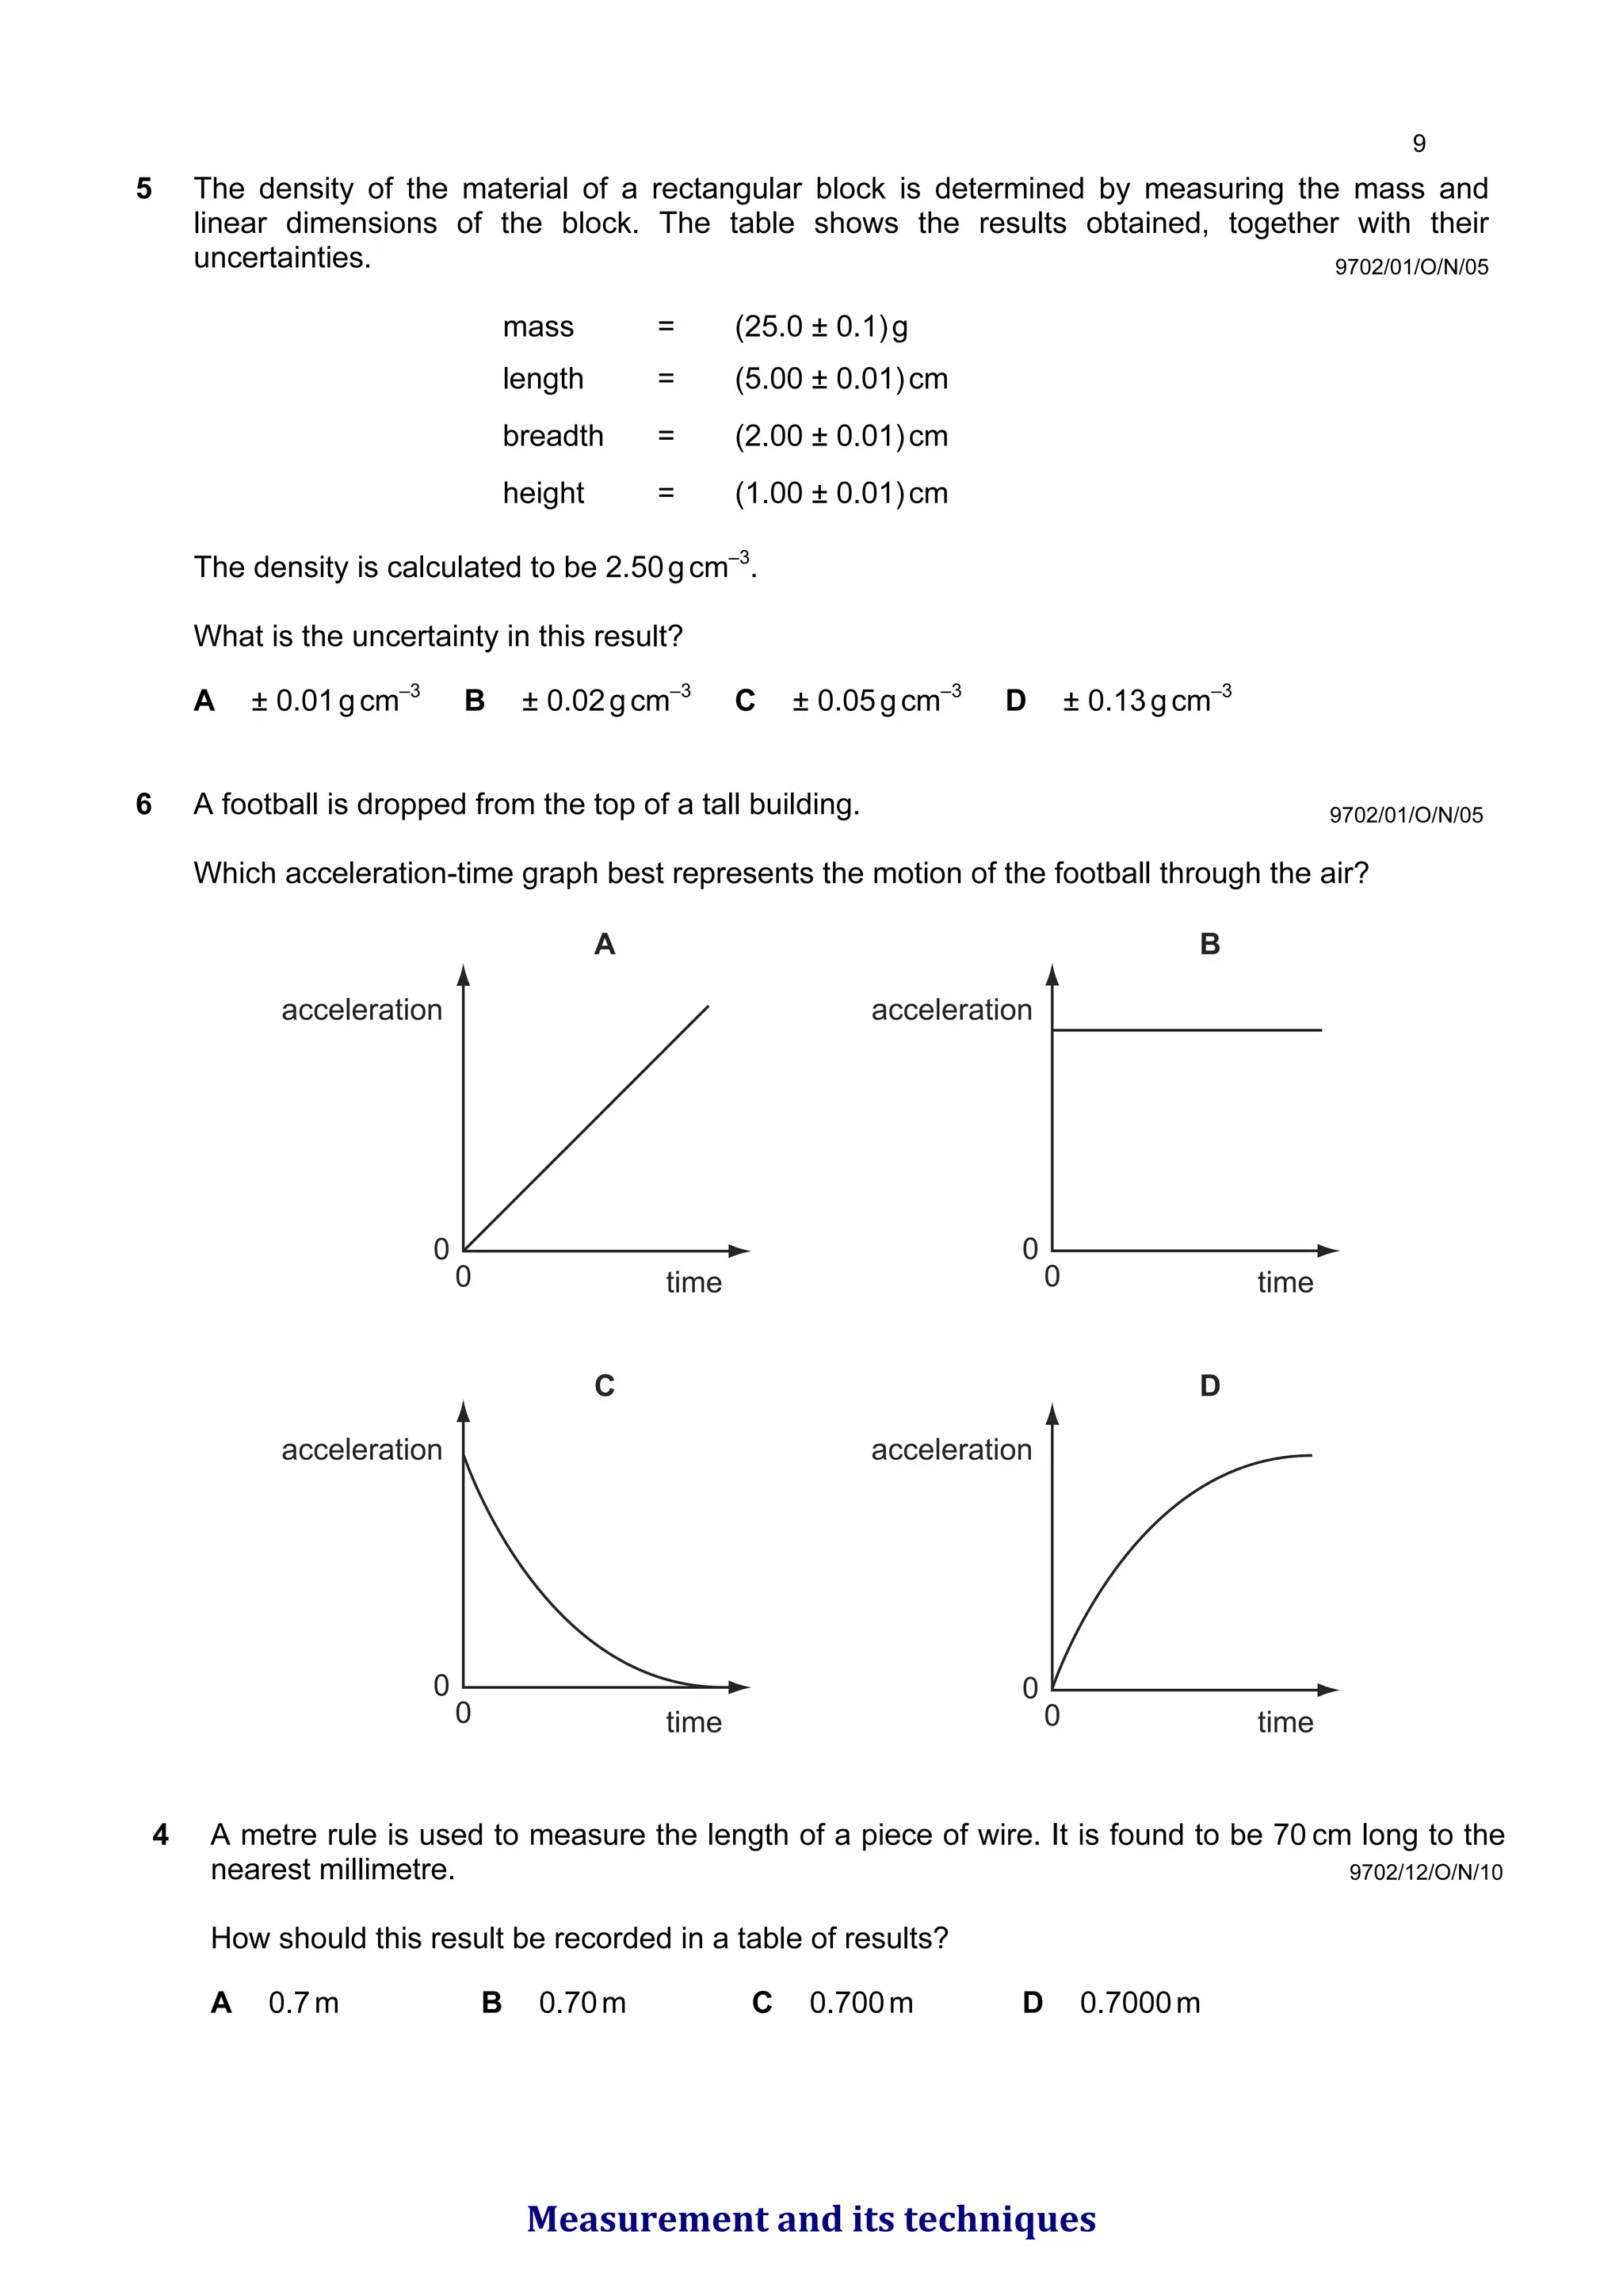
5 The densityof the material of a rectangular block is determined by measuring the mass and
linear dimensions of the block. The table shows the results obtained, together with their
uncertainties.
mass = (25.0 ± 0.1)g
length = (5.00 ± 0.01)cm
breadth = (2.00 ± 0.01)cm
height = (1.00 ± 0.01)cm
The density is calculated to be 2.50gcm–3
.
What is the uncertainty in this result?
A ± 0.01gcm–3
B ± 0.02gcm–3
C ± 0.05gcm–3
D ± 0.13gcm–3
6 A football is dropped from the top of a tall building.
Which acceleration-time graph best represents the motion of the football through the air?
0
0
0
0
0
0
0
0
A
C
B
D
acceleration acceleration
acceleration
acceleration
time
time time
time
9702/01/O/N/05
9702/12/O/N/10
4 A metre rule is used to measure the length of a piece of wire. It is found to be 70 cm long to the
nearest millimetre.
How should this result be recorded in a table of results?
A 0.7m B 0.70m C 0.700m D 0.7000m
Measurement and its techniques
59.
9702/01/M/J/06
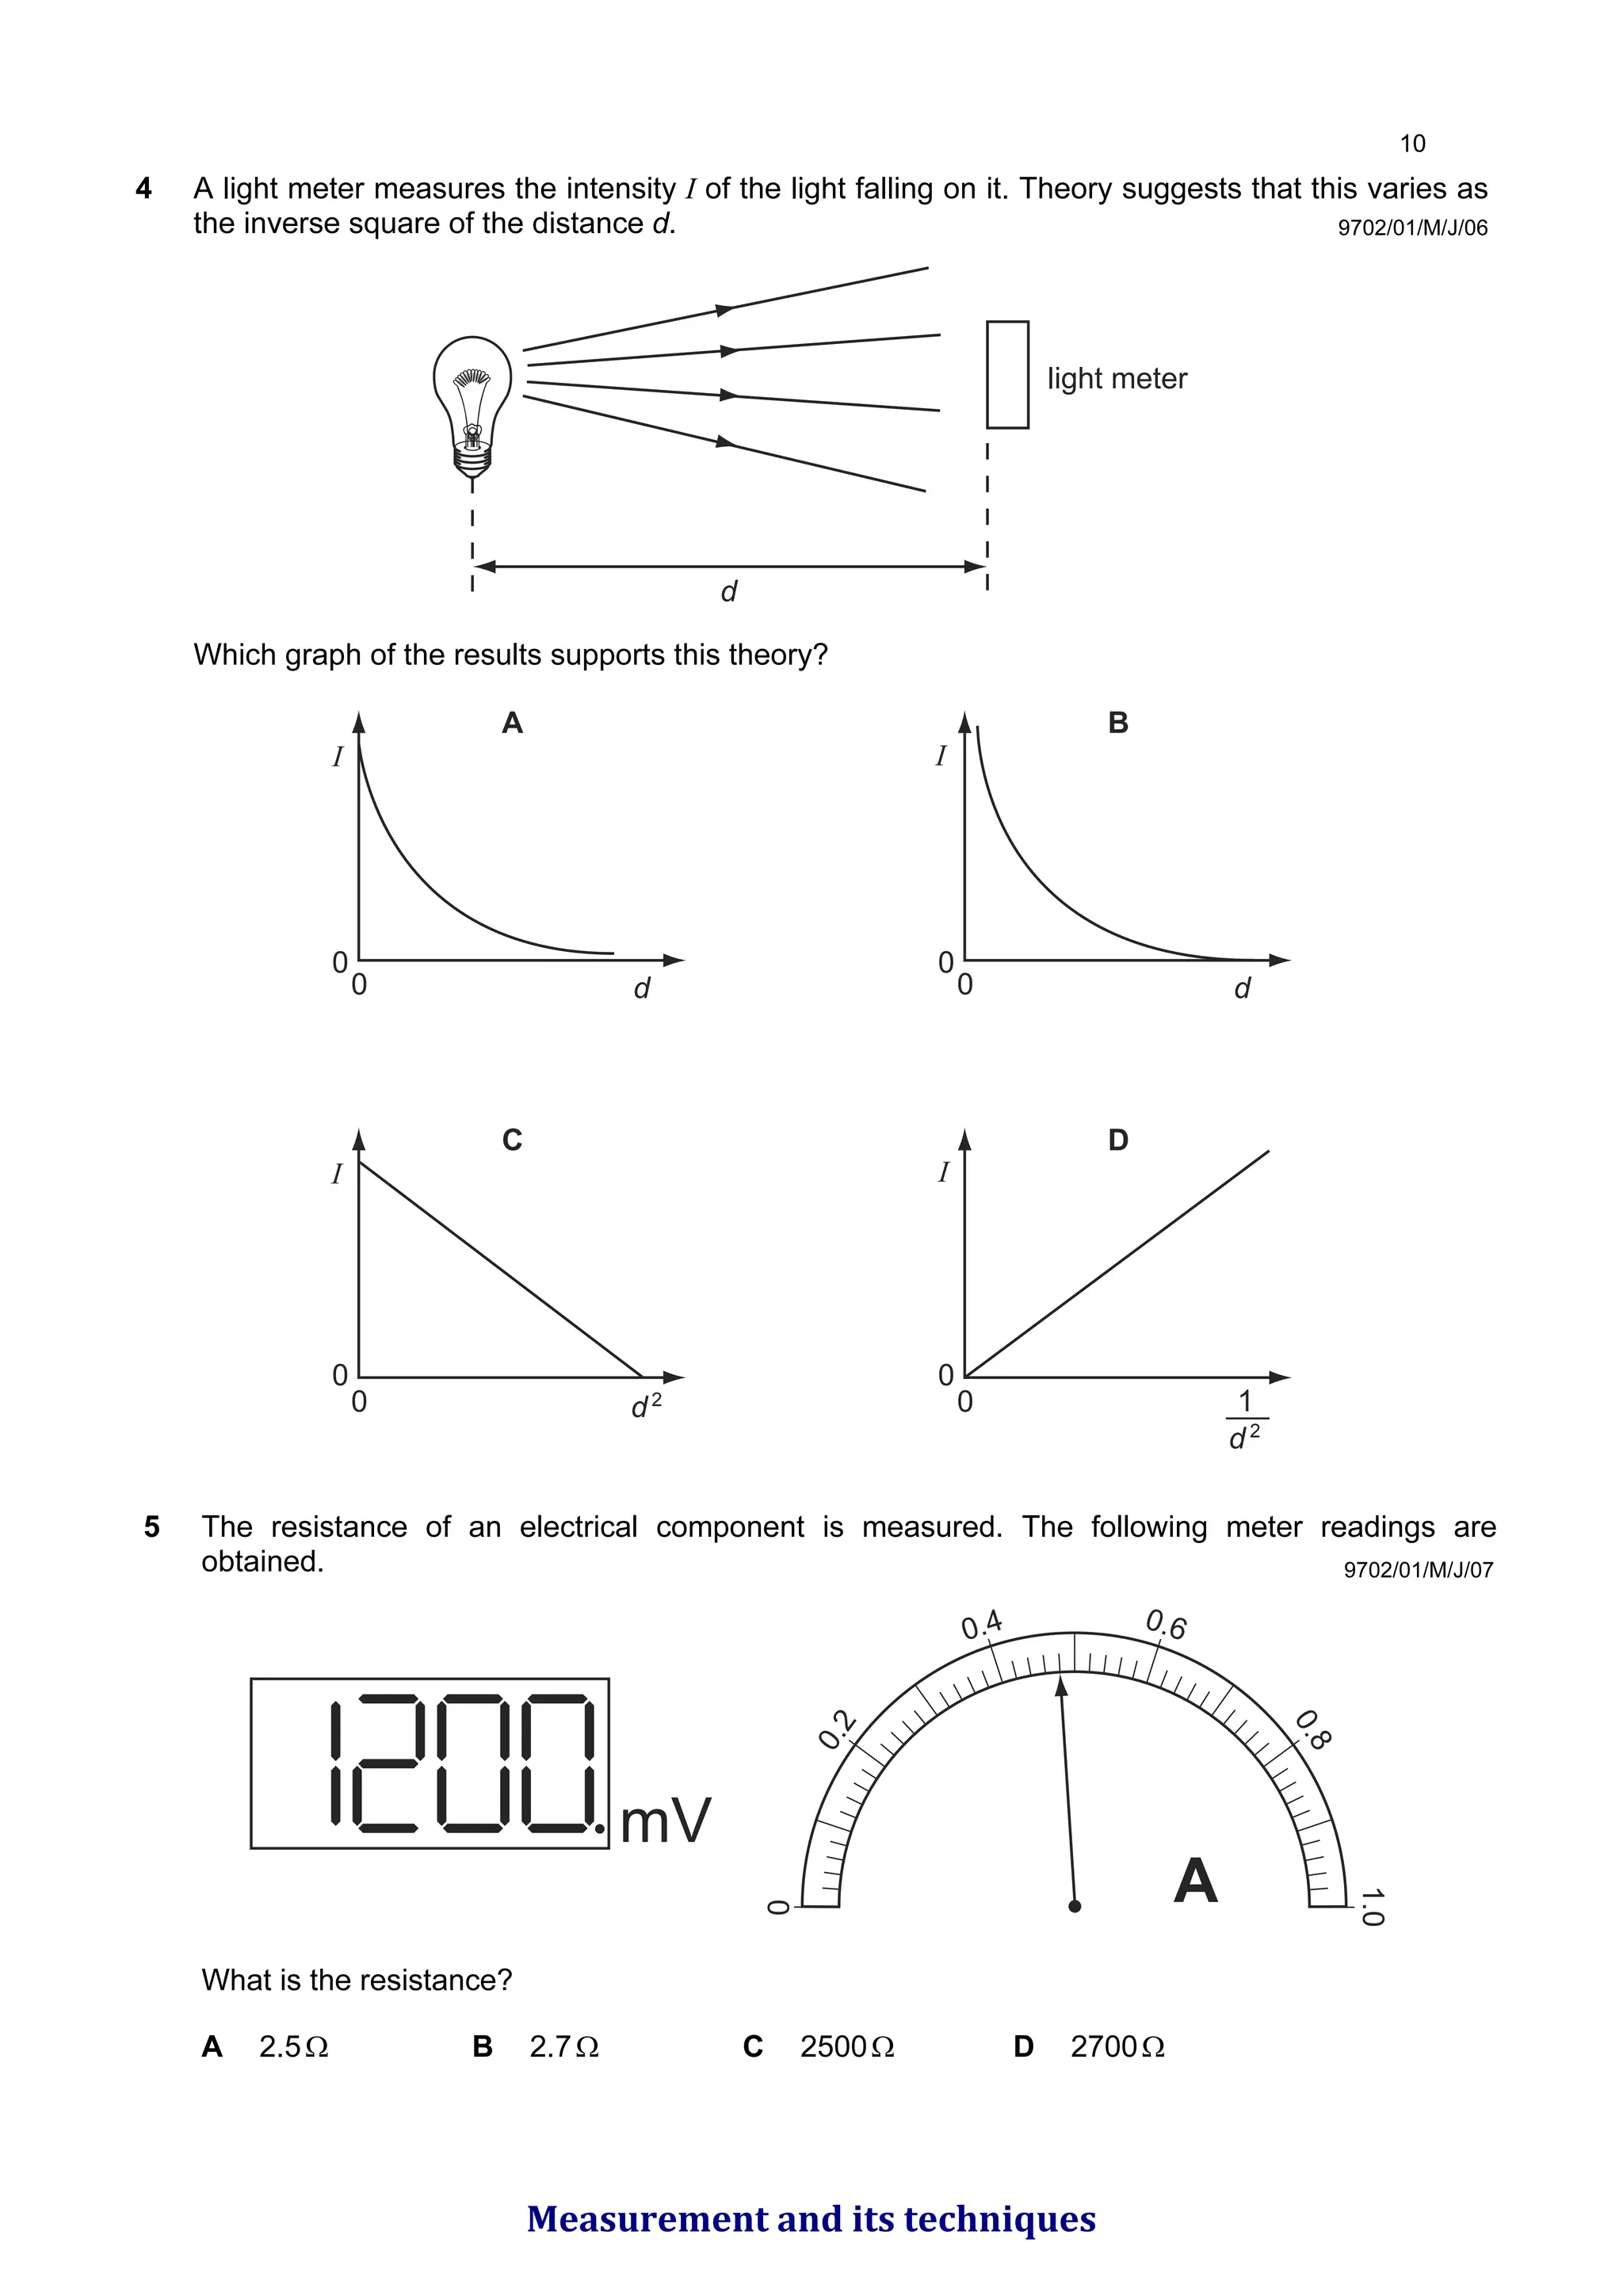
4 A lightmeter measures the intensity I of the light falling on it. Theory suggests that this varies as
the inverse square of the distance d.
light meter
d
Which graph of the results supports this theory?
d
I
0
A
d
I
0
B
d2
I
0
C
1
d 2
I
0
0 0
0 0
D
9702/01/M/J/07
5 The resistance of an electrical component is measured. The following meter readings are
obtained.
0
0
.
2
0.4 0.6
0
.
8
1.0
A
mV
What is the resistance?
A 2.5Ω B 2.7Ω C 2500Ω D 2700Ω
Measurement and its techniques
60.
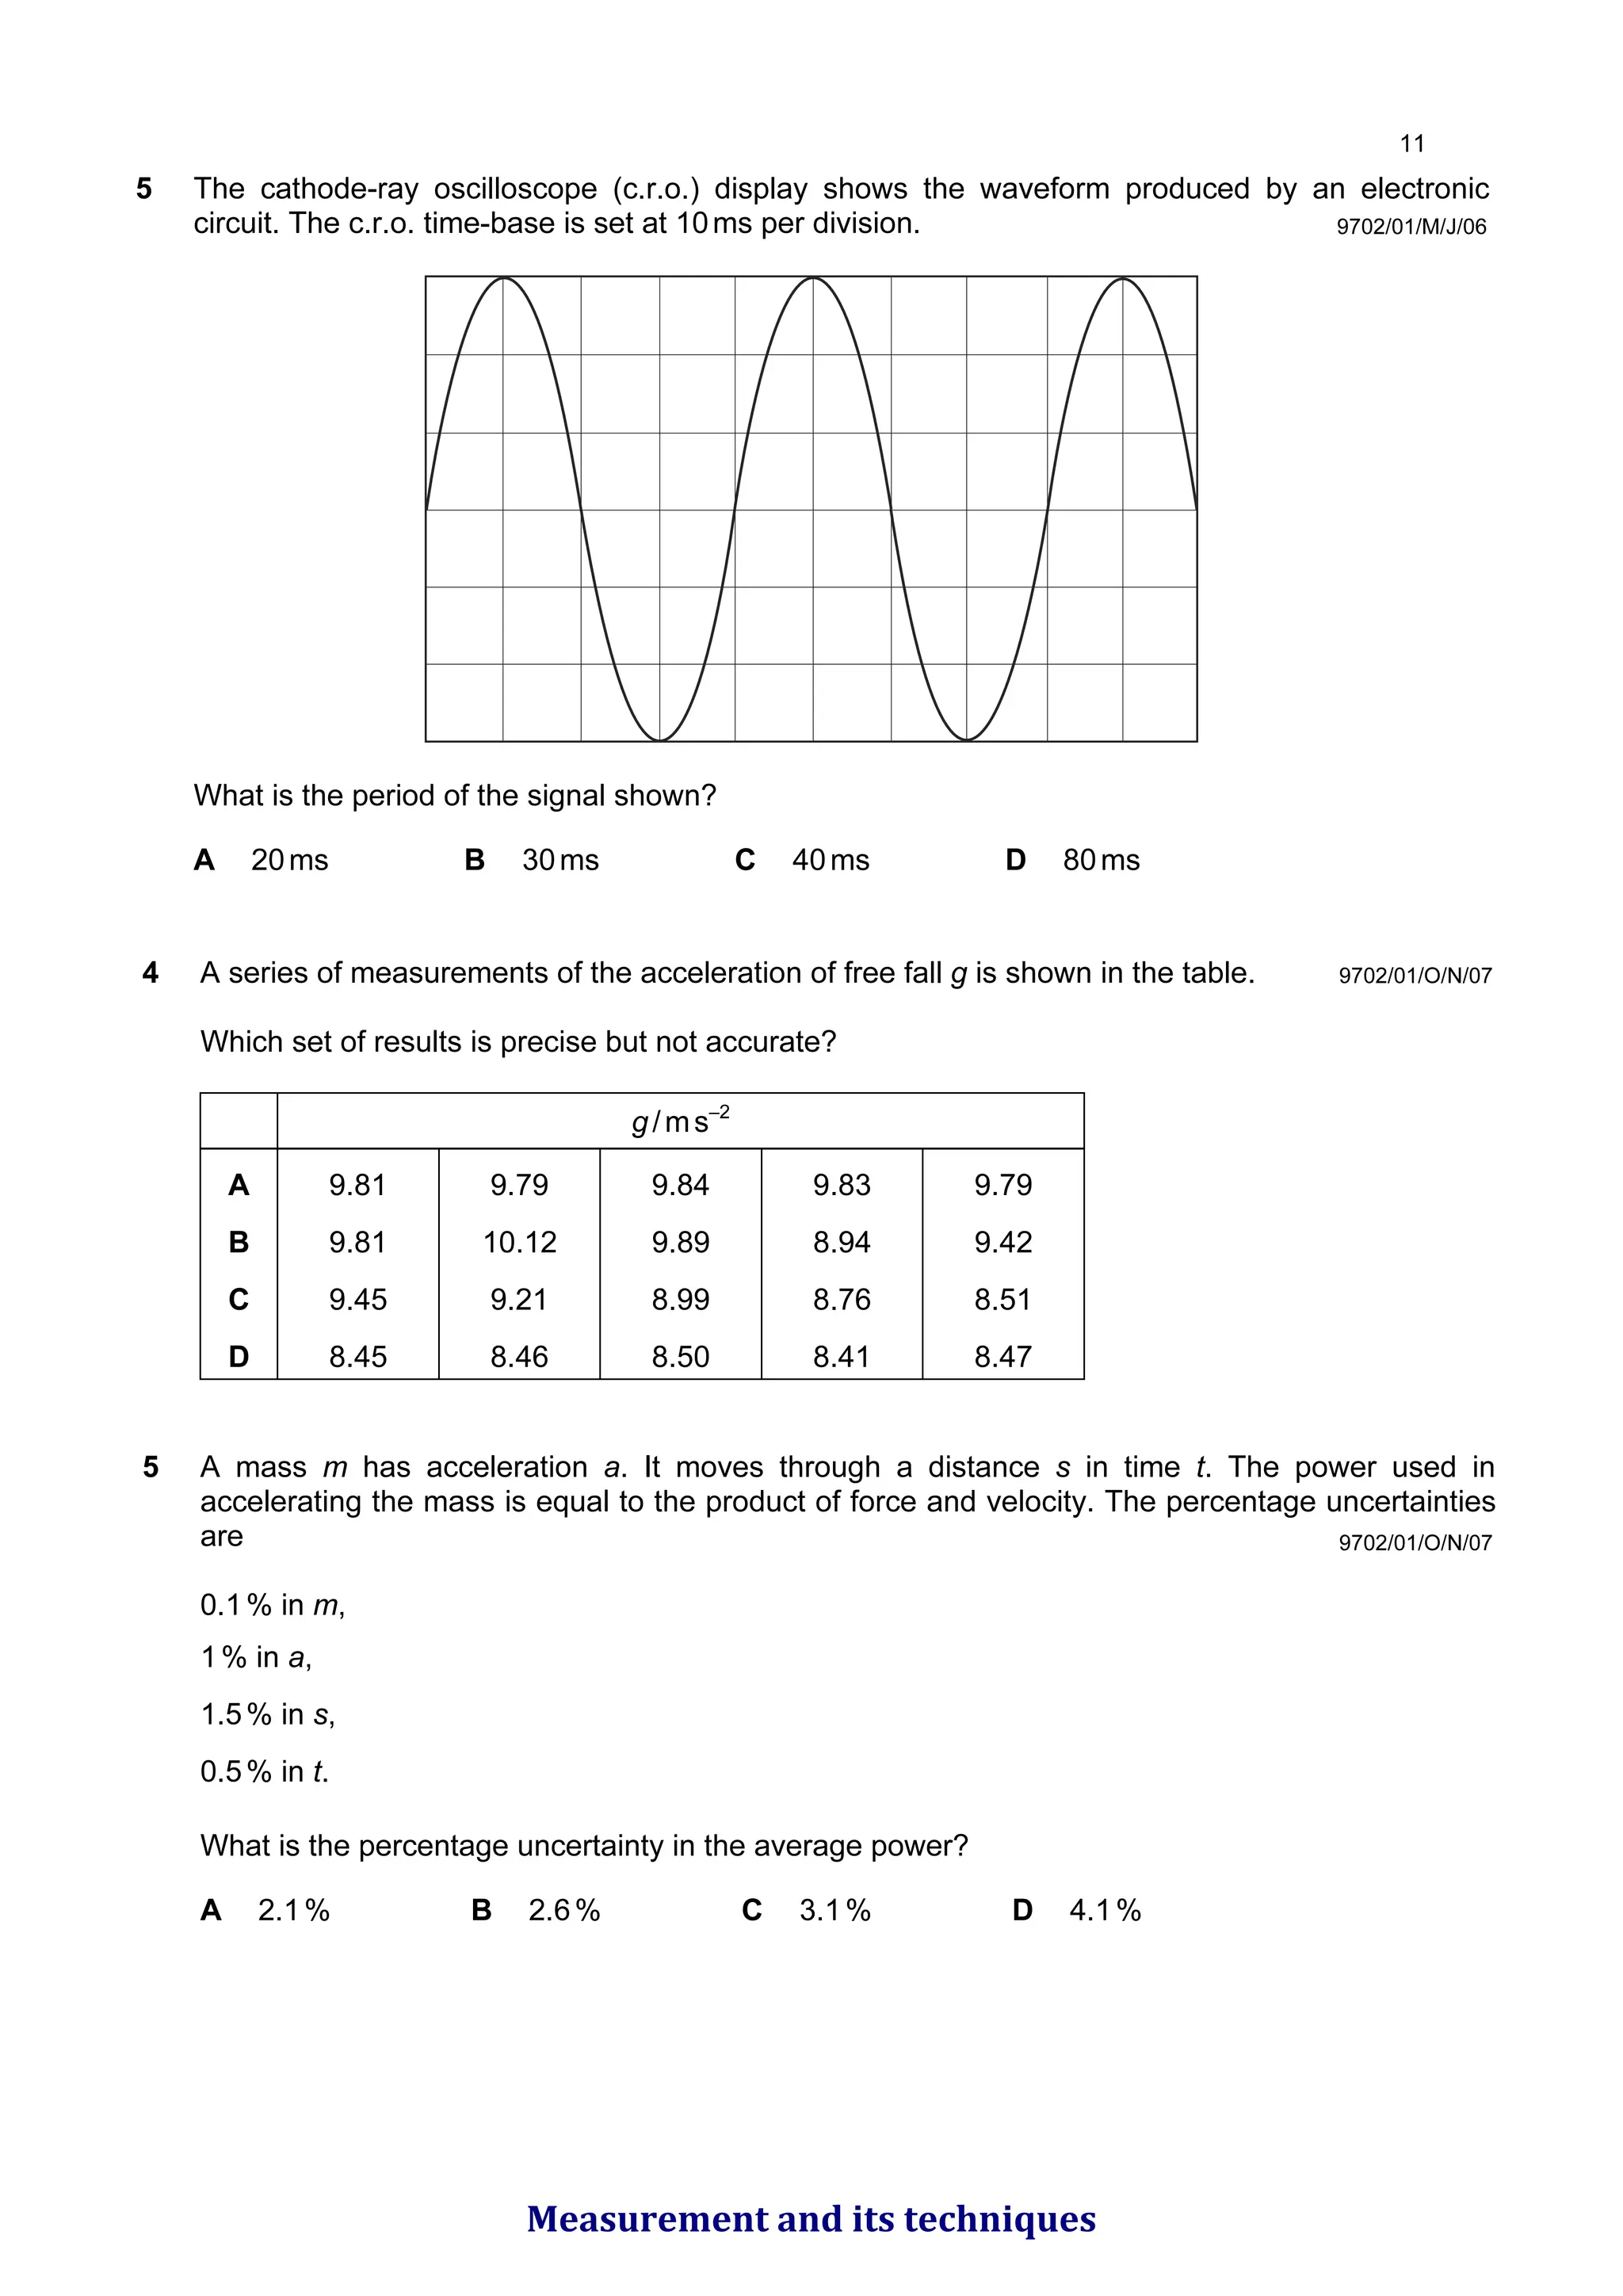
5 The cathode-rayoscilloscope (c.r.o.) display shows the waveform produced by an electronic
circuit. The c.r.o. time-base is set at 10ms per division.
What is the period of the signal shown?
A 20ms B 30ms C 40ms D 80ms
9702/01/M/J/06
9702/01/O/N/07
4 A series of measurements of the acceleration of free fall g is shown in the table.
Which set of results is precise but not accurate?
g/ms–2
A 9.81 9.79 9.84 9.83 9.79
B 9.81 10.12 9.89 8.94 9.42
C 9.45 9.21 8.99 8.76 8.51
D 8.45 8.46 8.50 8.41 8.47
5 A mass m has acceleration a. It moves through a distance s in time t. The power used in
accelerating the mass is equal to the product of force and velocity. The percentage uncertainties
are
0.1% in m,
1% in a,
1.5% in s,
0.5% in t.
What is the percentage uncertainty in the average power?
A 2.1% B 2.6% C 3.1% D 4.1%
9702/01/O/N/07
Measurement and its techniques
61.
9702/01/O/N/06
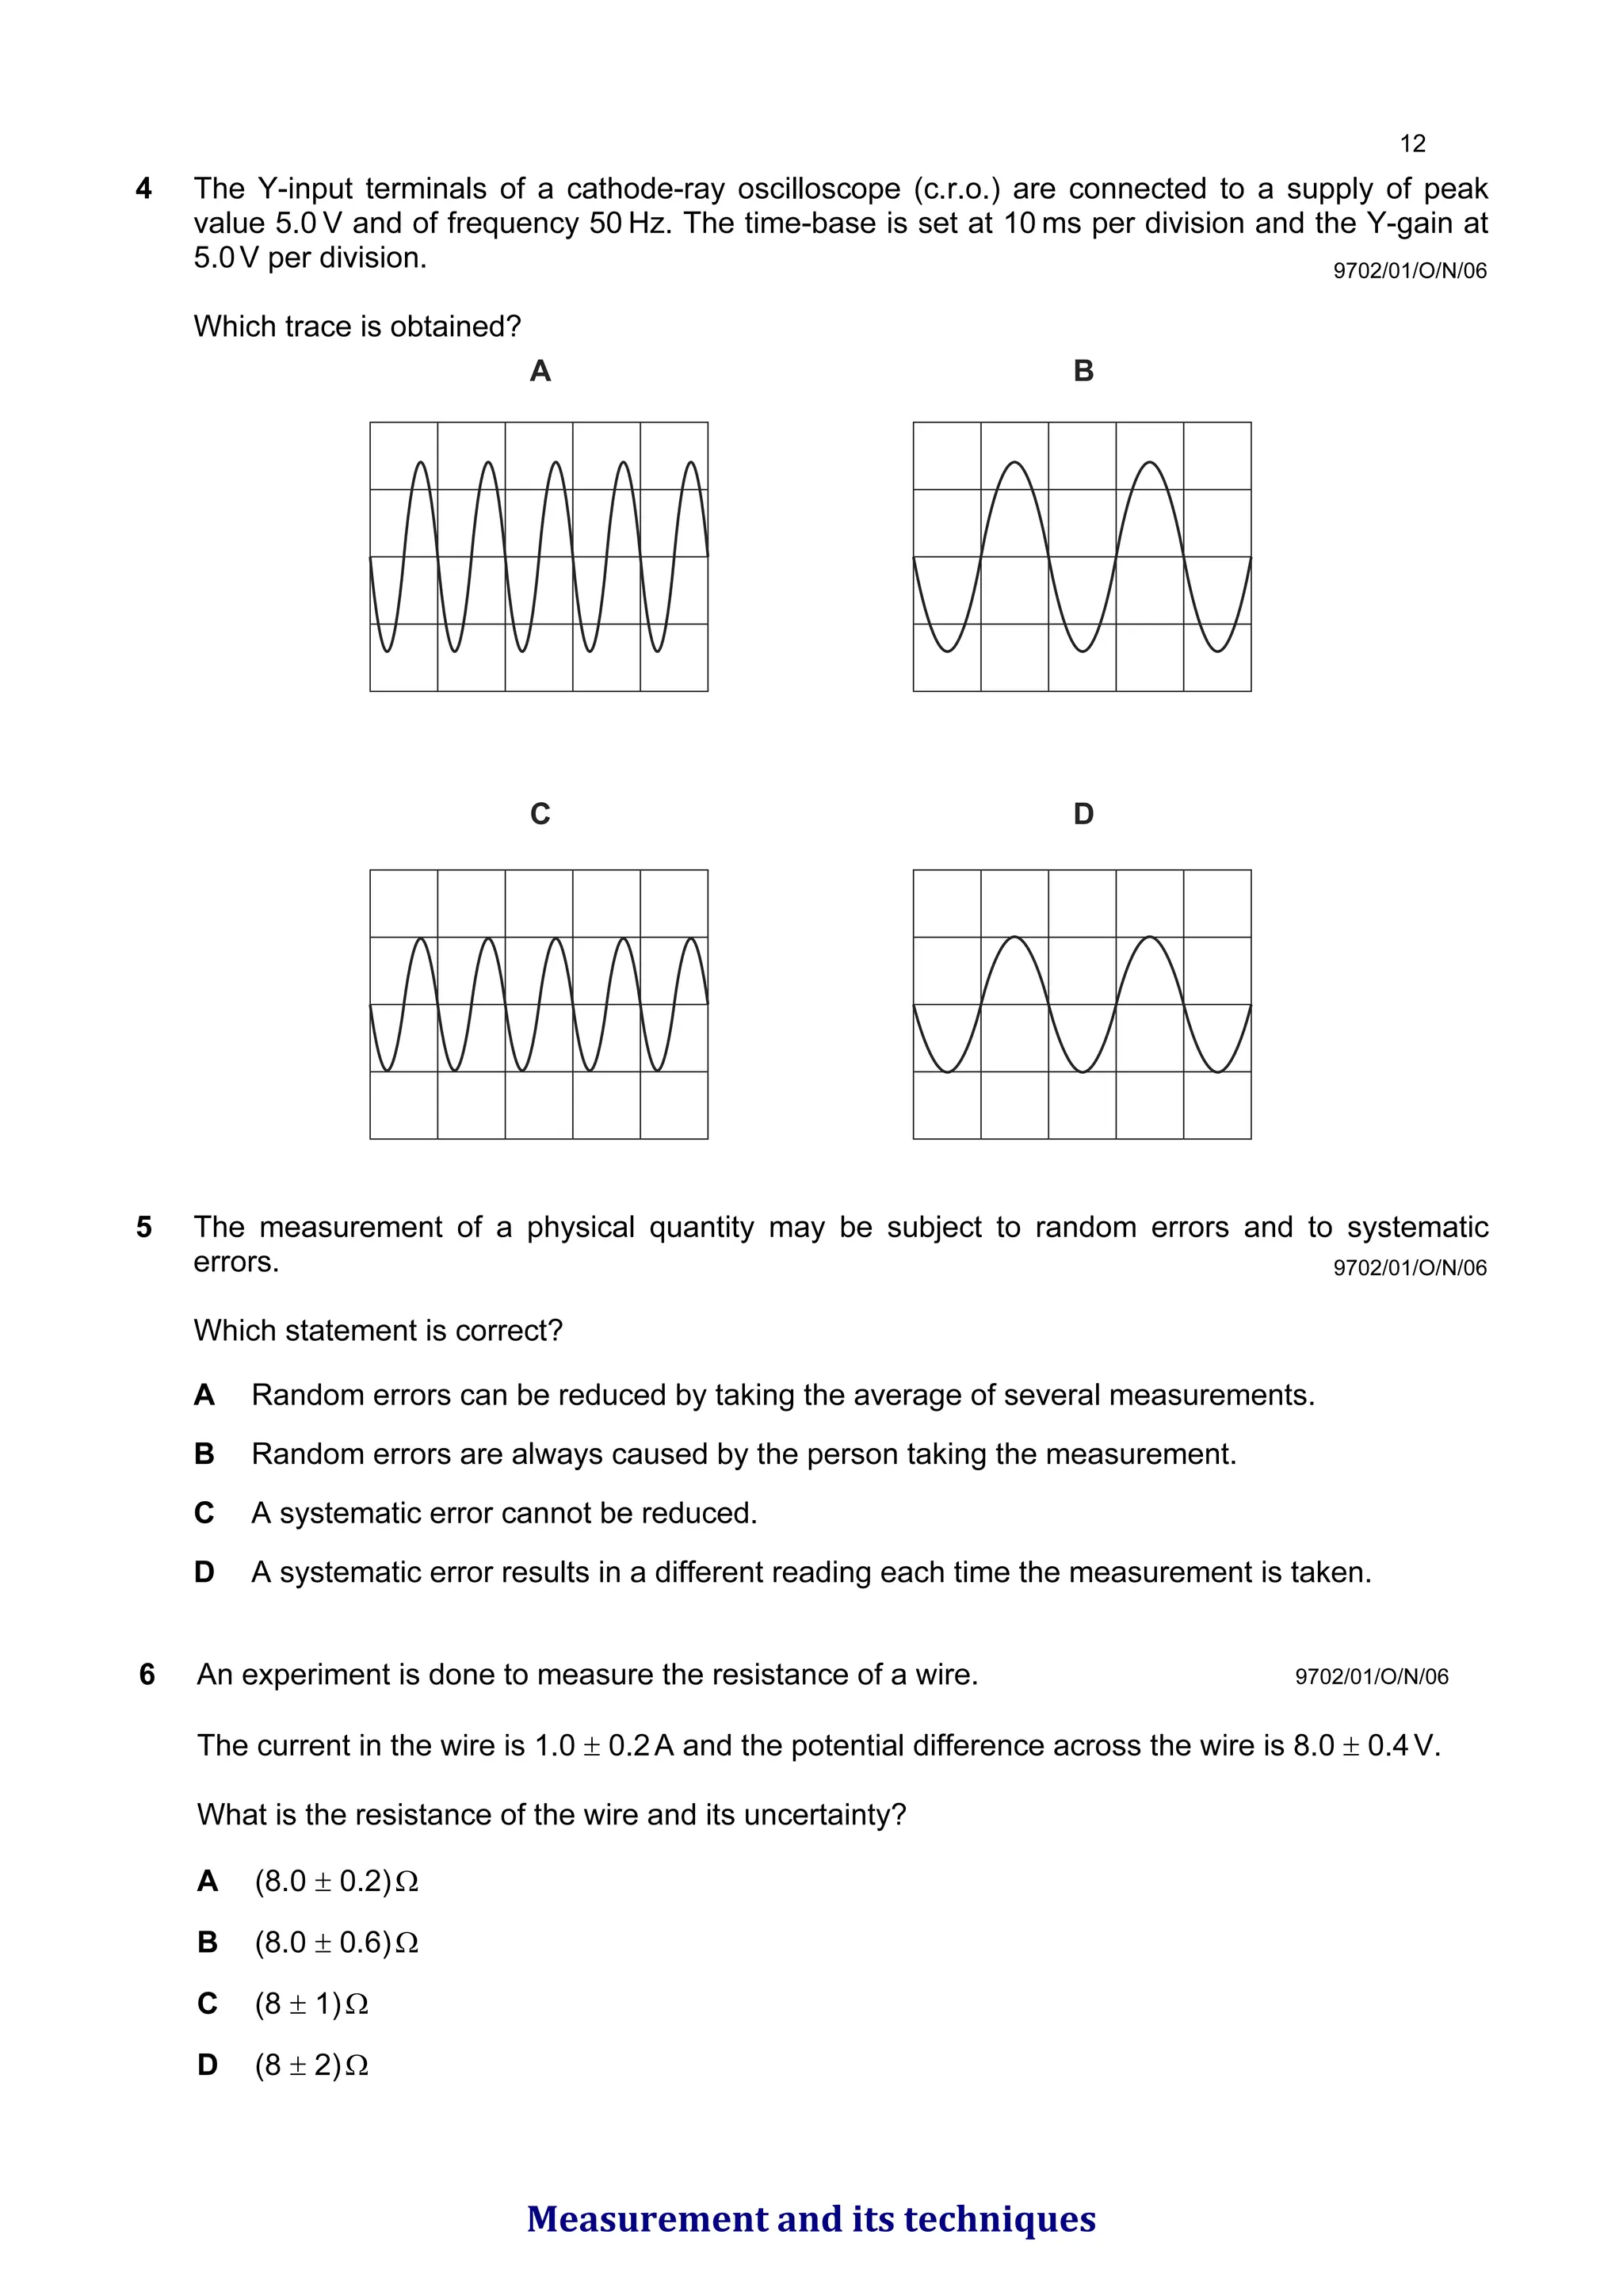
4 The Y-inputterminals of a cathode-ray oscilloscope (c.r.o.) are connected to a supply of peak
value 5.0 V and of frequency 50 Hz. The time-base is set at 10 ms per division and the Y-gain at
5.0V per division.
Which trace is obtained?
A
C D
B
5 The measurement of a physical quantity may be subject to random errors and to systematic
errors.
Which statement is correct?
A Random errors can be reduced by taking the average of several measurements.
B Random errors are always caused by the person taking the measurement.
C A systematic error cannot be reduced.
D A systematic error results in a different reading each time the measurement is taken.
9702/01/O/N/06
9702/01/O/N/06
6 An experiment is done to measure the resistance of a wire.
The current in the wire is 1.0 ± 0.2A and the potential difference across the wire is 8.0 ± 0.4V.
What is the resistance of the wire and its uncertainty?
A (8.0 ± 0.2)Ω
B (8.0 ± 0.6)Ω
C (8 ± 1)Ω
D (8 ± 2)Ω
Measurement and its techniques
62.
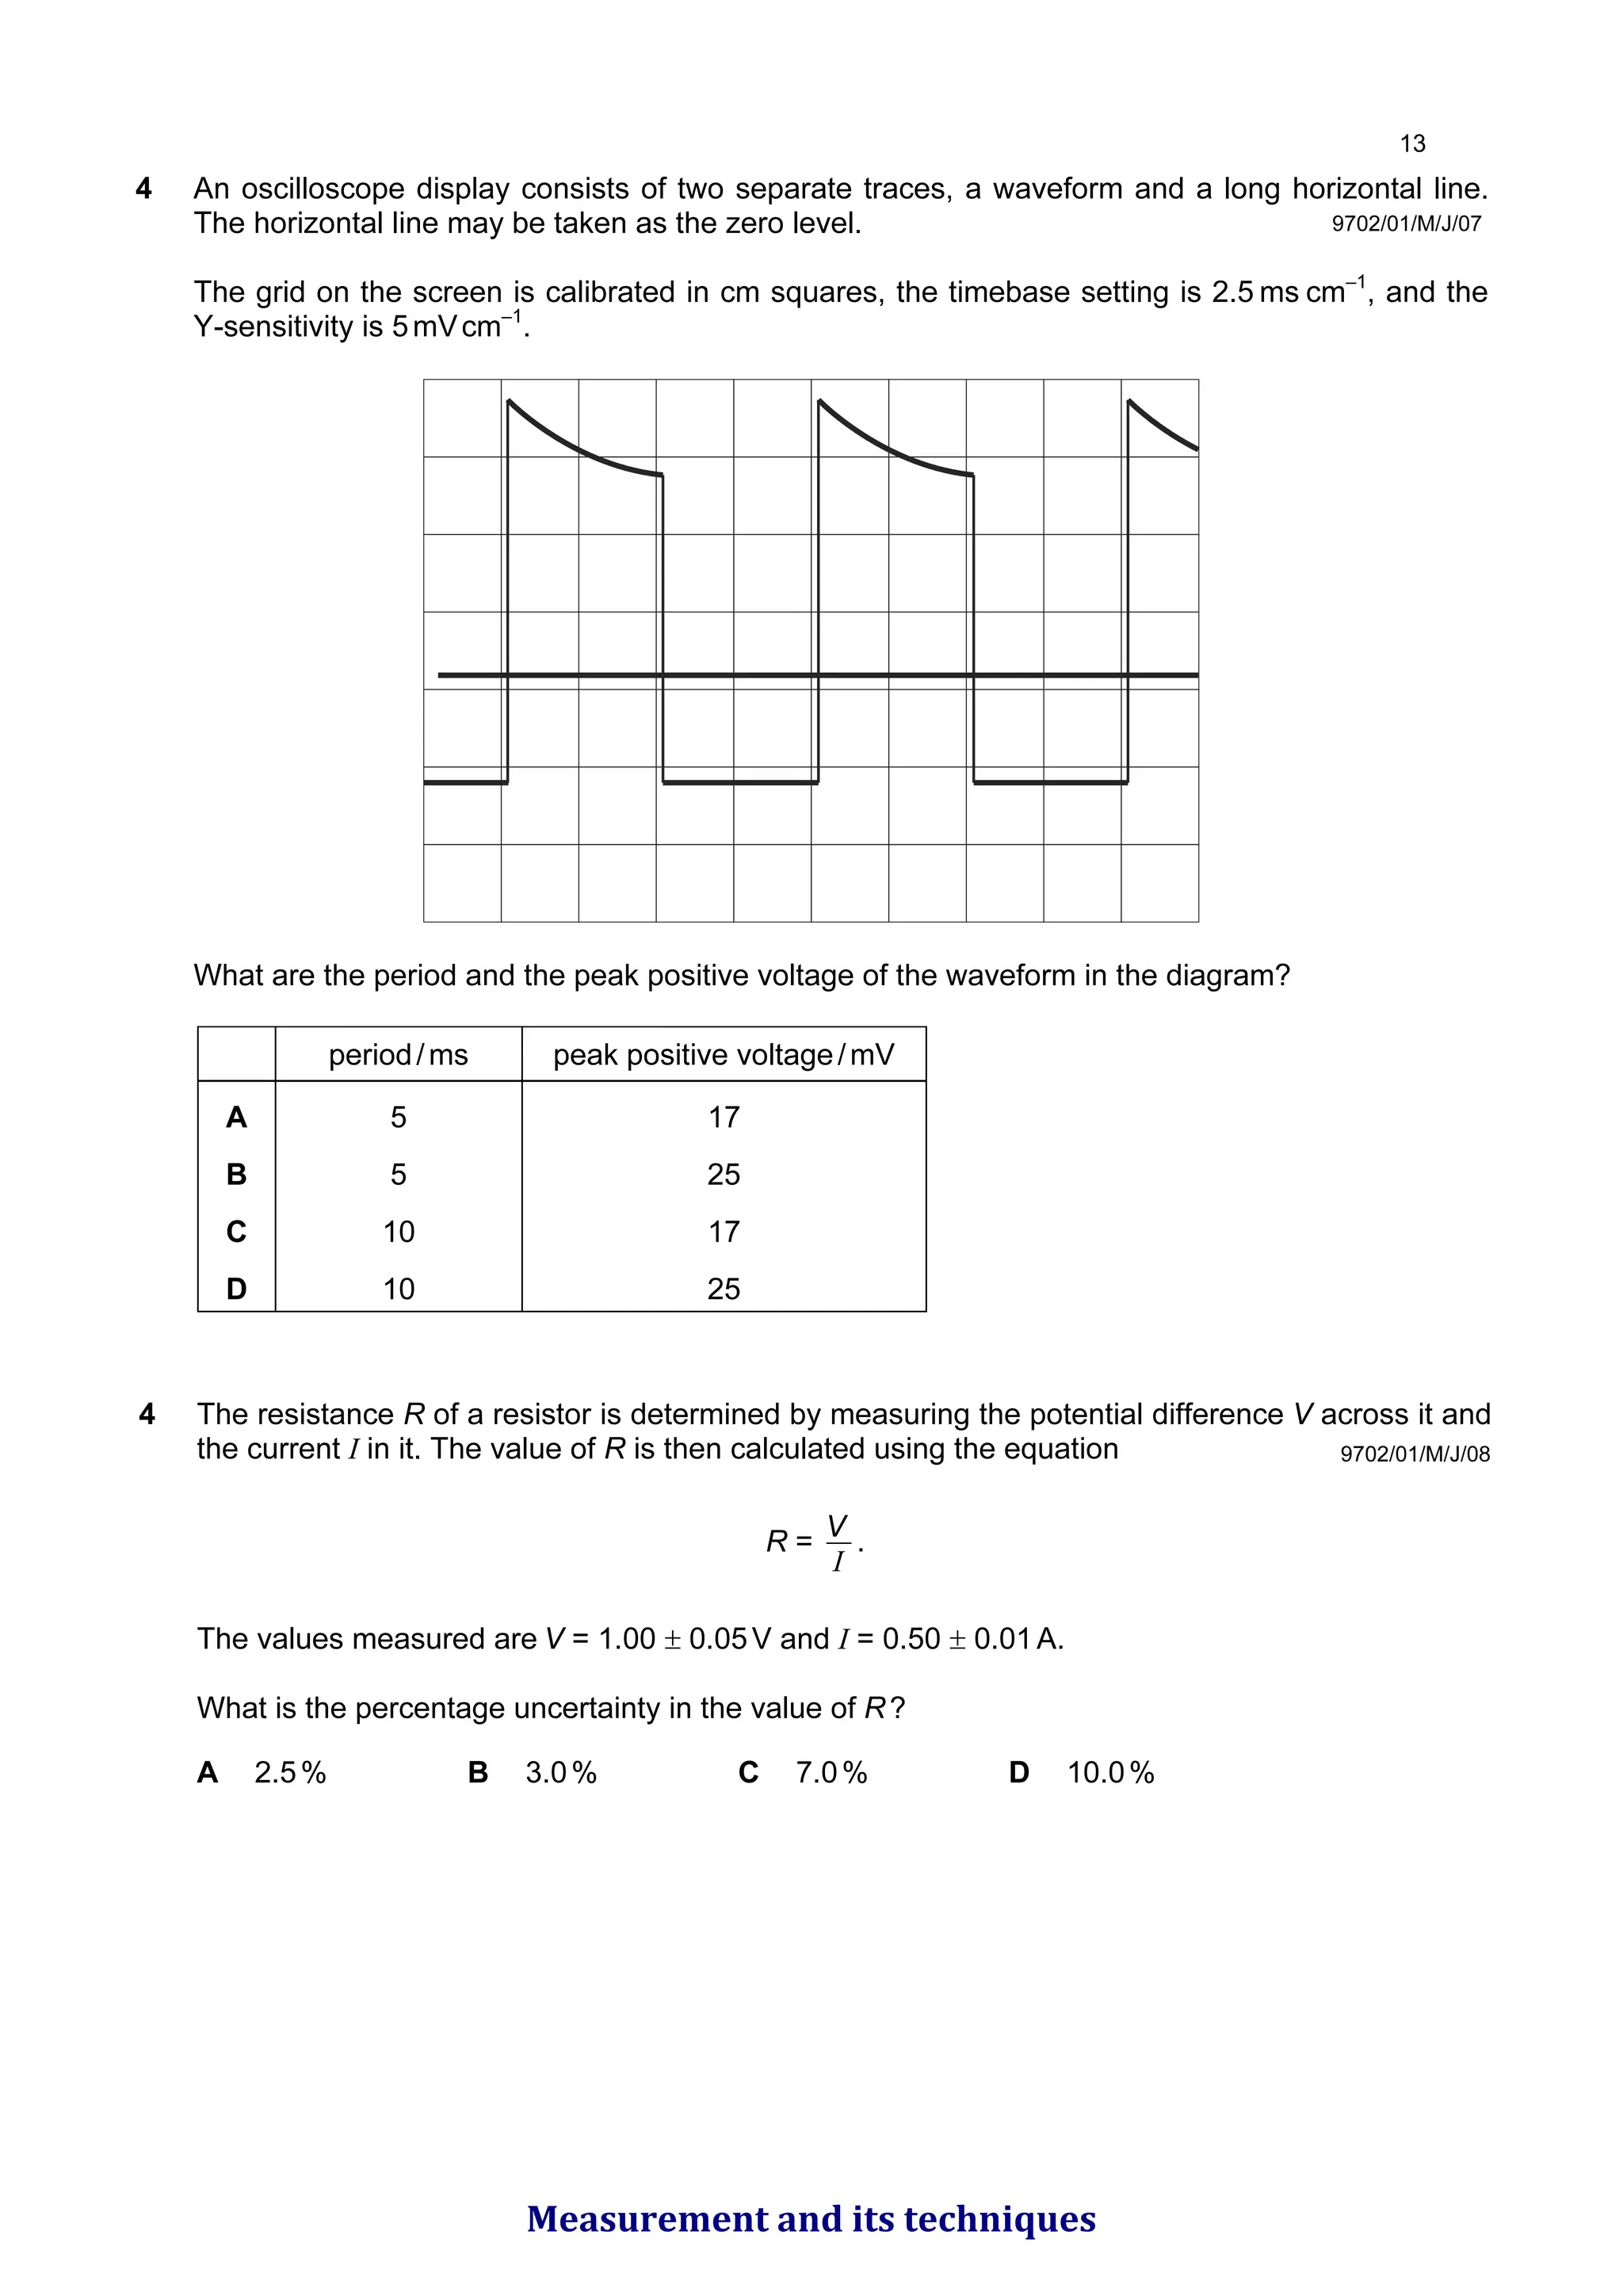
4 An oscilloscopedisplay consists of two separate traces, a waveform and a long horizontal line.
The horizontal line may be taken as the zero level.
The grid on the screen is calibrated in cm squares, the timebase setting is 2.5 ms cm–1
, and the
Y-sensitivity is 5mVcm–1
.
What are the period and the peak positive voltage of the waveform in the diagram?
period/ms peak positive voltage/mV
A 5 17
B 5 25
C 10 17
D 10 25
9702/01/M/J/07
9702/01/M/J/08
4 The resistance R of a resistor is determined by measuring the potential difference V across it and
the current I in it. The value of R is then calculated using the equation
R =
I
V .
The values measured are V = 1.00 ± 0.05V and I = 0.50 ± 0.01A.
What is the percentage uncertainty in the value of R?
A 2.5% B 3.0% C 7.0% D 10.0%
Measurement and its techniques
63.
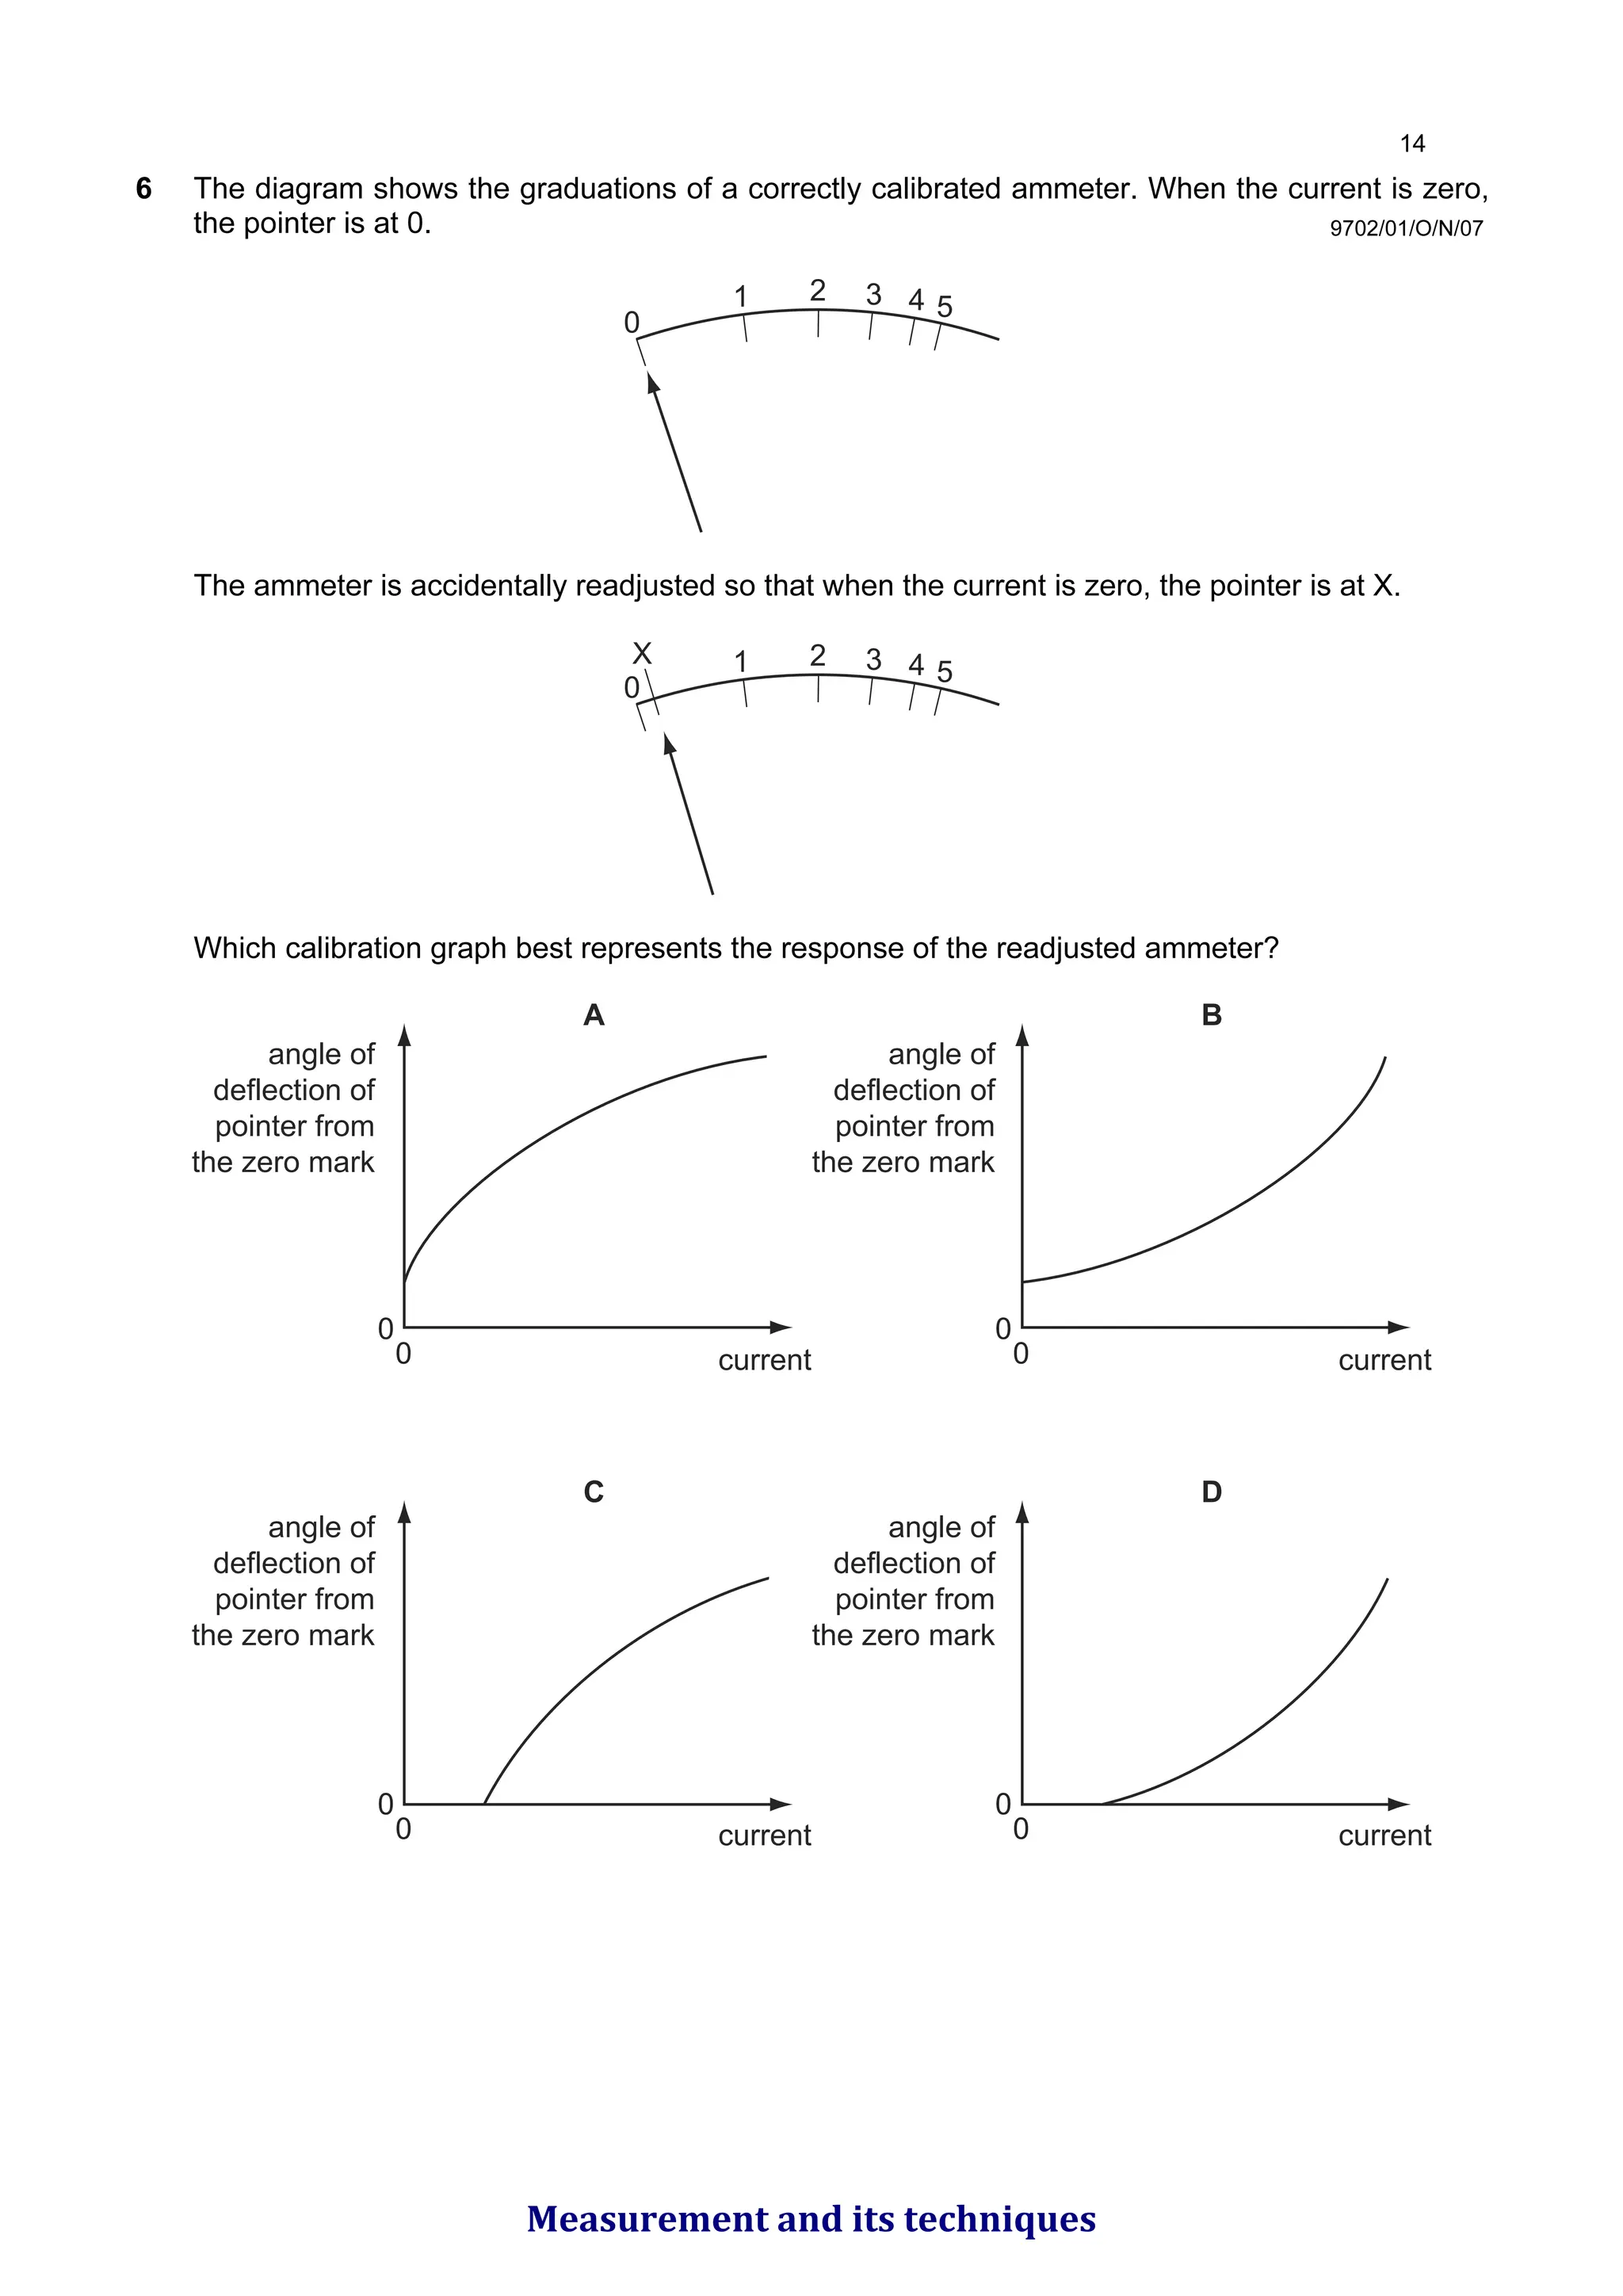
9702/01/O/N/07
6 The diagramshows the graduations of a correctly calibrated ammeter. When the current is zero,
the pointer is at 0.
0
1 2 3 4 5
The ammeter is accidentally readjusted so that when the current is zero, the pointer is at X.
X
0
1 2 3 4 5
Which calibration graph best represents the response of the readjusted ammeter?
A
angle of
deflection of
pointer from
the zero mark
angle of
deflection of
pointer from
the zero mark
angle of
deflection of
pointer from
the zero mark
angle of
deflection of
pointer from
the zero mark
current
current
current
current
B
C D
0
0
0
0
0
0
0
0
Measurement and its techniques
64.
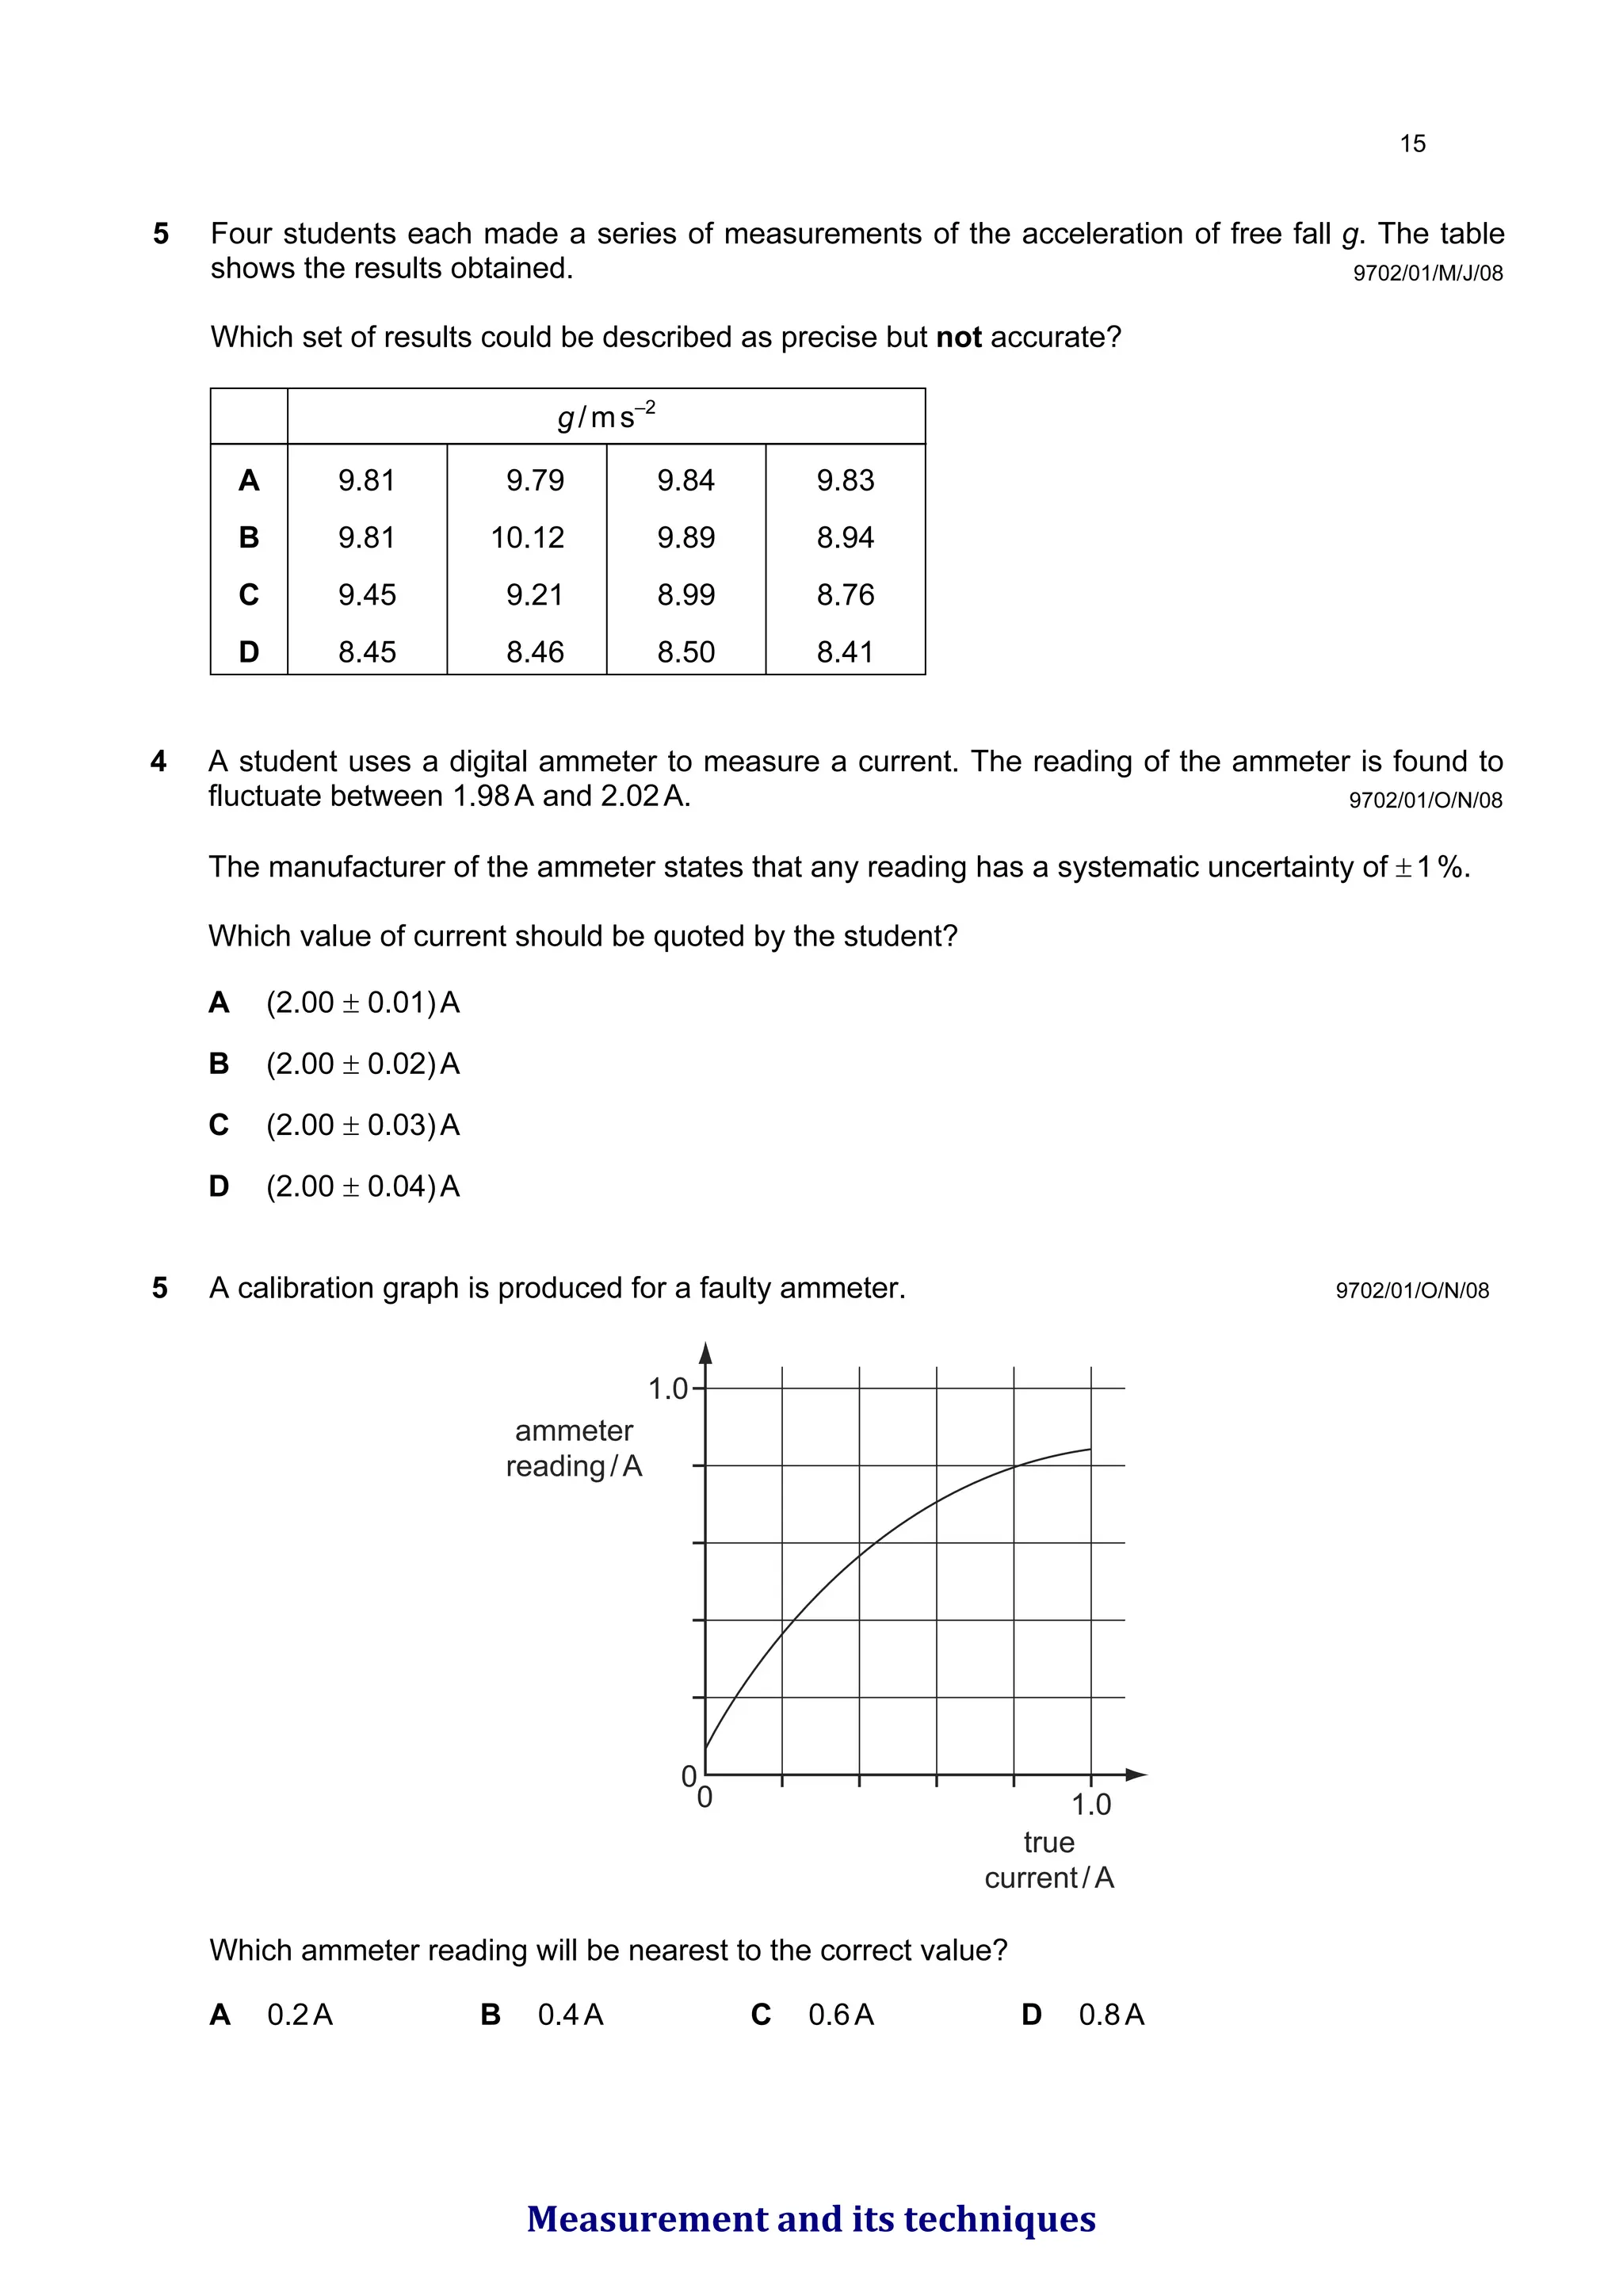
9702/01/O/N/08
4 A studentuses a digital ammeter to measure a current. The reading of the ammeter is found to
fluctuate between 1.98A and 2.02A.
The manufacturer of the ammeter states that any reading has a systematic uncertainty of ±1%.
Which value of current should be quoted by the student?
A (2.00 ± 0.01)A
B (2.00 ± 0.02)A
C (2.00 ± 0.03)A
D (2.00 ± 0.04)A
9702/01/O/N/08
5 A calibration graph is produced for a faulty ammeter.
1.0
1.0
0
0
ammeter
reading/A
true
current/A
Which ammeter reading will be nearest to the correct value?
A 0.2A B 0.4A C 0.6A D 0.8A
9702/01/M/J/08
5 Four students each made a series of measurements of the acceleration of free fall g. The table
shows the results obtained.
Which set of results could be described as precise but not accurate?
g/ms–2
A 9.81 9.79 9.84 9.83
B 9.81 10.12 9.89 8.94
C 9.45 9.21 8.99 8.76
D 8.45 8.46 8.50 8.41
Measurement and its techniques
65.
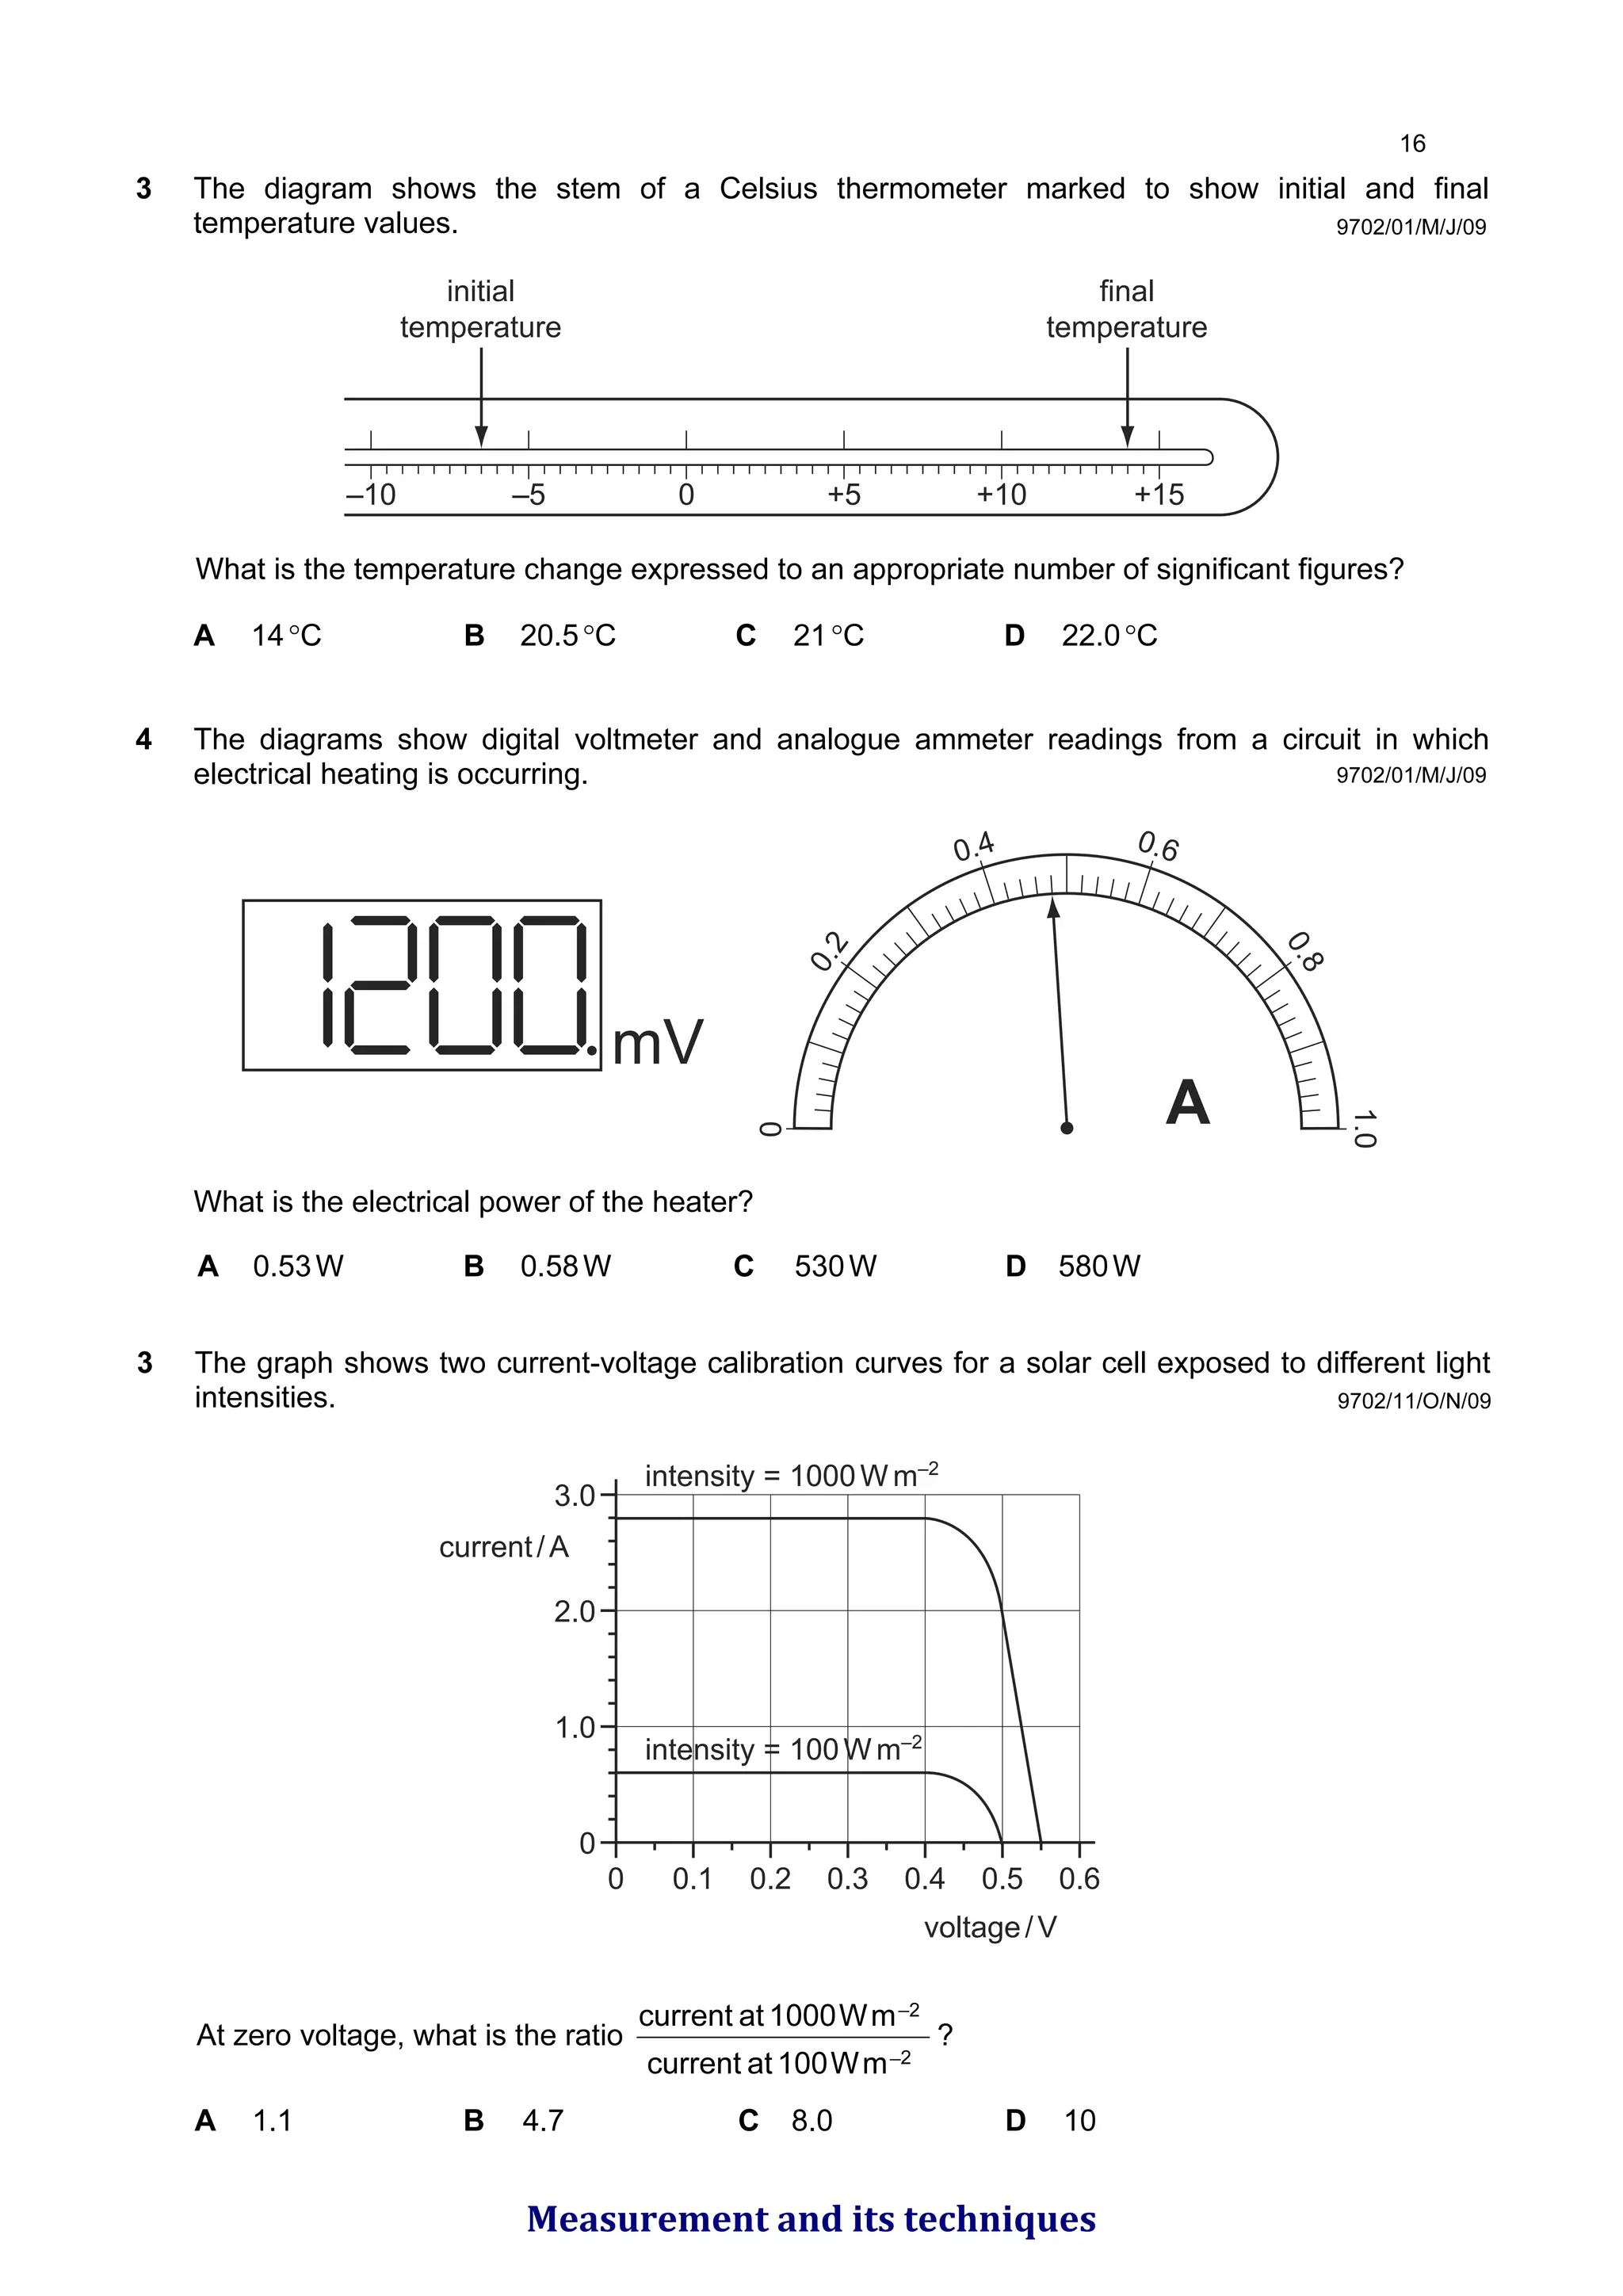
9702/01/M/J/09
3 The diagramshows the stem of a Celsius thermometer marked to show initial and final
temperature values.
–10 –5 0 +5 +10 +15
initial
temperature
final
temperature
What is the temperature change expressed to an appropriate number of significant figures?
A 14°C B 20.5°C C 21°C D 22.0°C
4 The diagrams show digital voltmeter and analogue ammeter readings from a circuit in which
electrical heating is occurring. 0
0
.
2
0.4 0.6
0
.
8
1.0
A
mV
What is the electrical power of the heater?
A 0.53W B 0.58W C 530W D 580W
9702/01/M/J/09
9702/11/O/N/09
3 The graph shows two current-voltage calibration curves for a solar cell exposed to different light
intensities.
3.0
2.0
1.0
0
0 0.1 0.2 0.3 0.4 0.5 0.6
voltage/V
current/A
intensity = 1000W m–2
intensity = 100W m–2
At zero voltage, what is the ratio
2
_
2
_
m
W
100
at
current
m
W
1000
at
current
?
A 1.1 B 4.7 C 8.0 D 10
Measurement and its techniques
66.
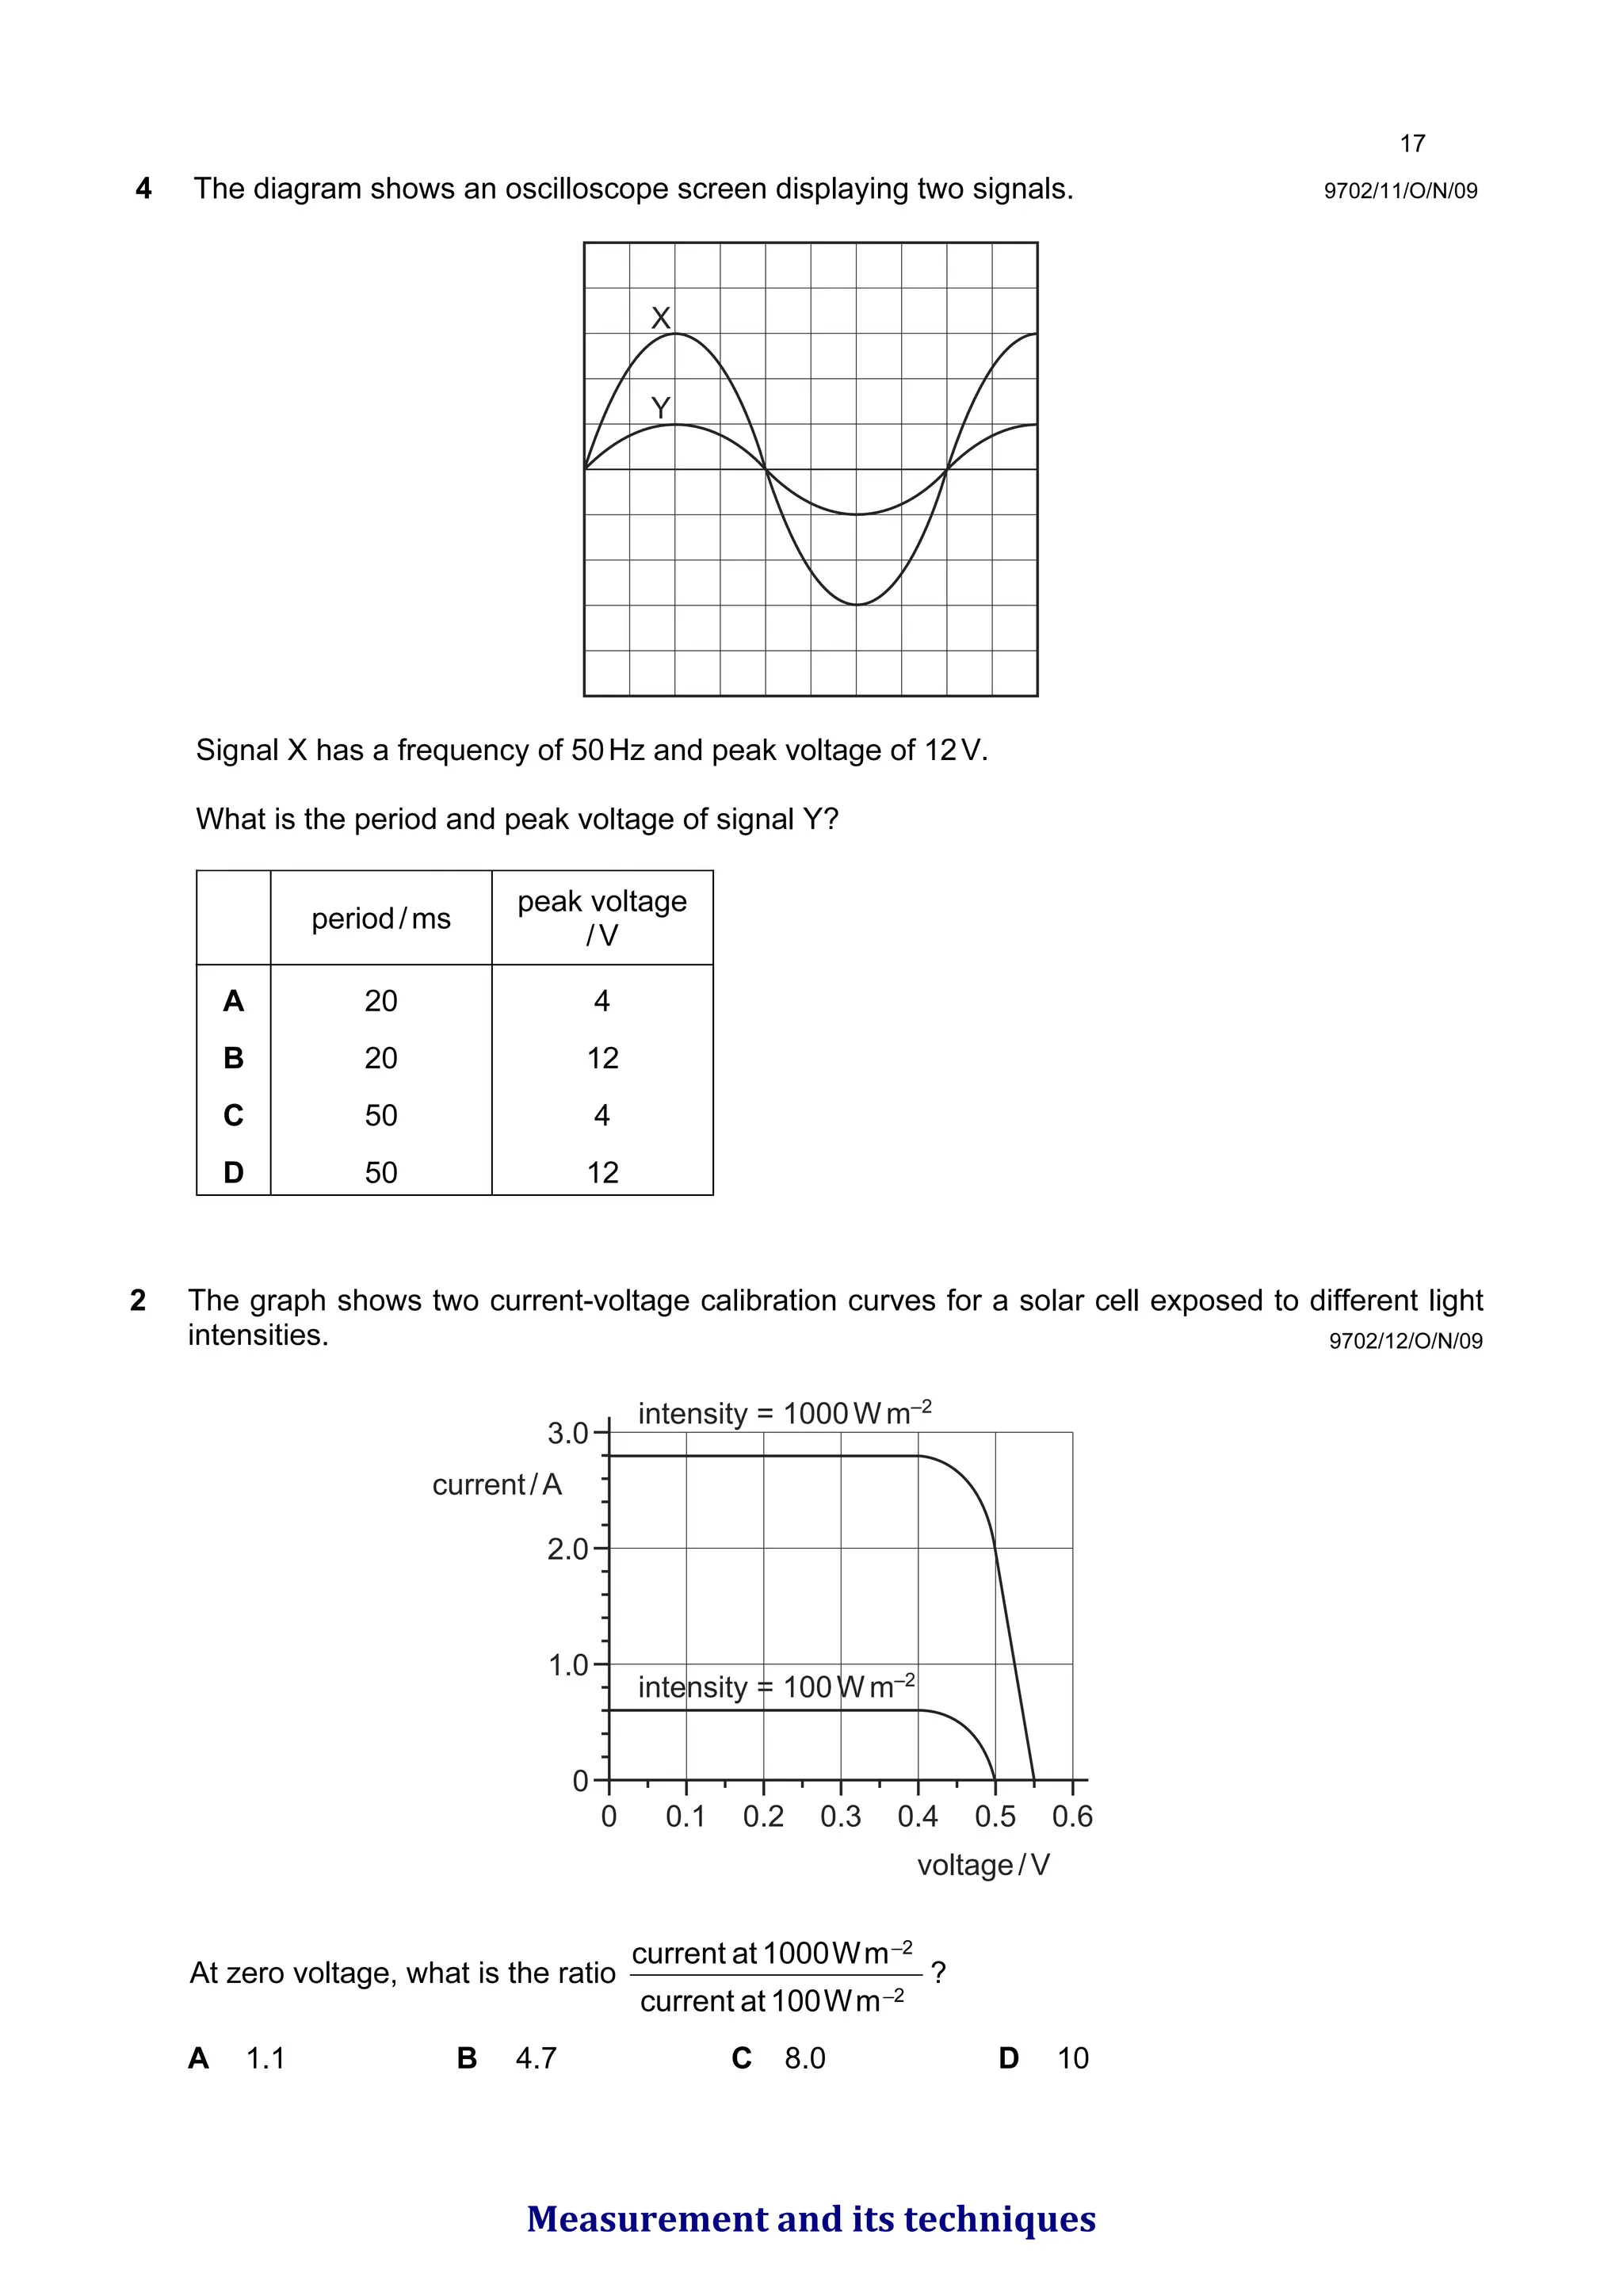
9702/11/O/N/09
4 The diagramshows an oscilloscope screen displaying two signals.
X
Y
Signal X has a frequency of 50Hz and peak voltage of 12V.
What is the period and peak voltage of signal Y?
period/ms
peak voltage
/V
A 20 4
B 20 12
C 50 4
D 50 12
9702/12/O/N/09
2 The graph shows two current-voltage calibration curves for a solar cell exposed to different light
intensities.
3.0
2.0
1.0
0
0 0.1 0.2 0.3 0.4 0.5 0.6
voltage/V
current/A
intensity = 1000W m–2
intensity = 100W m–2
At zero voltage, what is the ratio
2
_
2
_
m
W
100
at
current
m
W
1000
at
current
?
A 1.1 B 4.7 C 8.0 D 10
Measurement and its techniques
67.
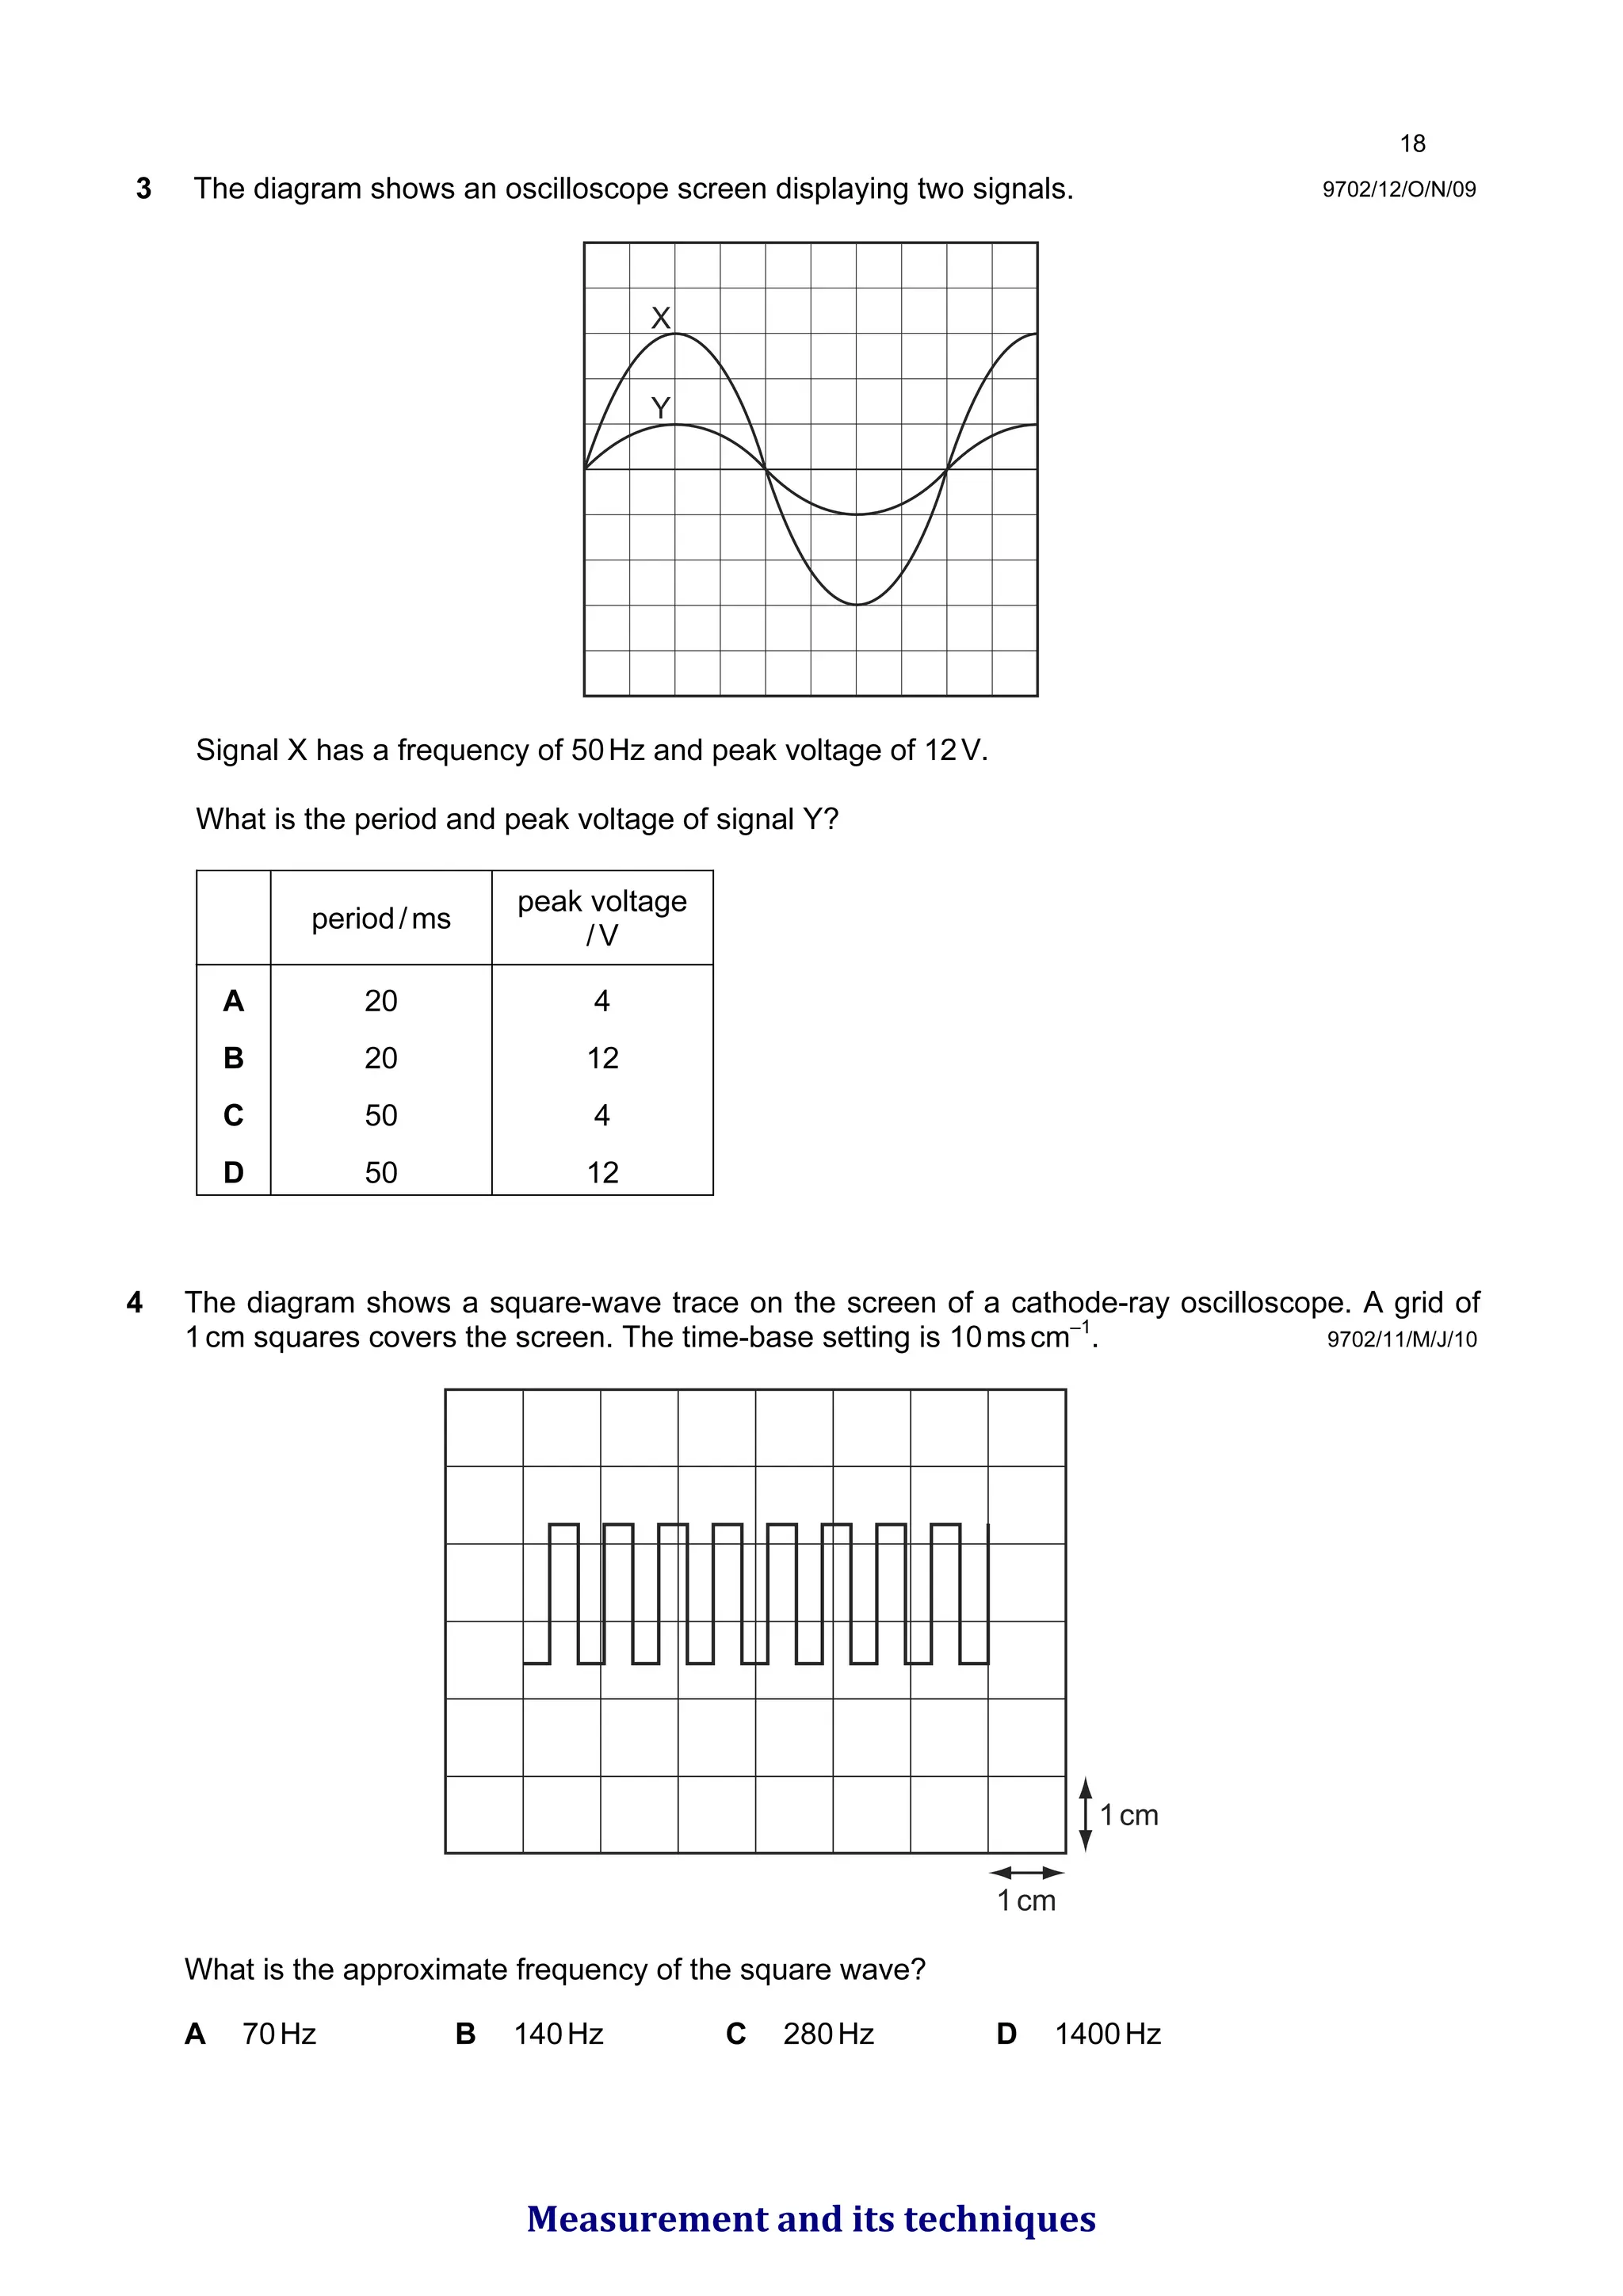
9702/12/O/N/09
3 The diagramshows an oscilloscope screen displaying two signals.
X
Y
Signal X has a frequency of 50Hz and peak voltage of 12V.
What is the period and peak voltage of signal Y?
period/ms
peak voltage
/V
A 20 4
B 20 12
C 50 4
D 50 12
9702/11/M/J/10
4 The diagram shows a square-wave trace on the screen of a cathode-ray oscilloscope. A grid of
1cm squares covers the screen. The time-base setting is 10mscm–1
.
1cm
1cm
What is the approximate frequency of the square wave?
A 70Hz B 140Hz C 280Hz D 1400Hz
Measurement and its techniques
68.
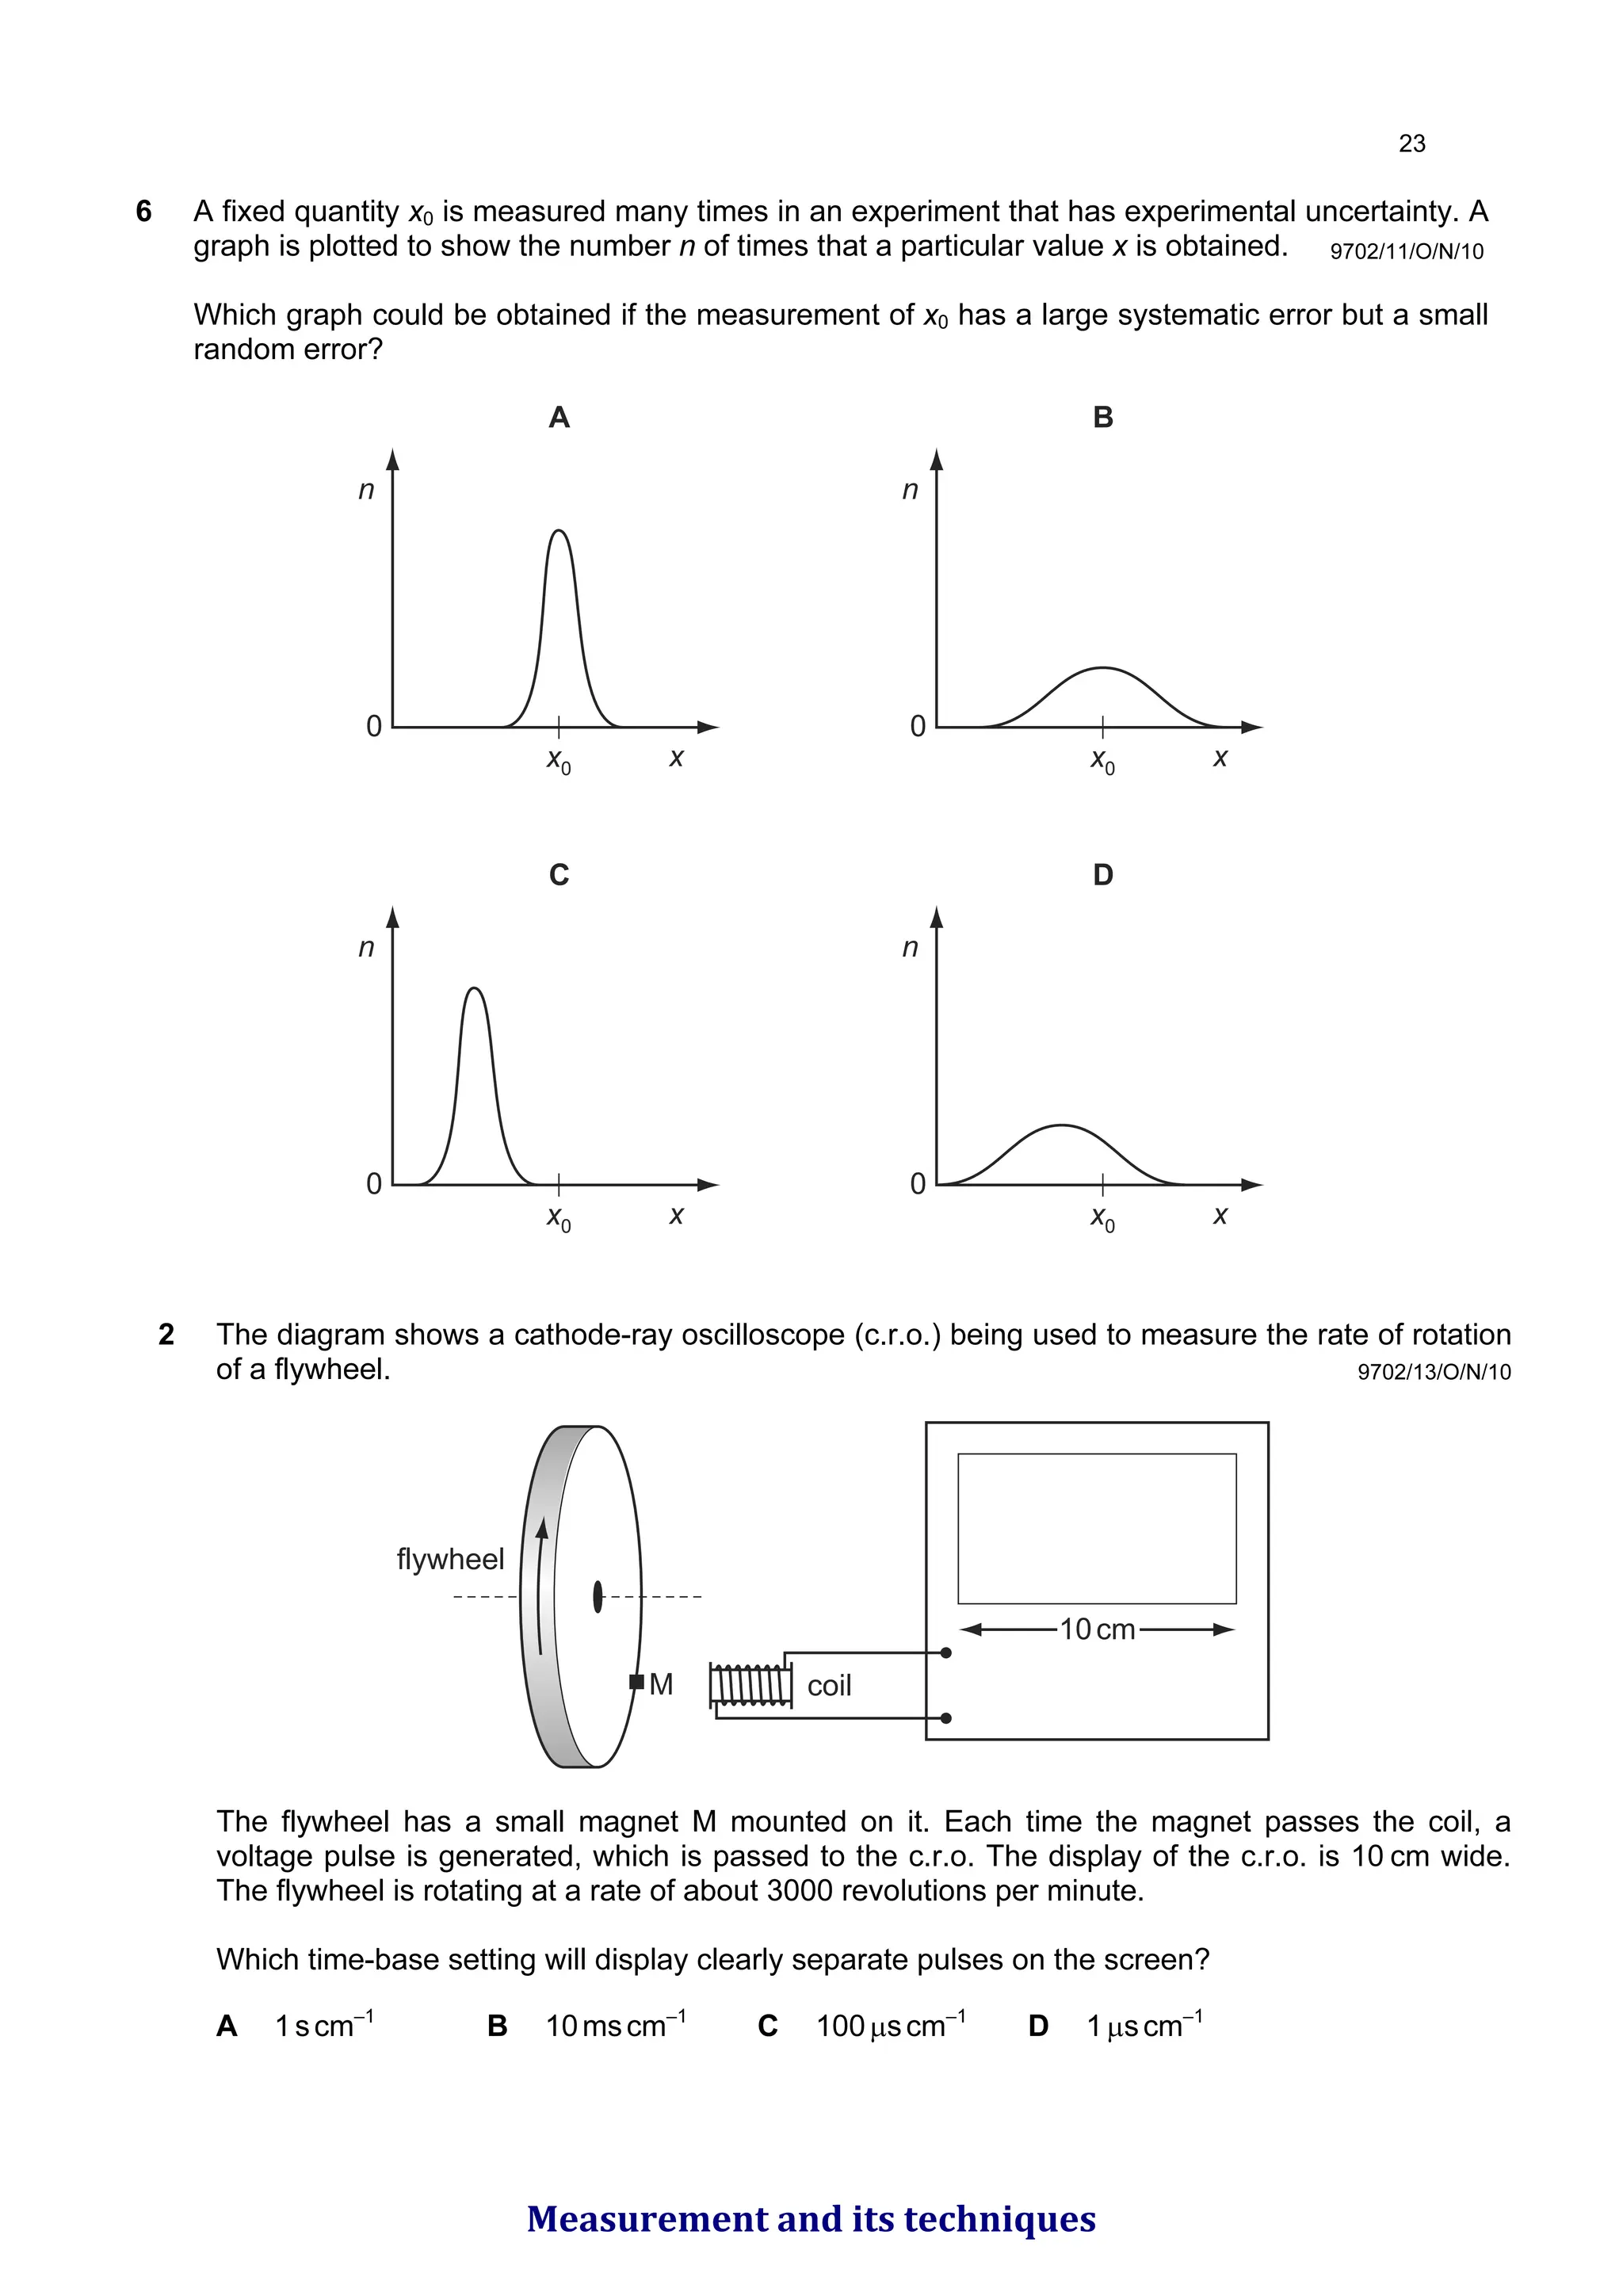
9702/11/O/N/10
6 A fixedquantity x0 is measured many times in an experiment that has experimental uncertainty. A
graph is plotted to show the number n of times that a particular value x is obtained.
Which graph could be obtained if the measurement of x0 has a large systematic error but a small
random error?
A
n
x
x0
0
B
n
x
x0
0
C
n
x
x0
0
D
n
x
x0
0
9702/13/O/N/10
2 The diagram shows a cathode-ray oscilloscope (c.r.o.) being used to measure the rate of rotation
of a flywheel.
10cm
coil
flywheel
M
The flywheel has a small magnet M mounted on it. Each time the magnet passes the coil, a
voltage pulse is generated, which is passed to the c.r.o. The display of the c.r.o. is 10 cm wide.
The flywheel is rotating at a rate of about 3000 revolutions per minute.
Which time-base setting will display clearly separate pulses on the screen?
A 1scm–1
B 10mscm–1
C 100μscm–1
D 1μscm–1
Measurement and its techniques
69.
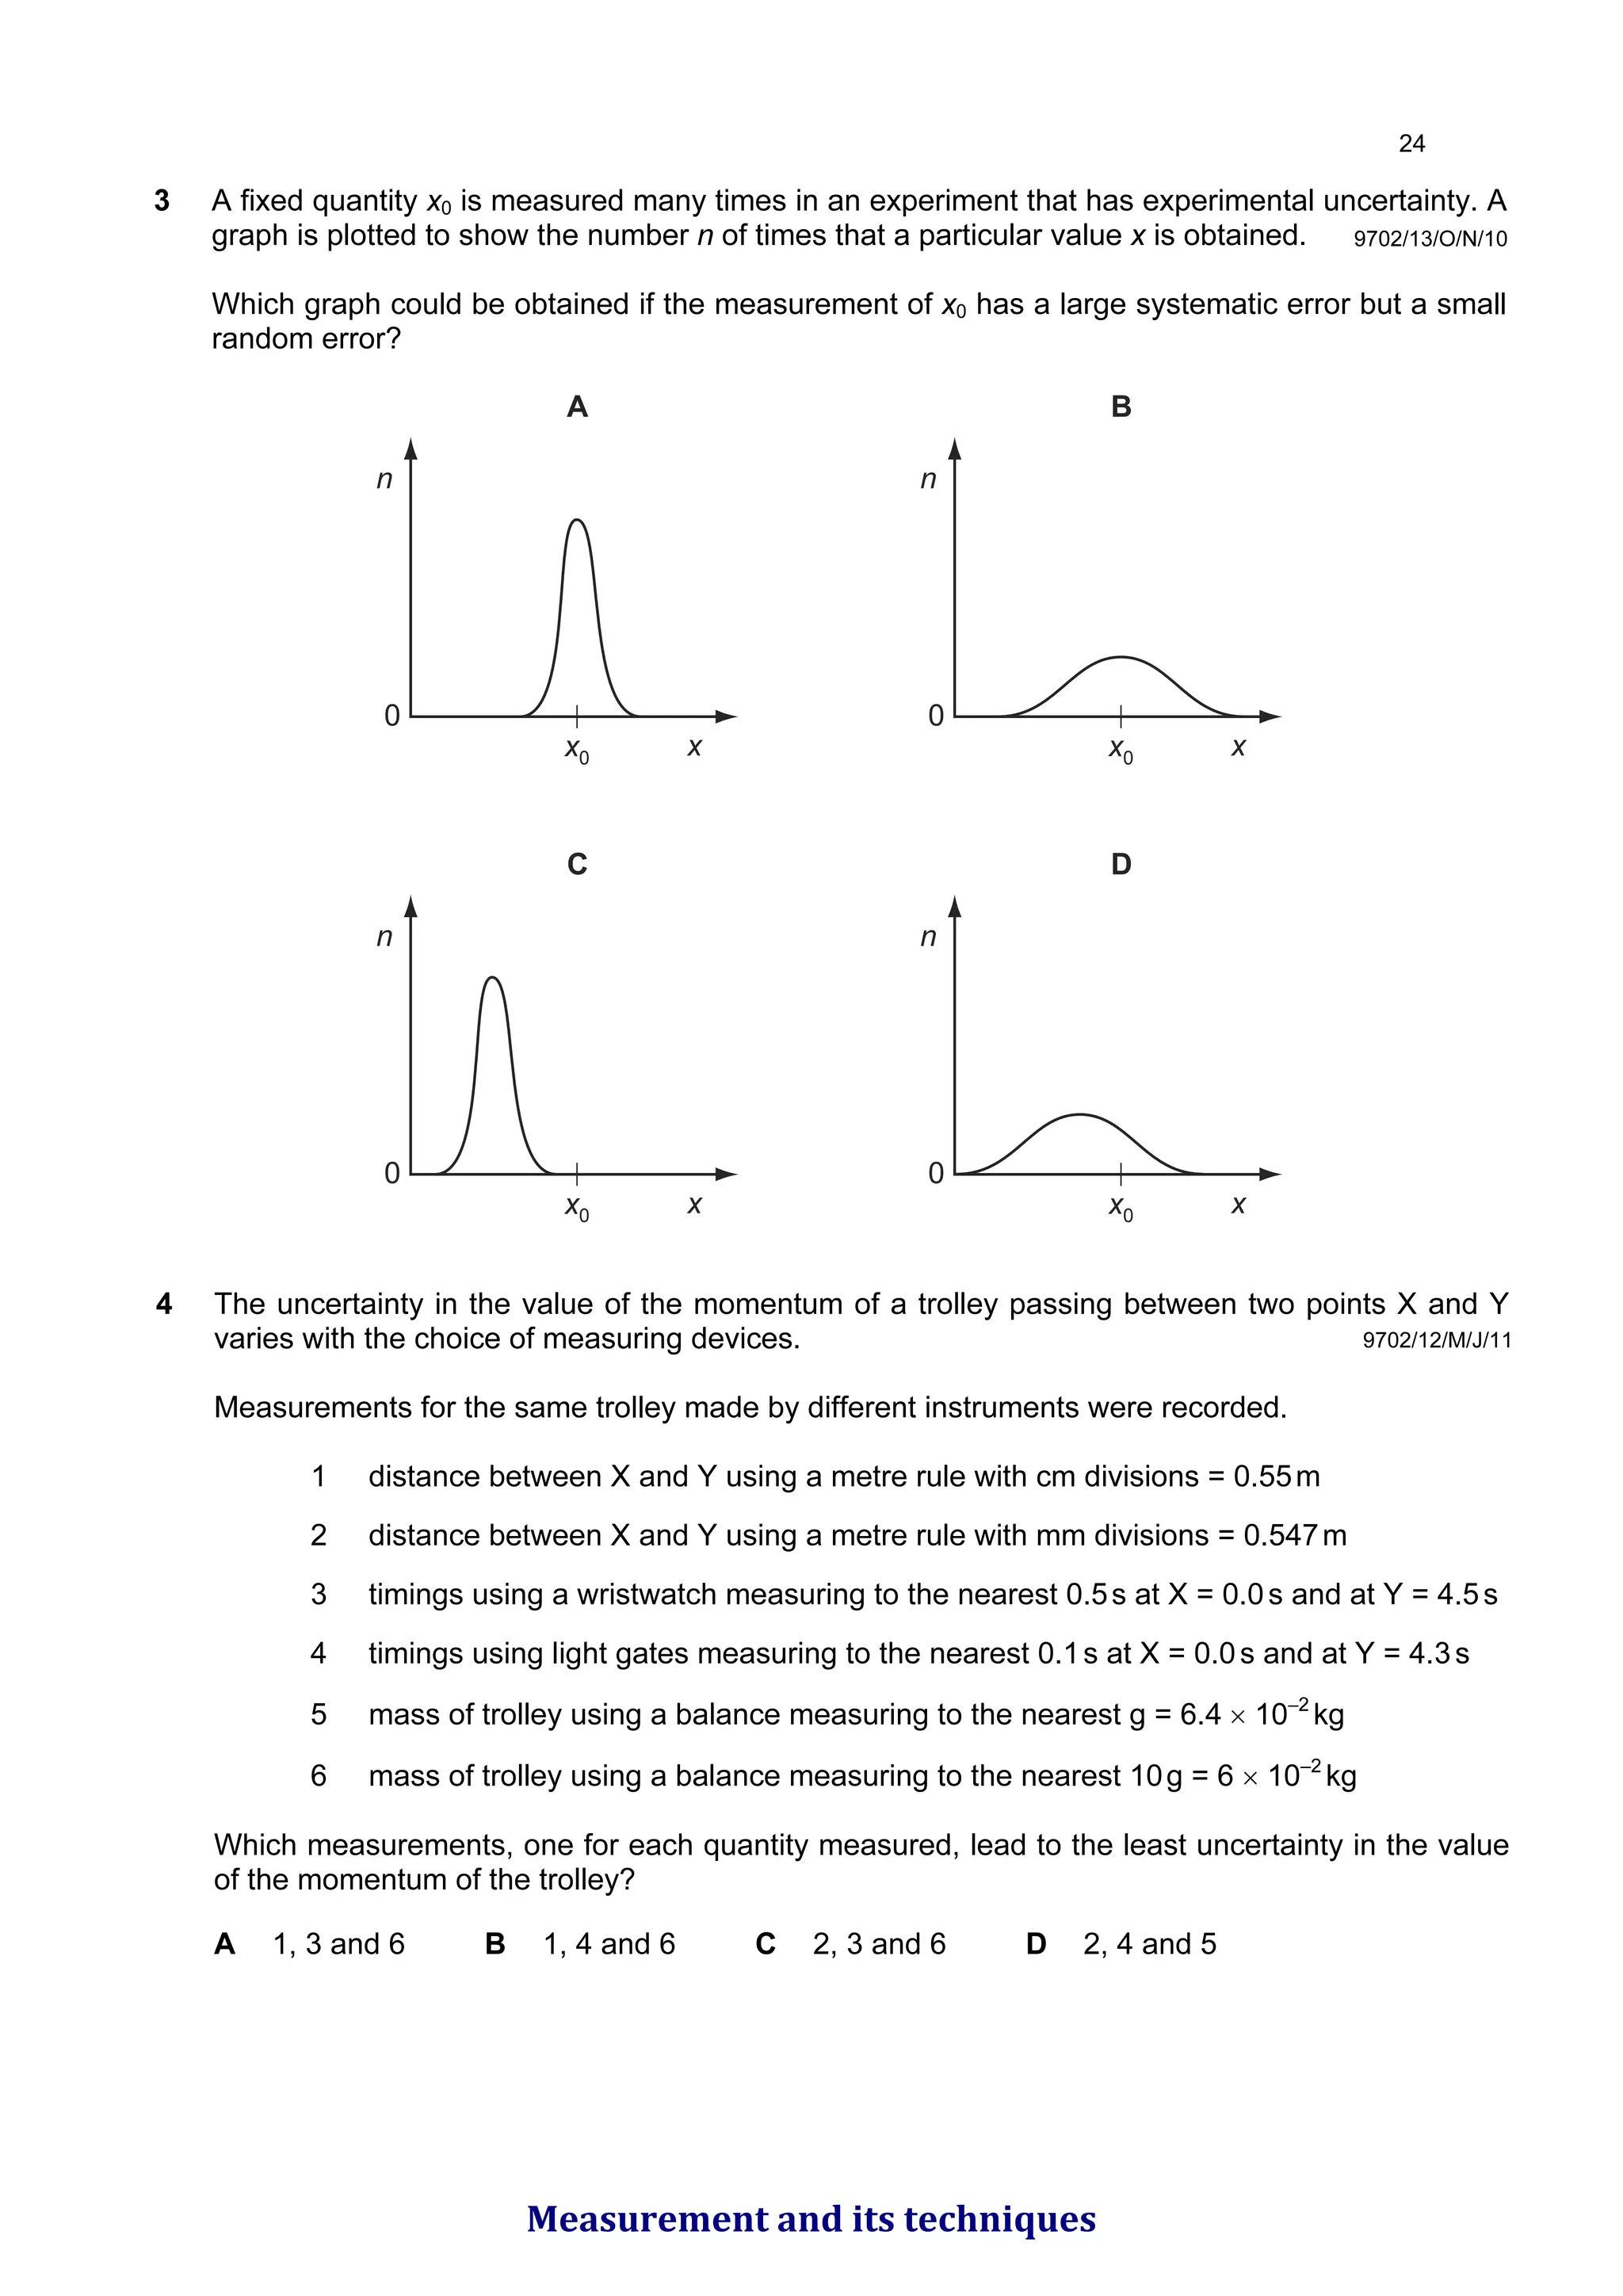
9702/13/O/N/10
3 A fixedquantity x0 is measured many times in an experiment that has experimental uncertainty. A
graph is plotted to show the number n of times that a particular value x is obtained.
Which graph could be obtained if the measurement of x0 has a large systematic error but a small
random error?
A
n
x
x0
0
B
n
x
x0
0
C
n
x
x0
0
D
n
x
x0
0
9702/12/M/J/11
4 The uncertainty in the value of the momentum of a trolley passing between two points X and Y
varies with the choice of measuring devices.
Measurements for the same trolley made by different instruments were recorded.
1 distance between X and Y using a metre rule with cm divisions = 0.55m
2 distance between X and Y using a metre rule with mm divisions = 0.547m
3 timings using a wristwatch measuring to the nearest 0.5s at X = 0.0s and at Y = 4.5s
4 timings using light gates measuring to the nearest 0.1s at X = 0.0s and at Y = 4.3s
5 mass of trolley using a balance measuring to the nearest g = 6.4 × 10⁻²
kg
6 mass of trolley using a balance measuring to the nearest 10g = 6 × 10⁻²
kg
Which measurements, one for each quantity measured, lead to the least uncertainty in the value
of the momentum of the trolley?
A 1, 3 and 6 B 1, 4 and 6 C 2, 3 and 6 D 2, 4 and 5
Measurement and its techniques
70.
9702/11/M/J/11
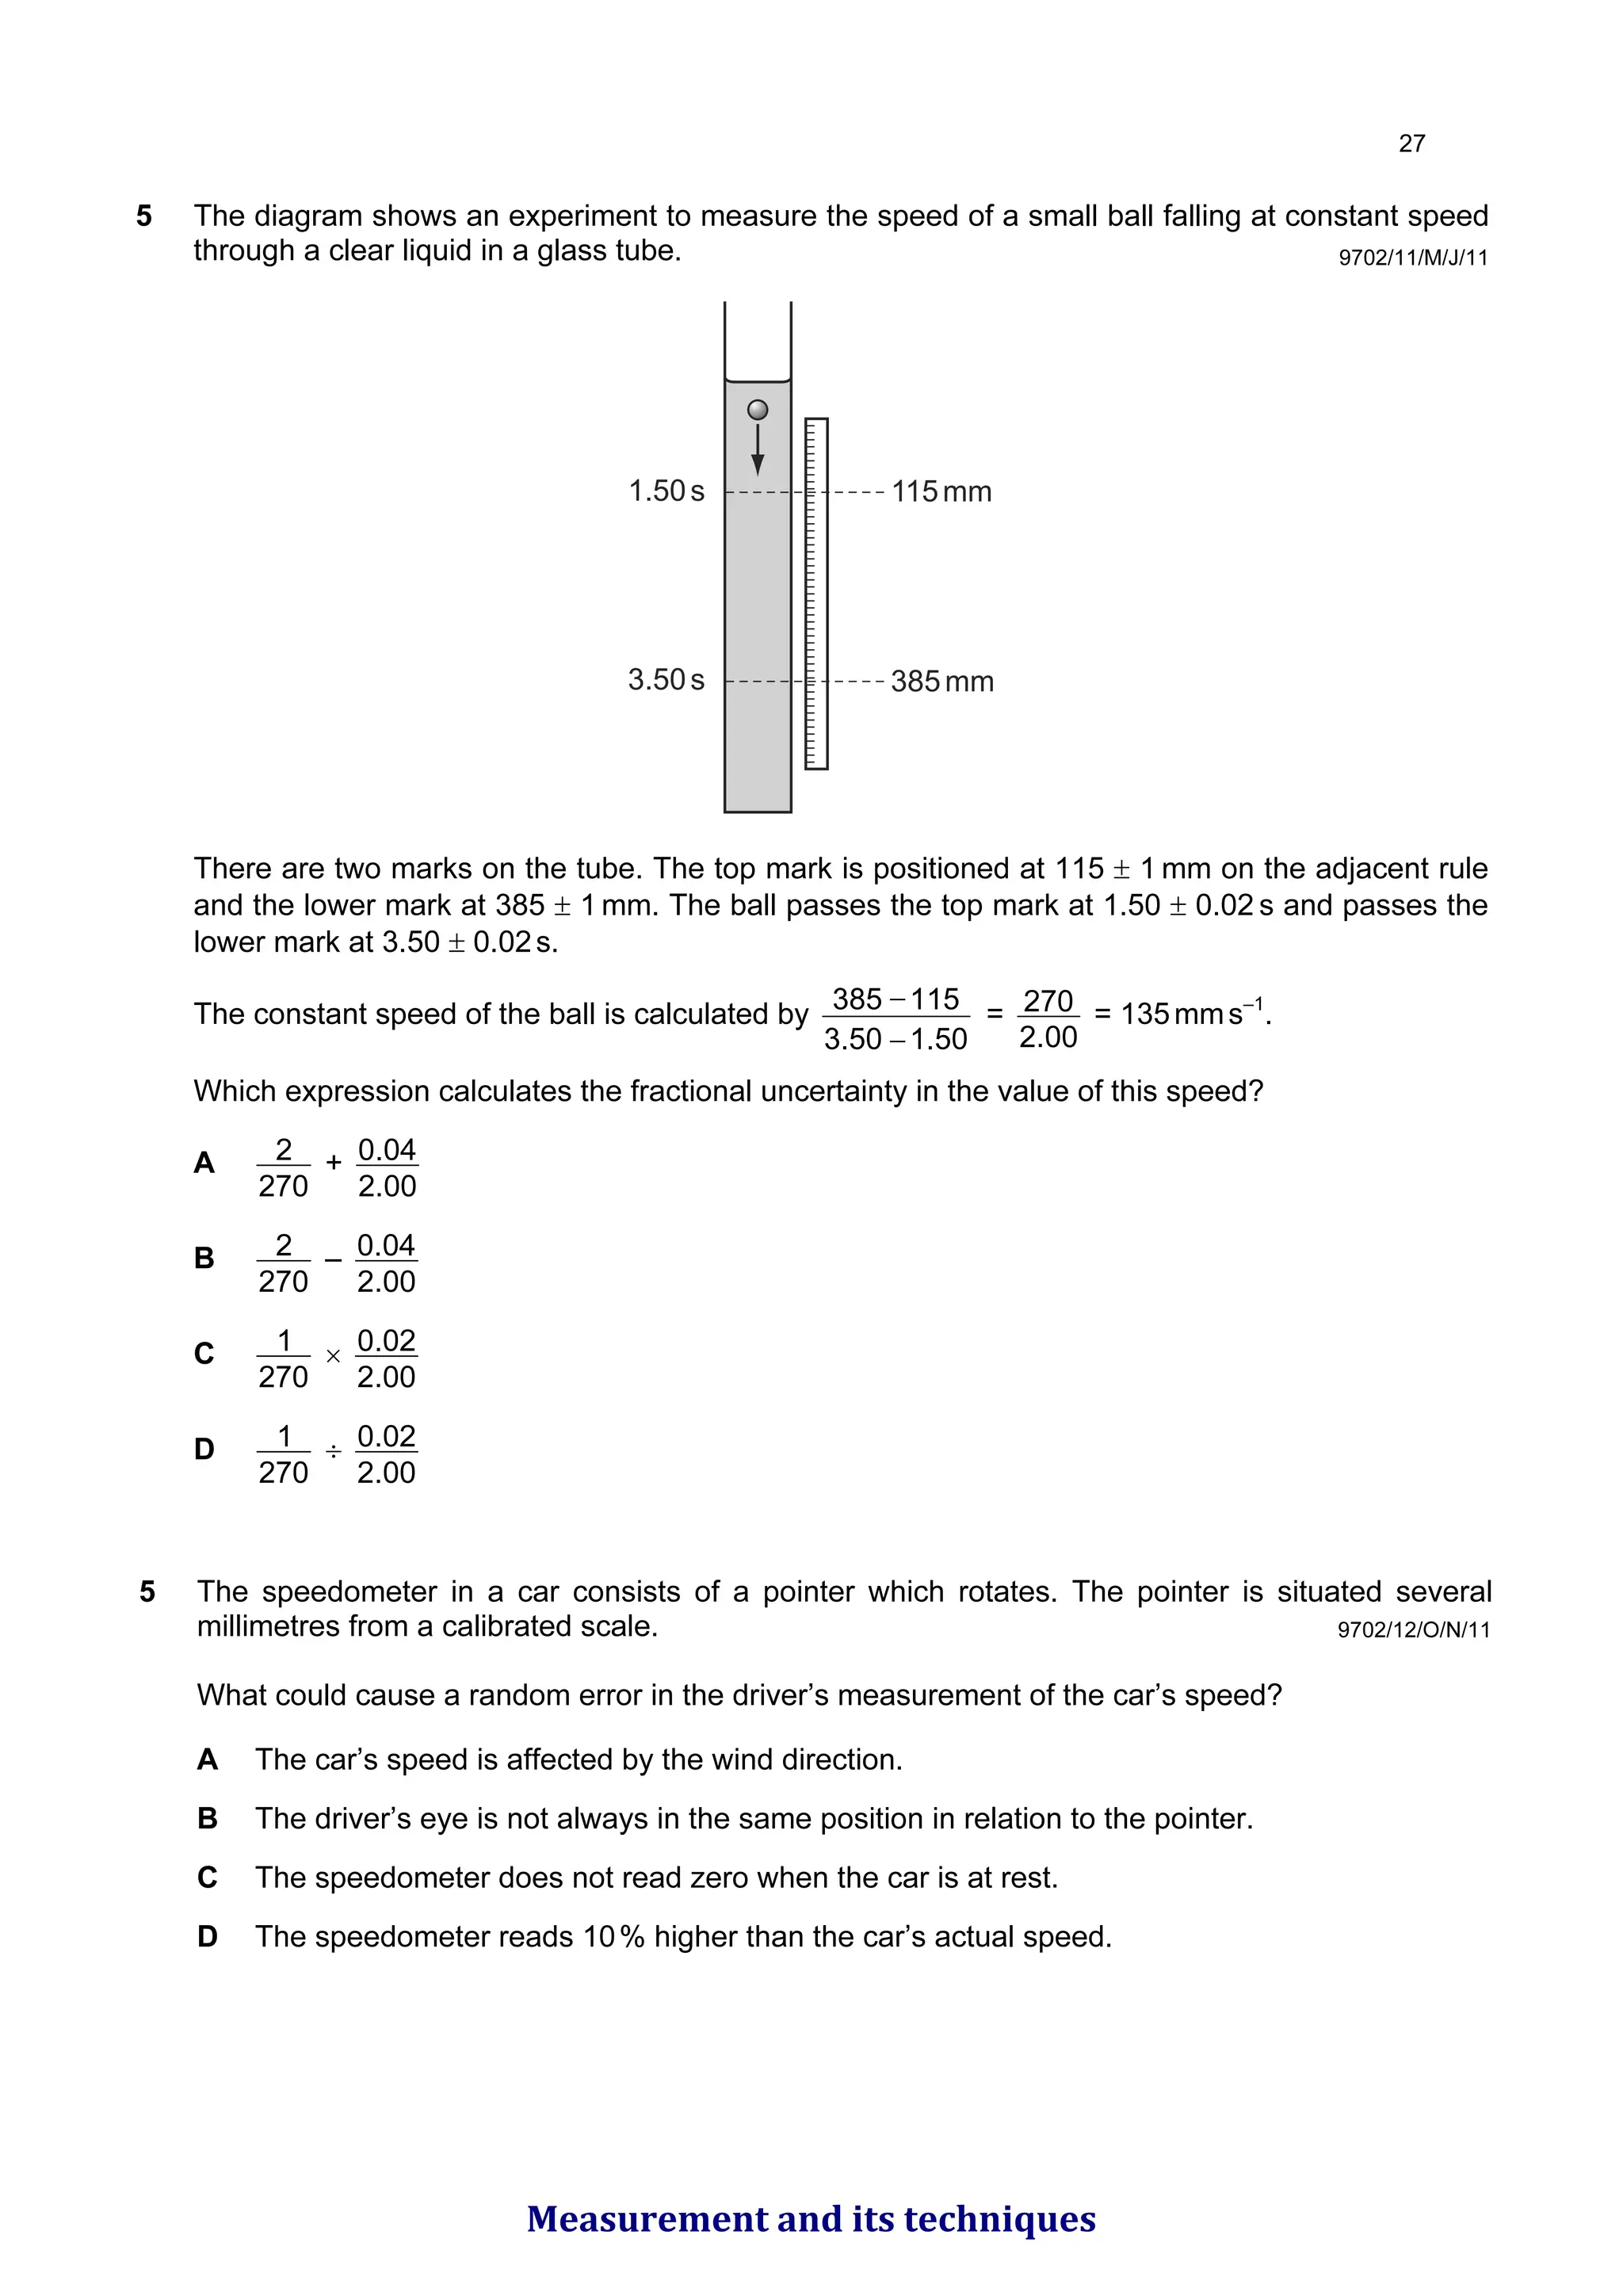
5 The diagramshows an experiment to measure the speed of a small ball falling at constant speed
through a clear liquid in a glass tube.
115mm
385mm
1.50s
3.50s
There are two marks on the tube. The top mark is positioned at 115 ± 1 mm on the adjacent rule
and the lower mark at 385 ± 1 mm. The ball passes the top mark at 1.50 ± 0.02 s and passes the
lower mark at 3.50 ± 0.02s.
The constant speed of the ball is calculated by
1.50
3.50
115
385
−
−
=
00
.
2
270 = 135mms–1
.
Which expression calculates the fractional uncertainty in the value of this speed?
A
270
2 +
00
.
2
04
.
0
B
270
2 –
00
.
2
04
.
0
C
270
1 ×
00
.
2
02
.
0
D
270
1 ÷
00
.
2
02
.
0
9702/12/O/N/11
5 The speedometer in a car consists of a pointer which rotates. The pointer is situated several
millimetres from a calibrated scale.
What could cause a random error in the driver’s measurement of the car’s speed?
A The car’s speed is affected by the wind direction.
B The driver’s eye is not always in the same position in relation to the pointer.
C The speedometer does not read zero when the car is at rest.
D The speedometer reads 10% higher than the car’s actual speed.
Measurement and its techniques
71.
9702/13/M/J/11
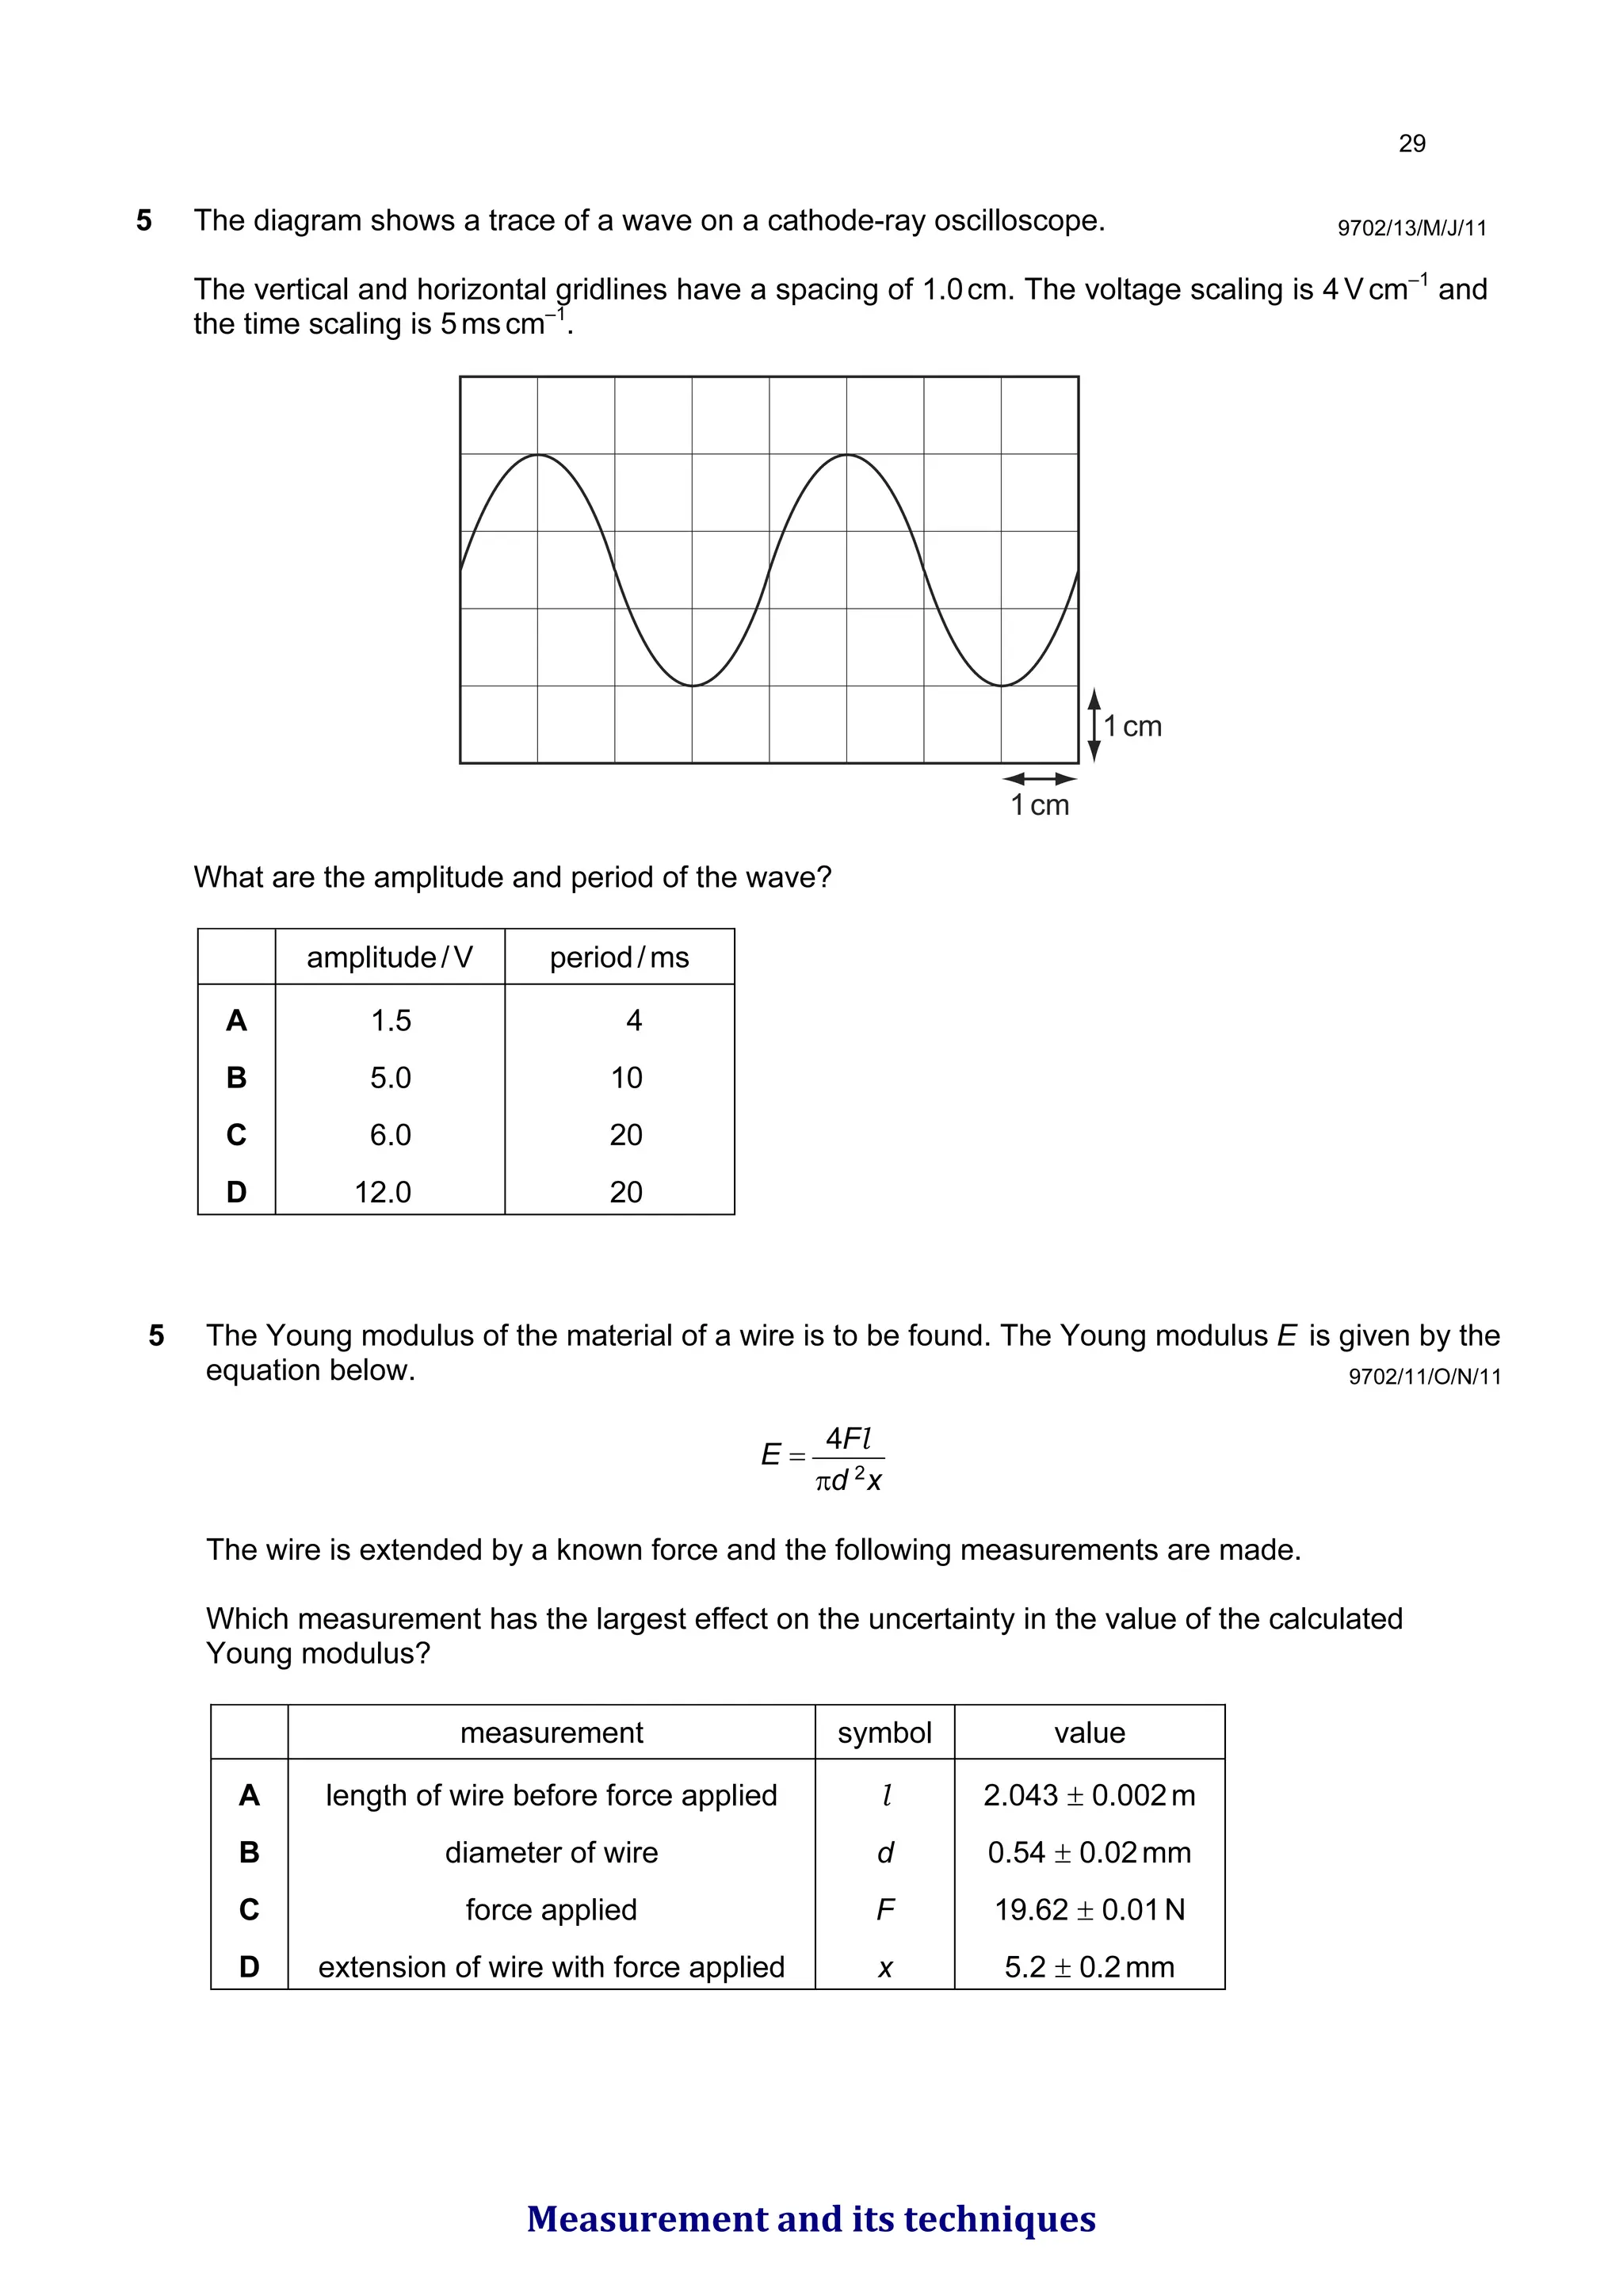
5 The diagramshows a trace of a wave on a cathode-ray oscilloscope.
The vertical and horizontal gridlines have a spacing of 1.0cm. The voltage scaling is 4V cm–1
and
the time scaling is 5mscm–1
.
1cm
1cm
What are the amplitude and period of the wave?
amplitude/V period/ms
A 1.5 4
B 5.0 10
C 6.0 20
D 12.0 20
9702/11/O/N/11
5 The Young modulus of the material of a wire is to be found. The Young modulus E is given by the
equation below.
x
d
F
E 2
4
π
=
l
The wire is extended by a known force and the following measurements are made.
Which measurement has the largest effect on the uncertainty in the value of the calculated
Young modulus?
measurement symbol value
A length of wire before force applied l 2.043 ± 0.002m
B diameter of wire d 0.54 ± 0.02mm
C force applied F 19.62 ± 0.01N
D extension of wire with force applied x 5.2 ± 0.2mm
Measurement and its techniques
72.
9702/13/M/J/12
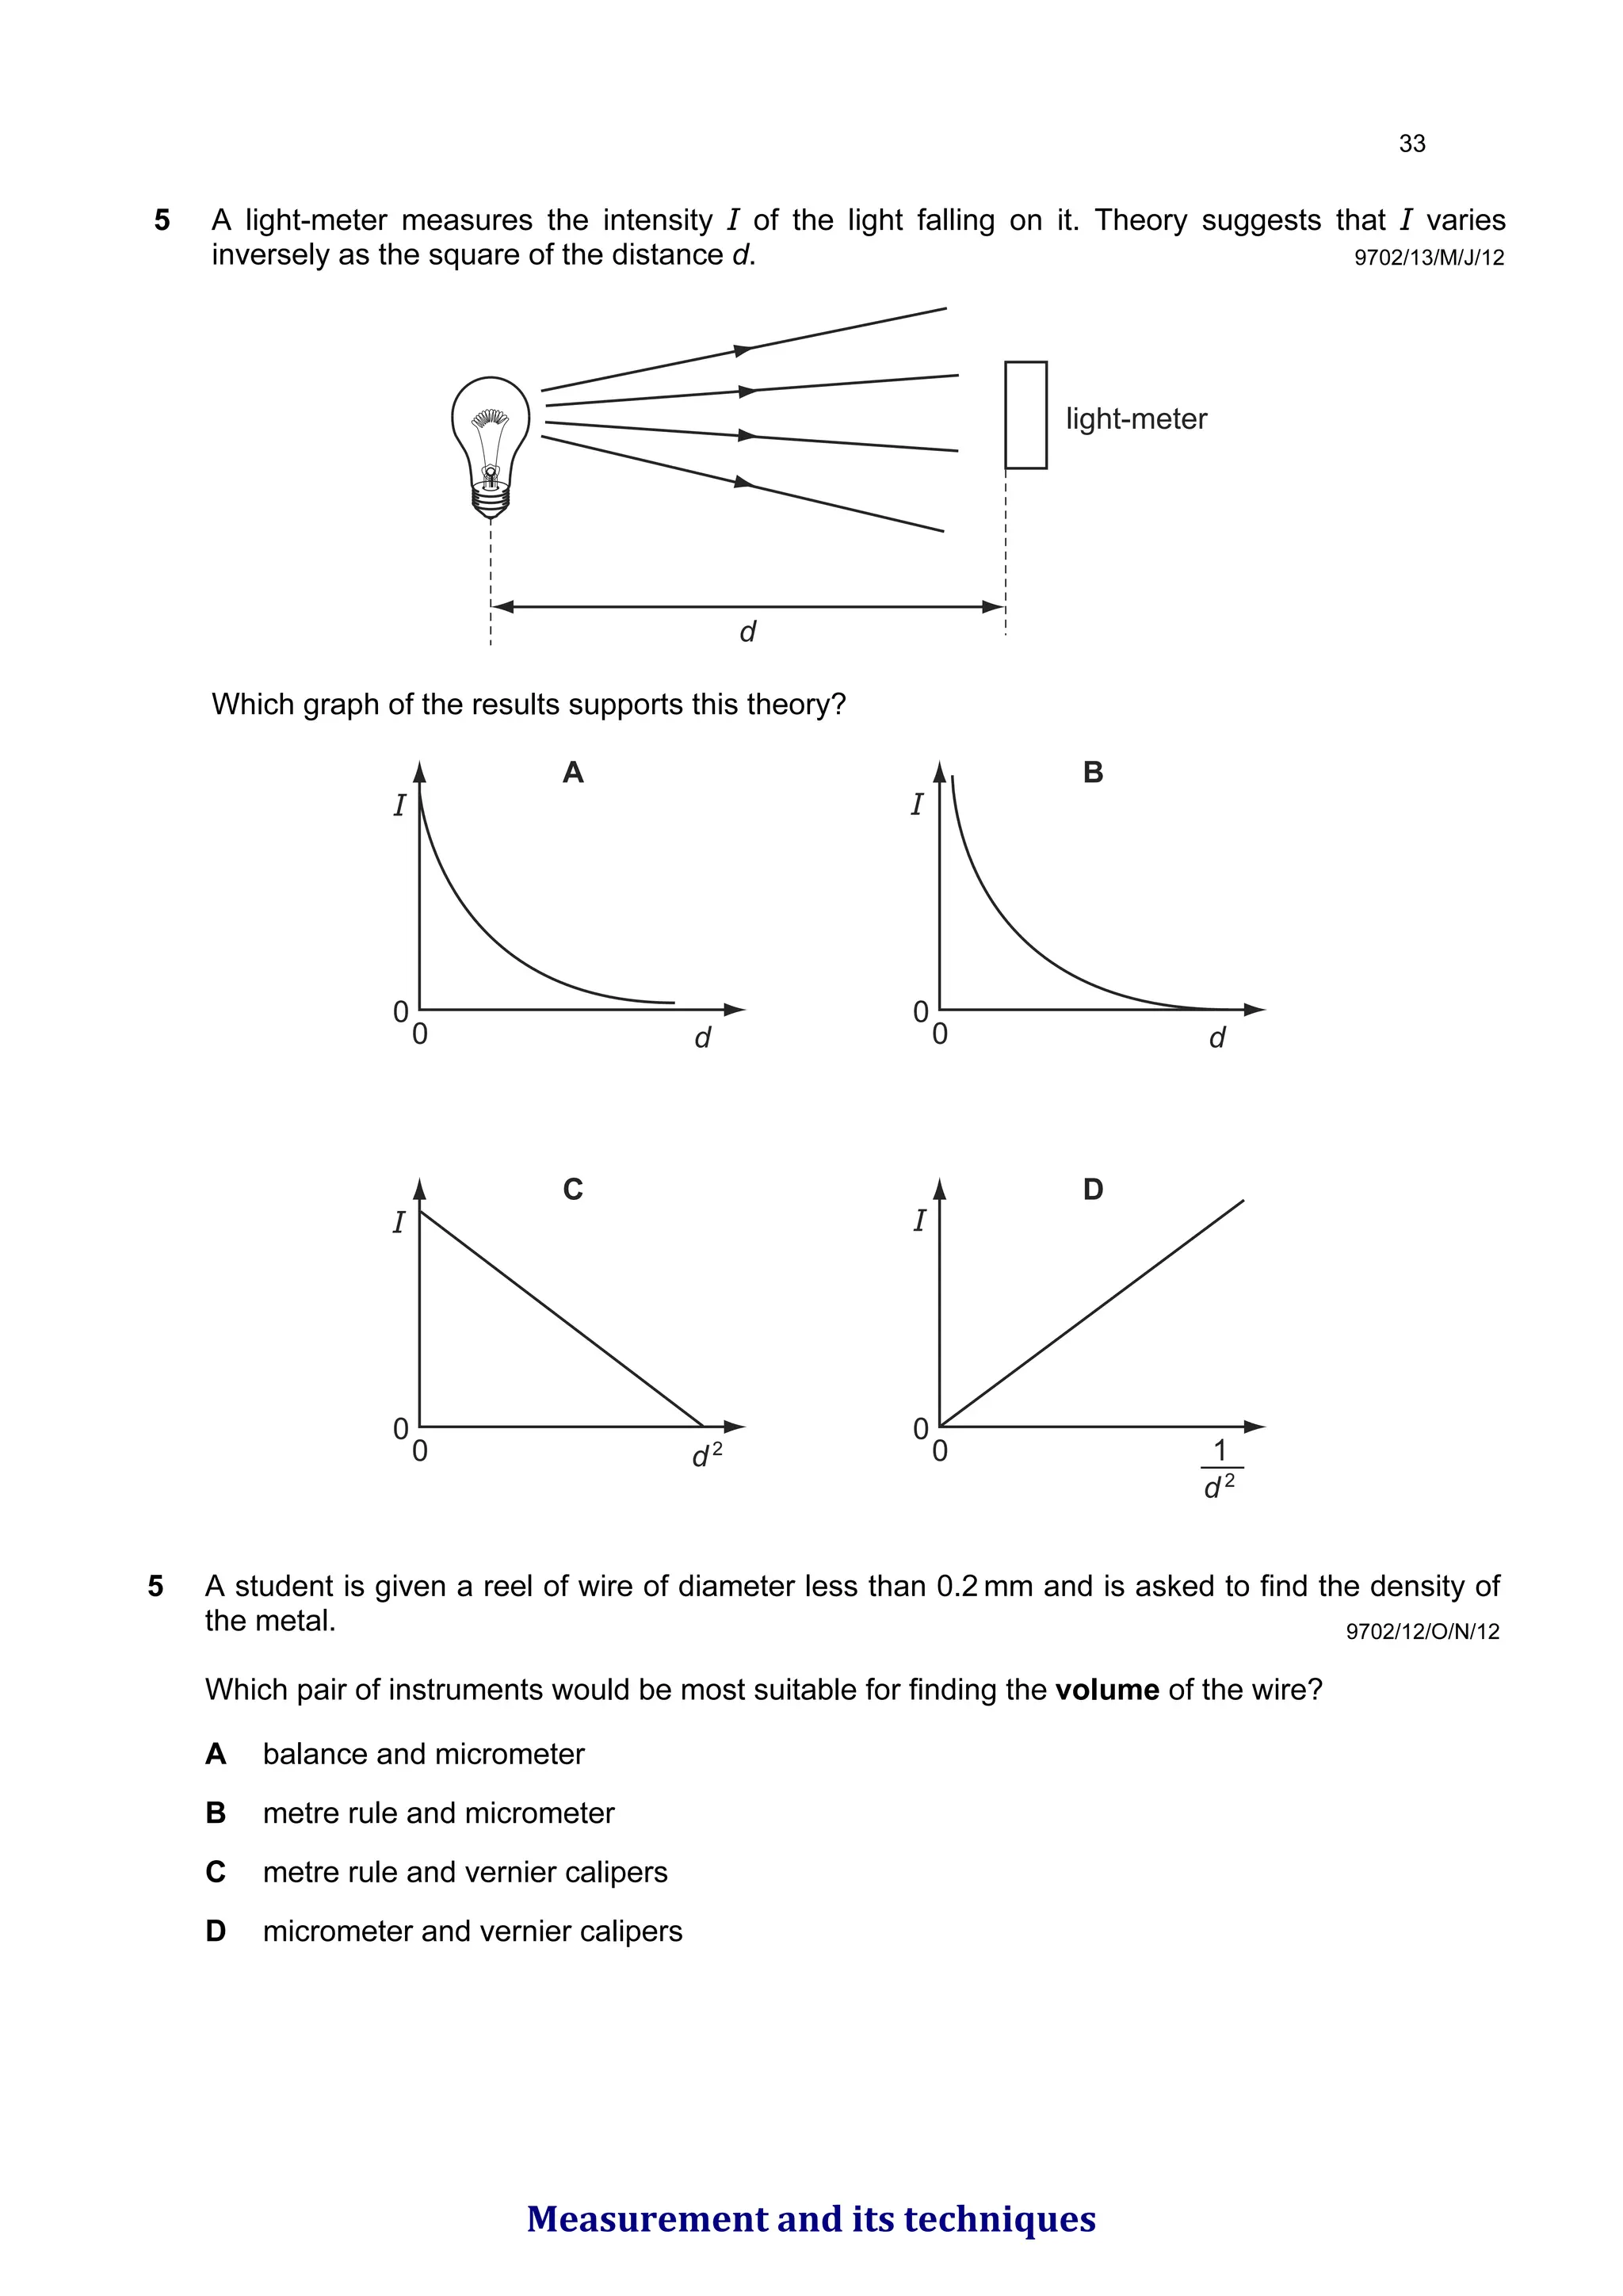
5 A light-metermeasures the intensity I of the light falling on it. Theory suggests that I varies
inversely as the square of the distance d.
light-meter
d
Which graph of the results supports this theory?
d
I
0
A
d
I
0
B
d2
I
0
C
1
d 2
I
0
0 0
0 0
D
5 A student is given a reel of wire of diameter less than 0.2 mm and is asked to find the density of
the metal.
Which pair of instruments would be most suitable for finding the volume of the wire?
A balance and micrometer
B metre rule and micrometer
C metre rule and vernier calipers
D micrometer and vernier calipers
9702/12/O/N/12
Measurement and its techniques
73.
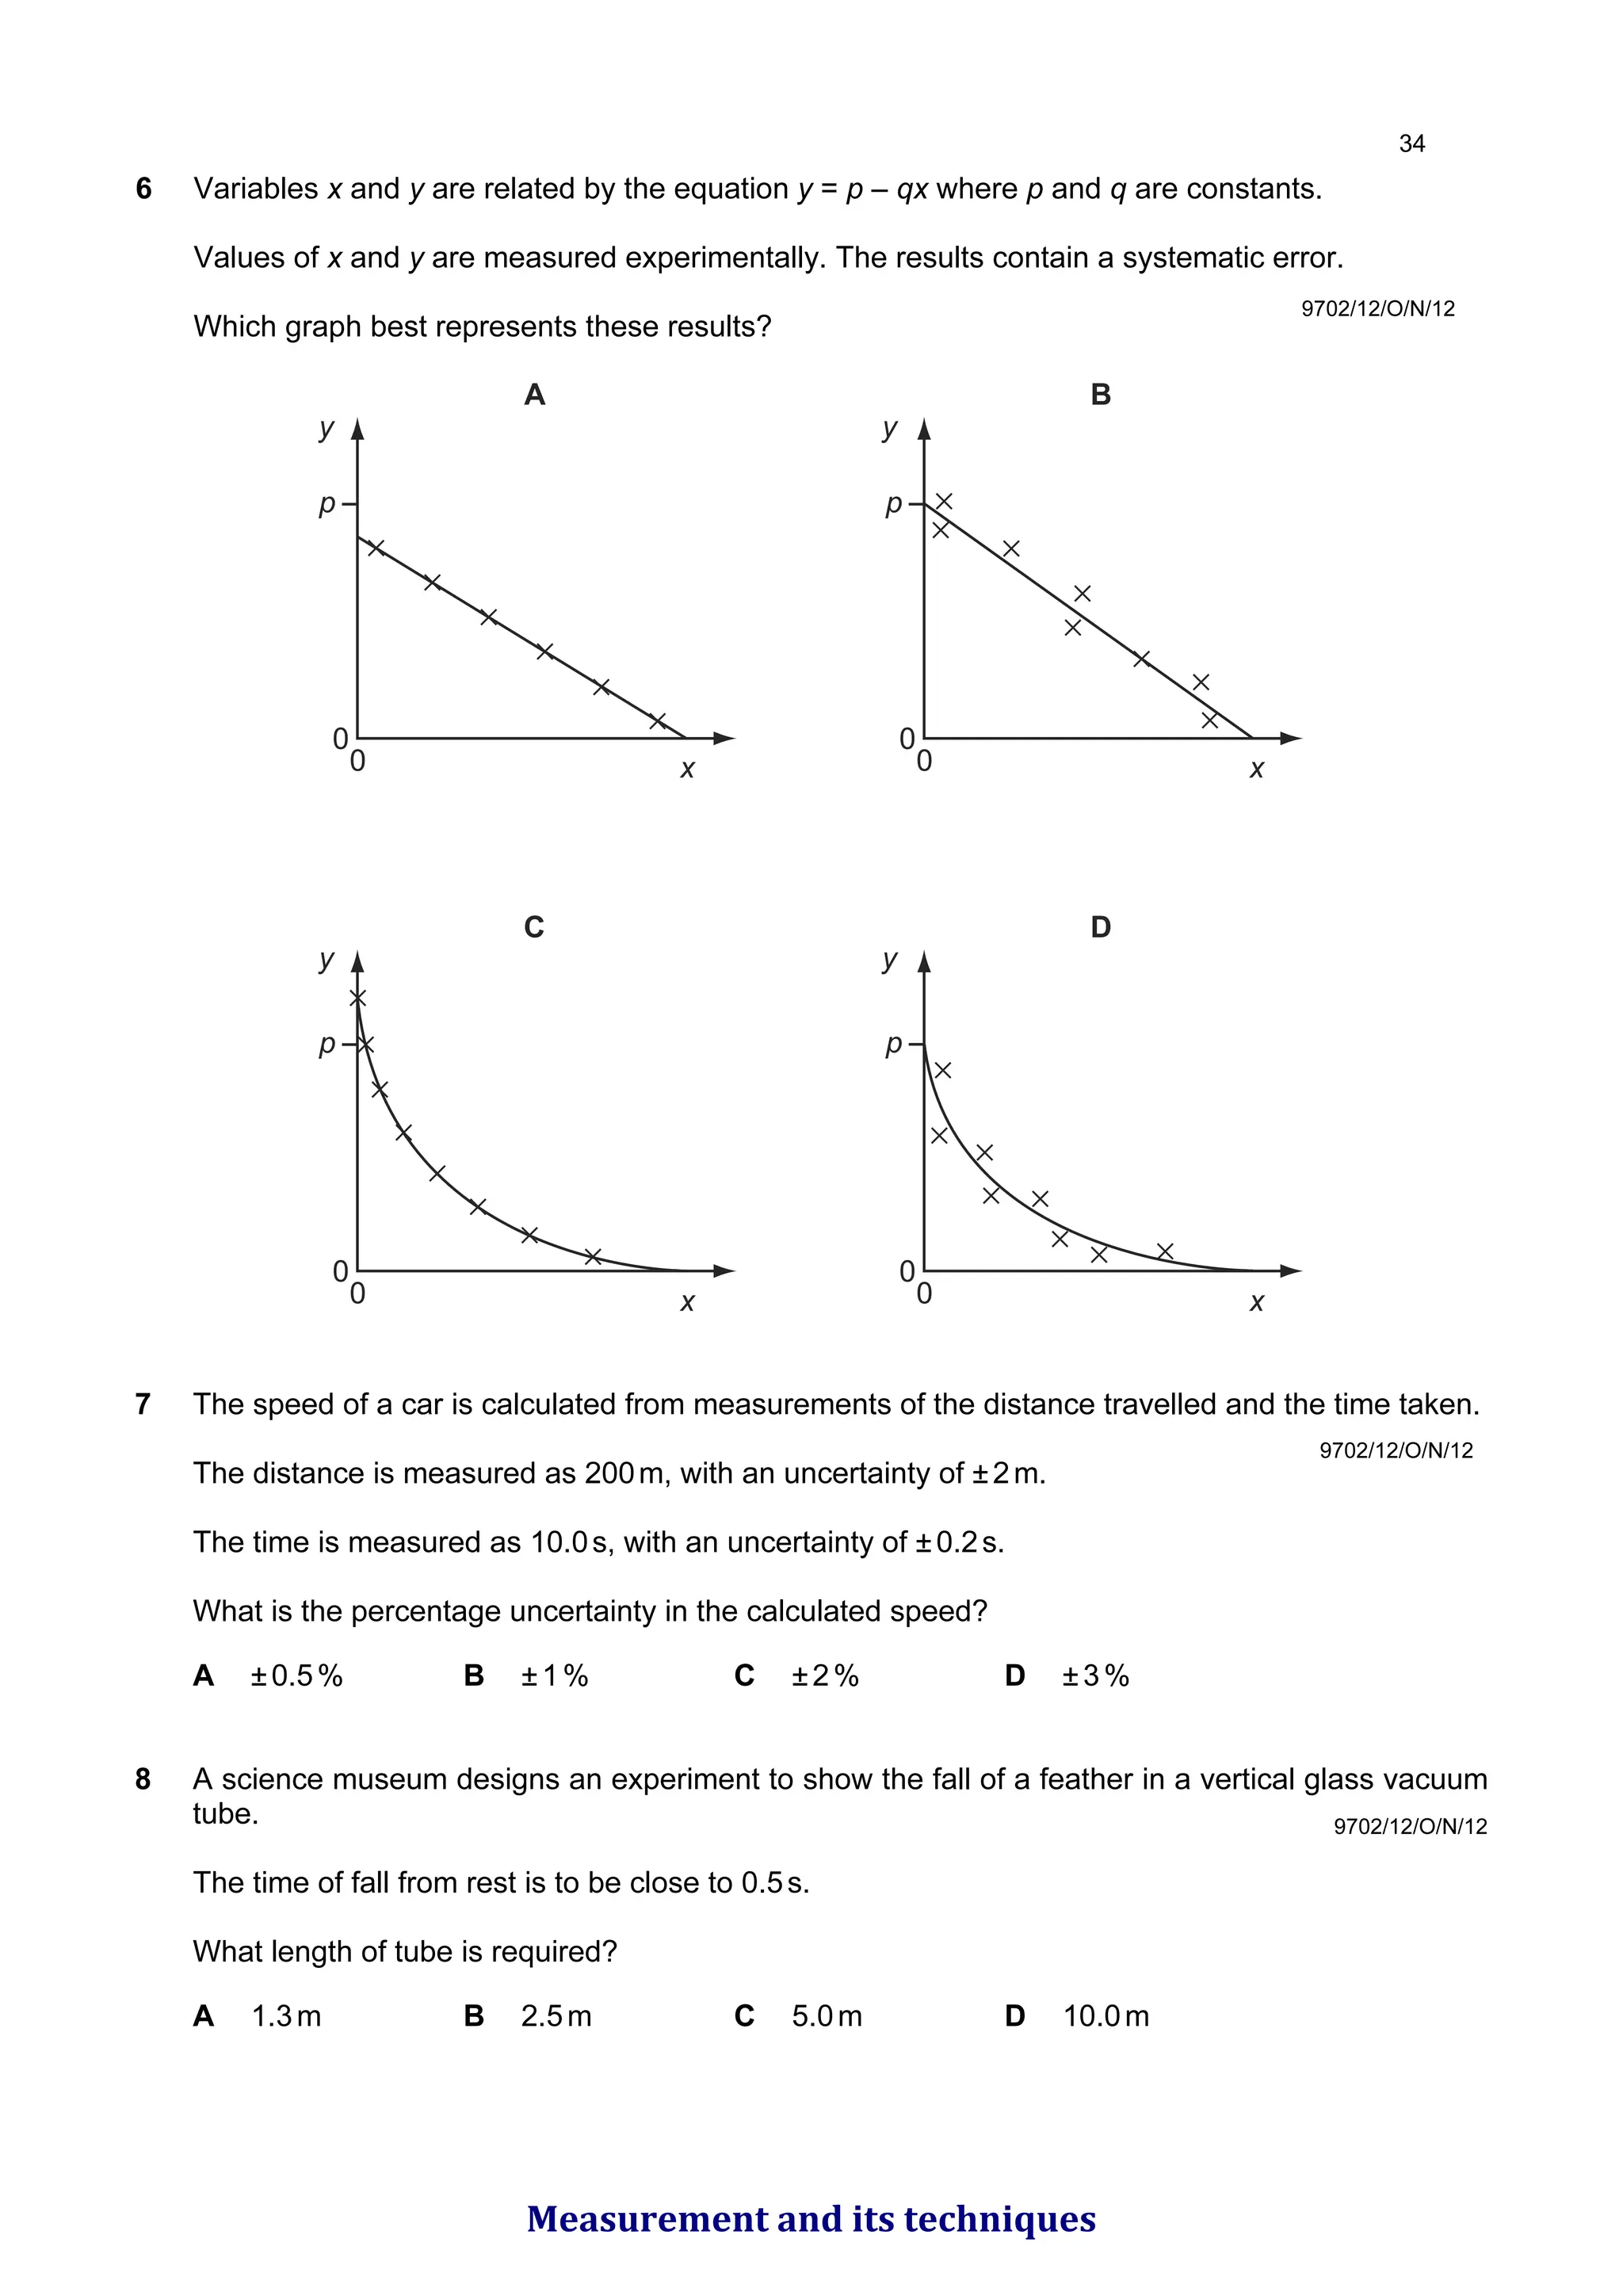
6 Variables xand y are related by the equation y = p – qx where p and q are constants.
Values of x and y are measured experimentally. The results contain a systematic error.
Which graph best represents these results?
A
p
0
0
y
x
B
p
0
0
y
x
C
p
0
0
y
x
D
p
0
0
y
x
9702/12/O/N/12
7 The speed of a car is calculated from measurements of the distance travelled and the time taken.
The distance is measured as 200m, with an uncertainty of ±2m.
The time is measured as 10.0s, with an uncertainty of ±0.2s.
What is the percentage uncertainty in the calculated speed?
A ±0.5% B ±1% C ±2% D ±3%
8 A science museum designs an experiment to show the fall of a feather in a vertical glass vacuum
tube.
The time of fall from rest is to be close to 0.5s.
What length of tube is required?
A 1.3m B 2.5m C 5.0m D 10.0m
9702/12/O/N/12
9702/12/O/N/12
Measurement and its techniques
74.
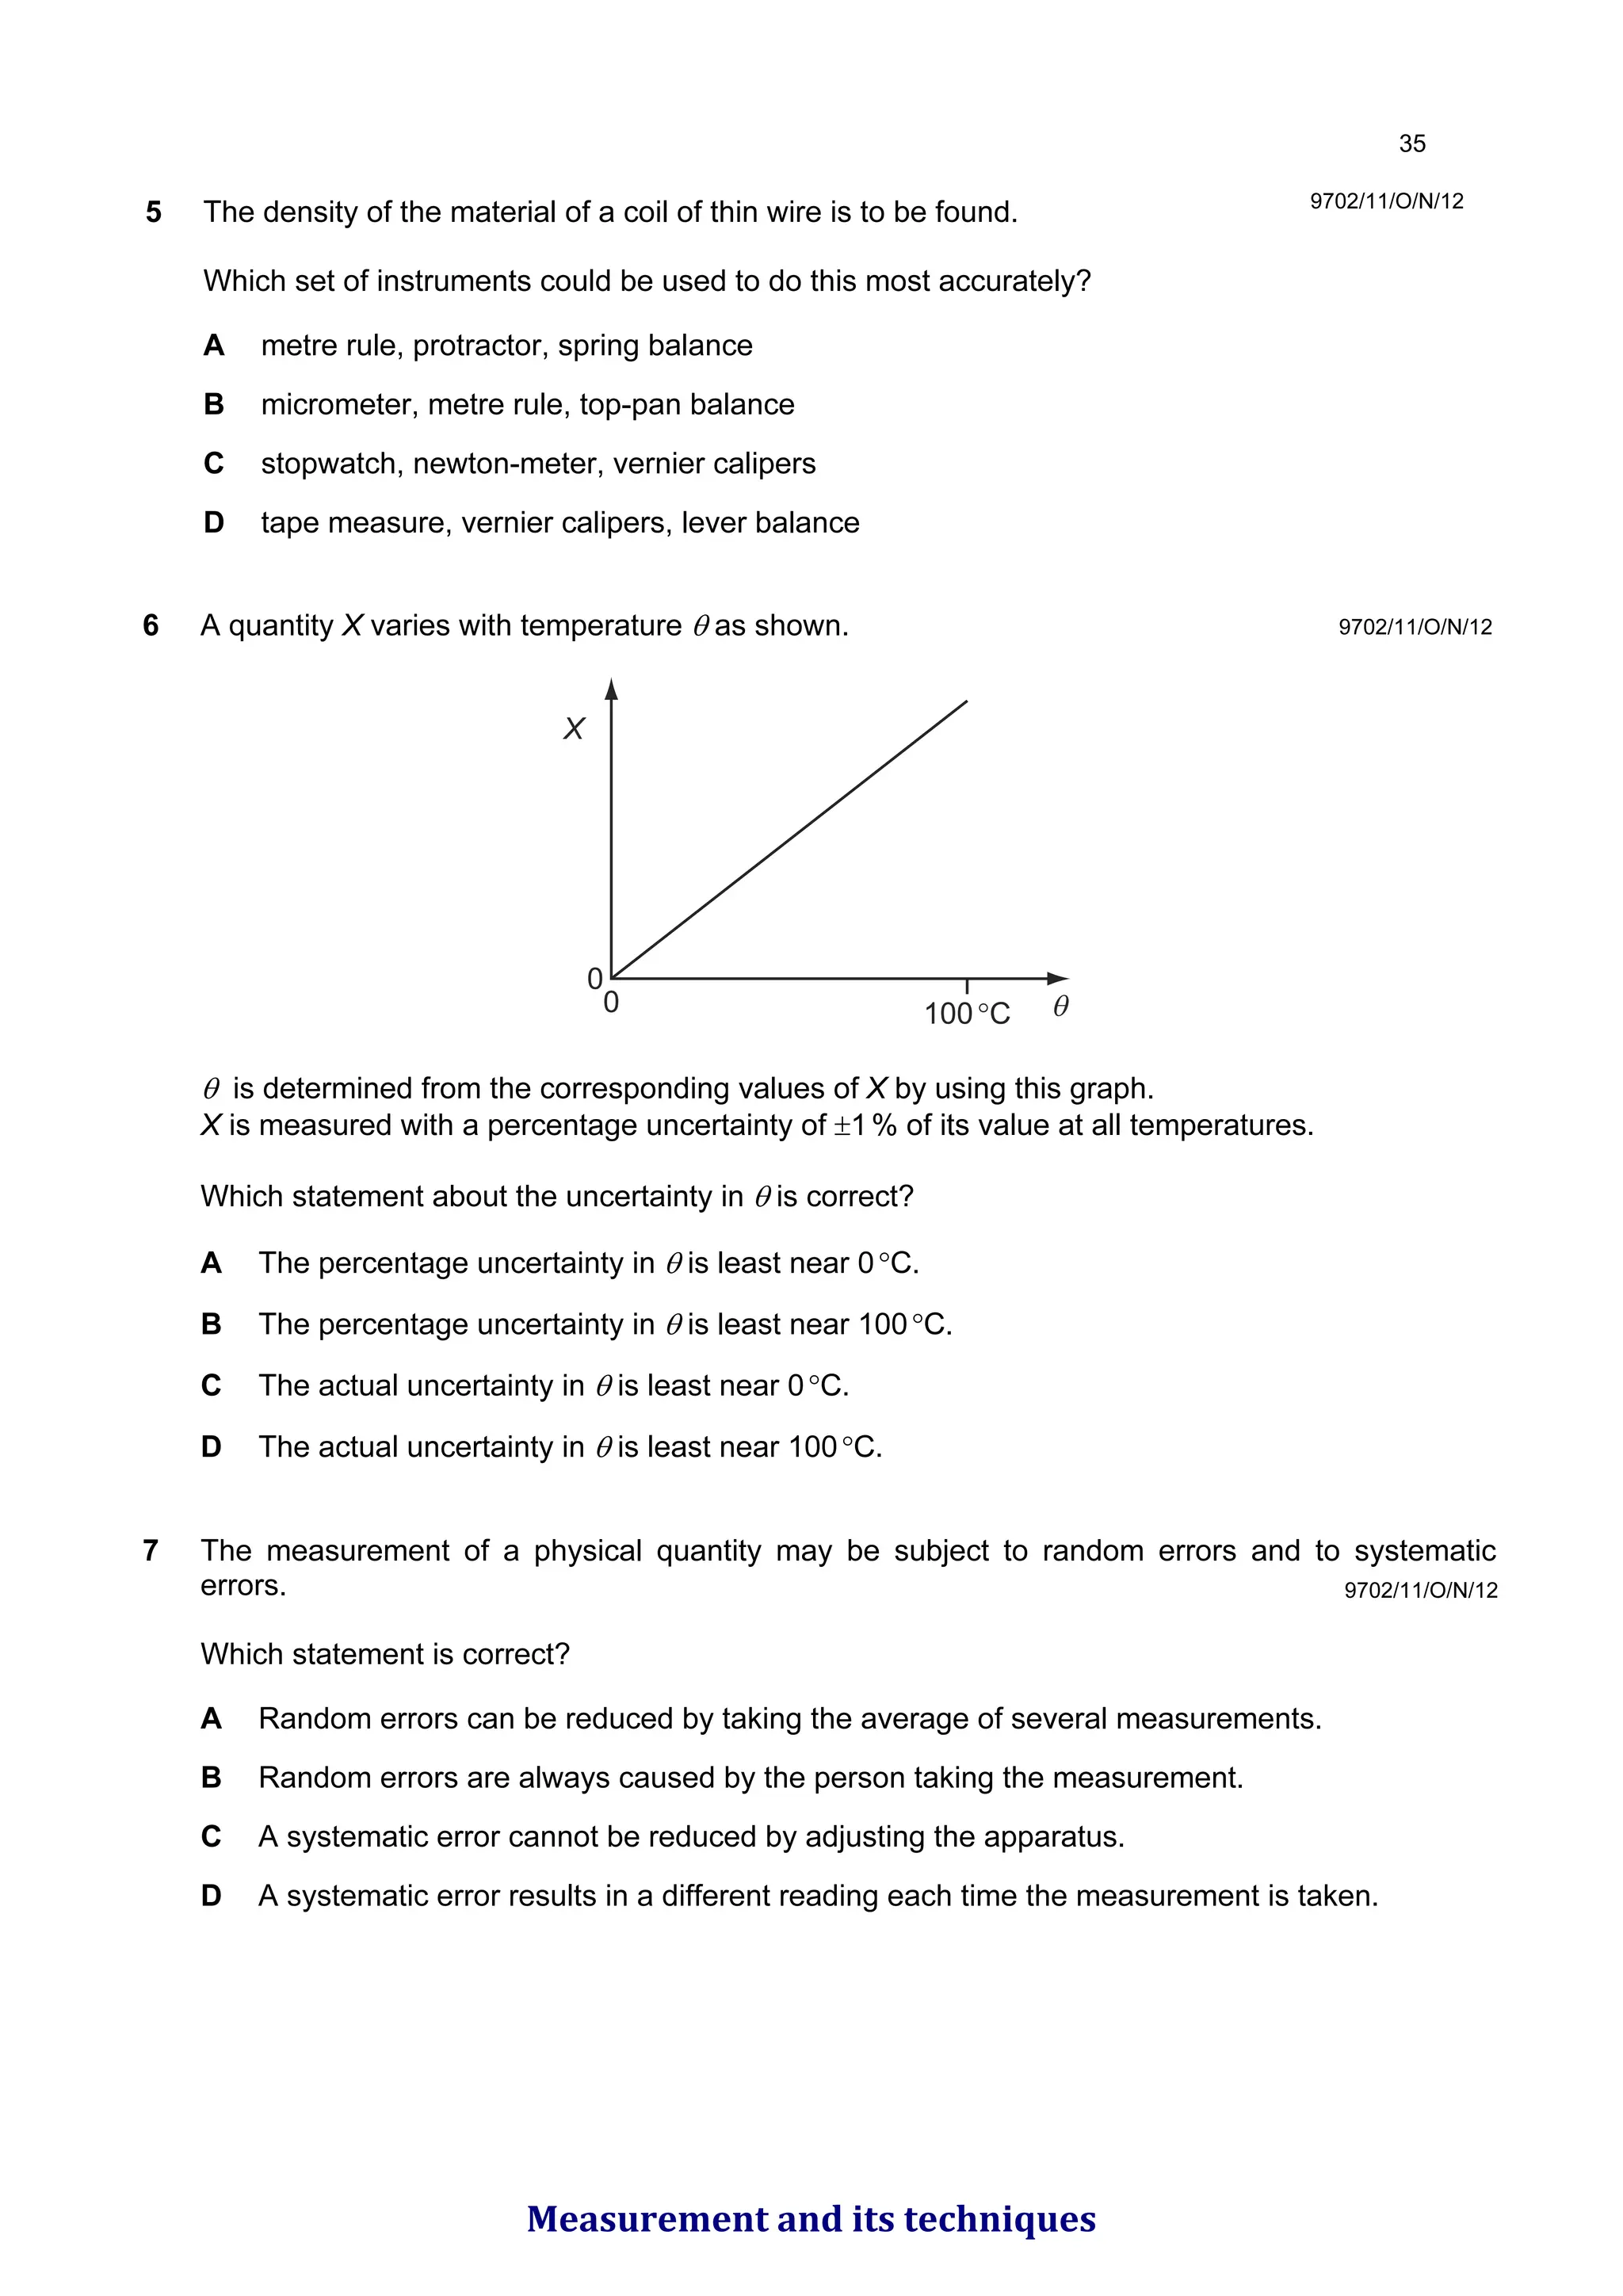
5 The densityof the material of a coil of thin wire is to be found.
Which set of instruments could be used to do this most accurately?
A metre rule, protractor, spring balance
B micrometer, metre rule, top-pan balance
C stopwatch, newton-meter, vernier calipers
D tape measure, vernier calipers, lever balance
9702/11/O/N/12
6 A quantity X varies with temperature θ as shown.
0
0
X
θ
100°C
θ is determined from the corresponding values of X by using this graph.
X is measured with a percentage uncertainty of ±1% of its value at all temperatures.
Which statement about the uncertainty in θ is correct?
A The percentage uncertainty in θ is least near 0°C.
B The percentage uncertainty in θ is least near 100°C.
C The actual uncertainty in θ is least near 0°C.
D The actual uncertainty in θ is least near 100°C.
7 The measurement of a physical quantity may be subject to random errors and to systematic
errors.
Which statement is correct?
A Random errors can be reduced by taking the average of several measurements.
B Random errors are always caused by the person taking the measurement.
C A systematic error cannot be reduced by adjusting the apparatus.
D A systematic error results in a different reading each time the measurement is taken.
9702/11/O/N/12
9702/11/O/N/12
Measurement and its techniques
75.
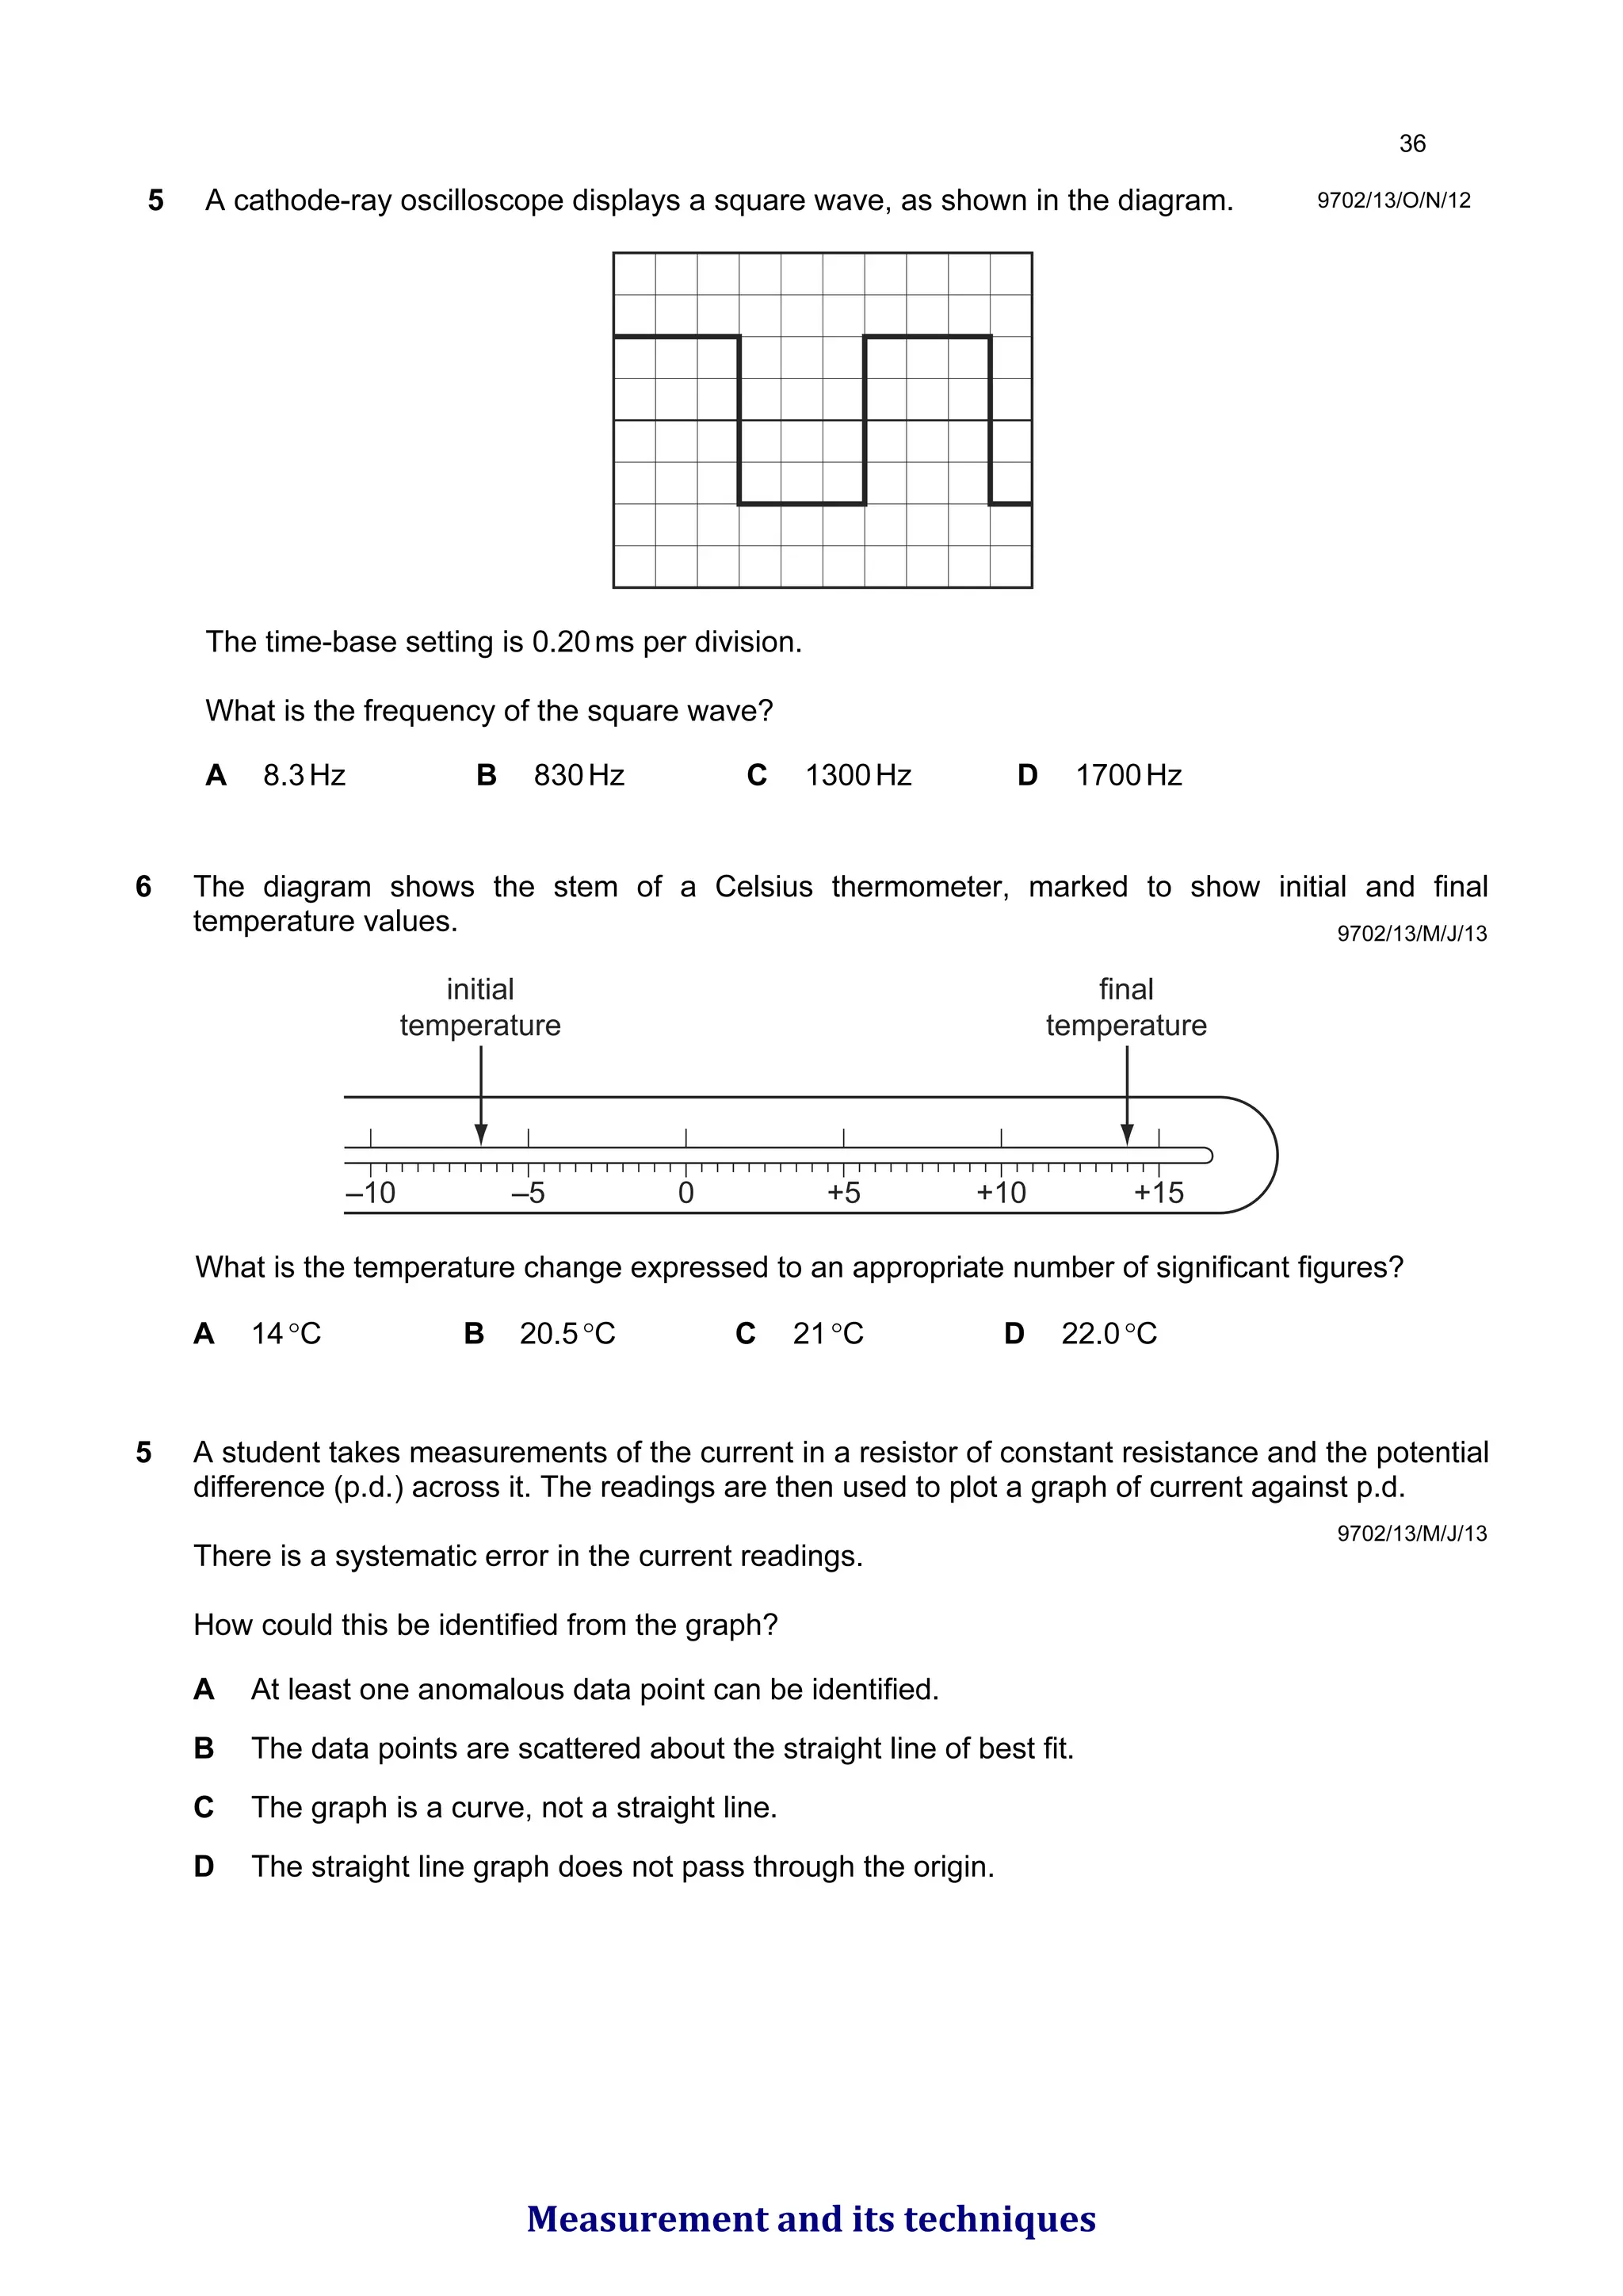
5 A cathode-rayoscilloscope displays a square wave, as shown in the diagram.
The time-base setting is 0.20ms per division.
What is the frequency of the square wave?
A 8.3Hz B 830Hz C 1300Hz D 1700Hz
9702/13/O/N/12
6 The diagram shows the stem of a Celsius thermometer, marked to show initial and final
temperature values.
–10 –5 0 +5 +10 +15
initial
temperature
final
temperature
What is the temperature change expressed to an appropriate number of significant figures?
A 14°C B 20.5°C C 21°C D 22.0°C
9702/13/M/J/13
5 A student takes measurements of the current in a resistor of constant resistance and the potential
difference (p.d.) across it. The readings are then used to plot a graph of current against p.d.
There is a systematic error in the current readings.
How could this be identified from the graph?
A At least one anomalous data point can be identified.
B The data points are scattered about the straight line of best fit.
C The graph is a curve, not a straight line.
D The straight line graph does not pass through the origin.
9702/13/M/J/13
Measurement and its techniques
76.
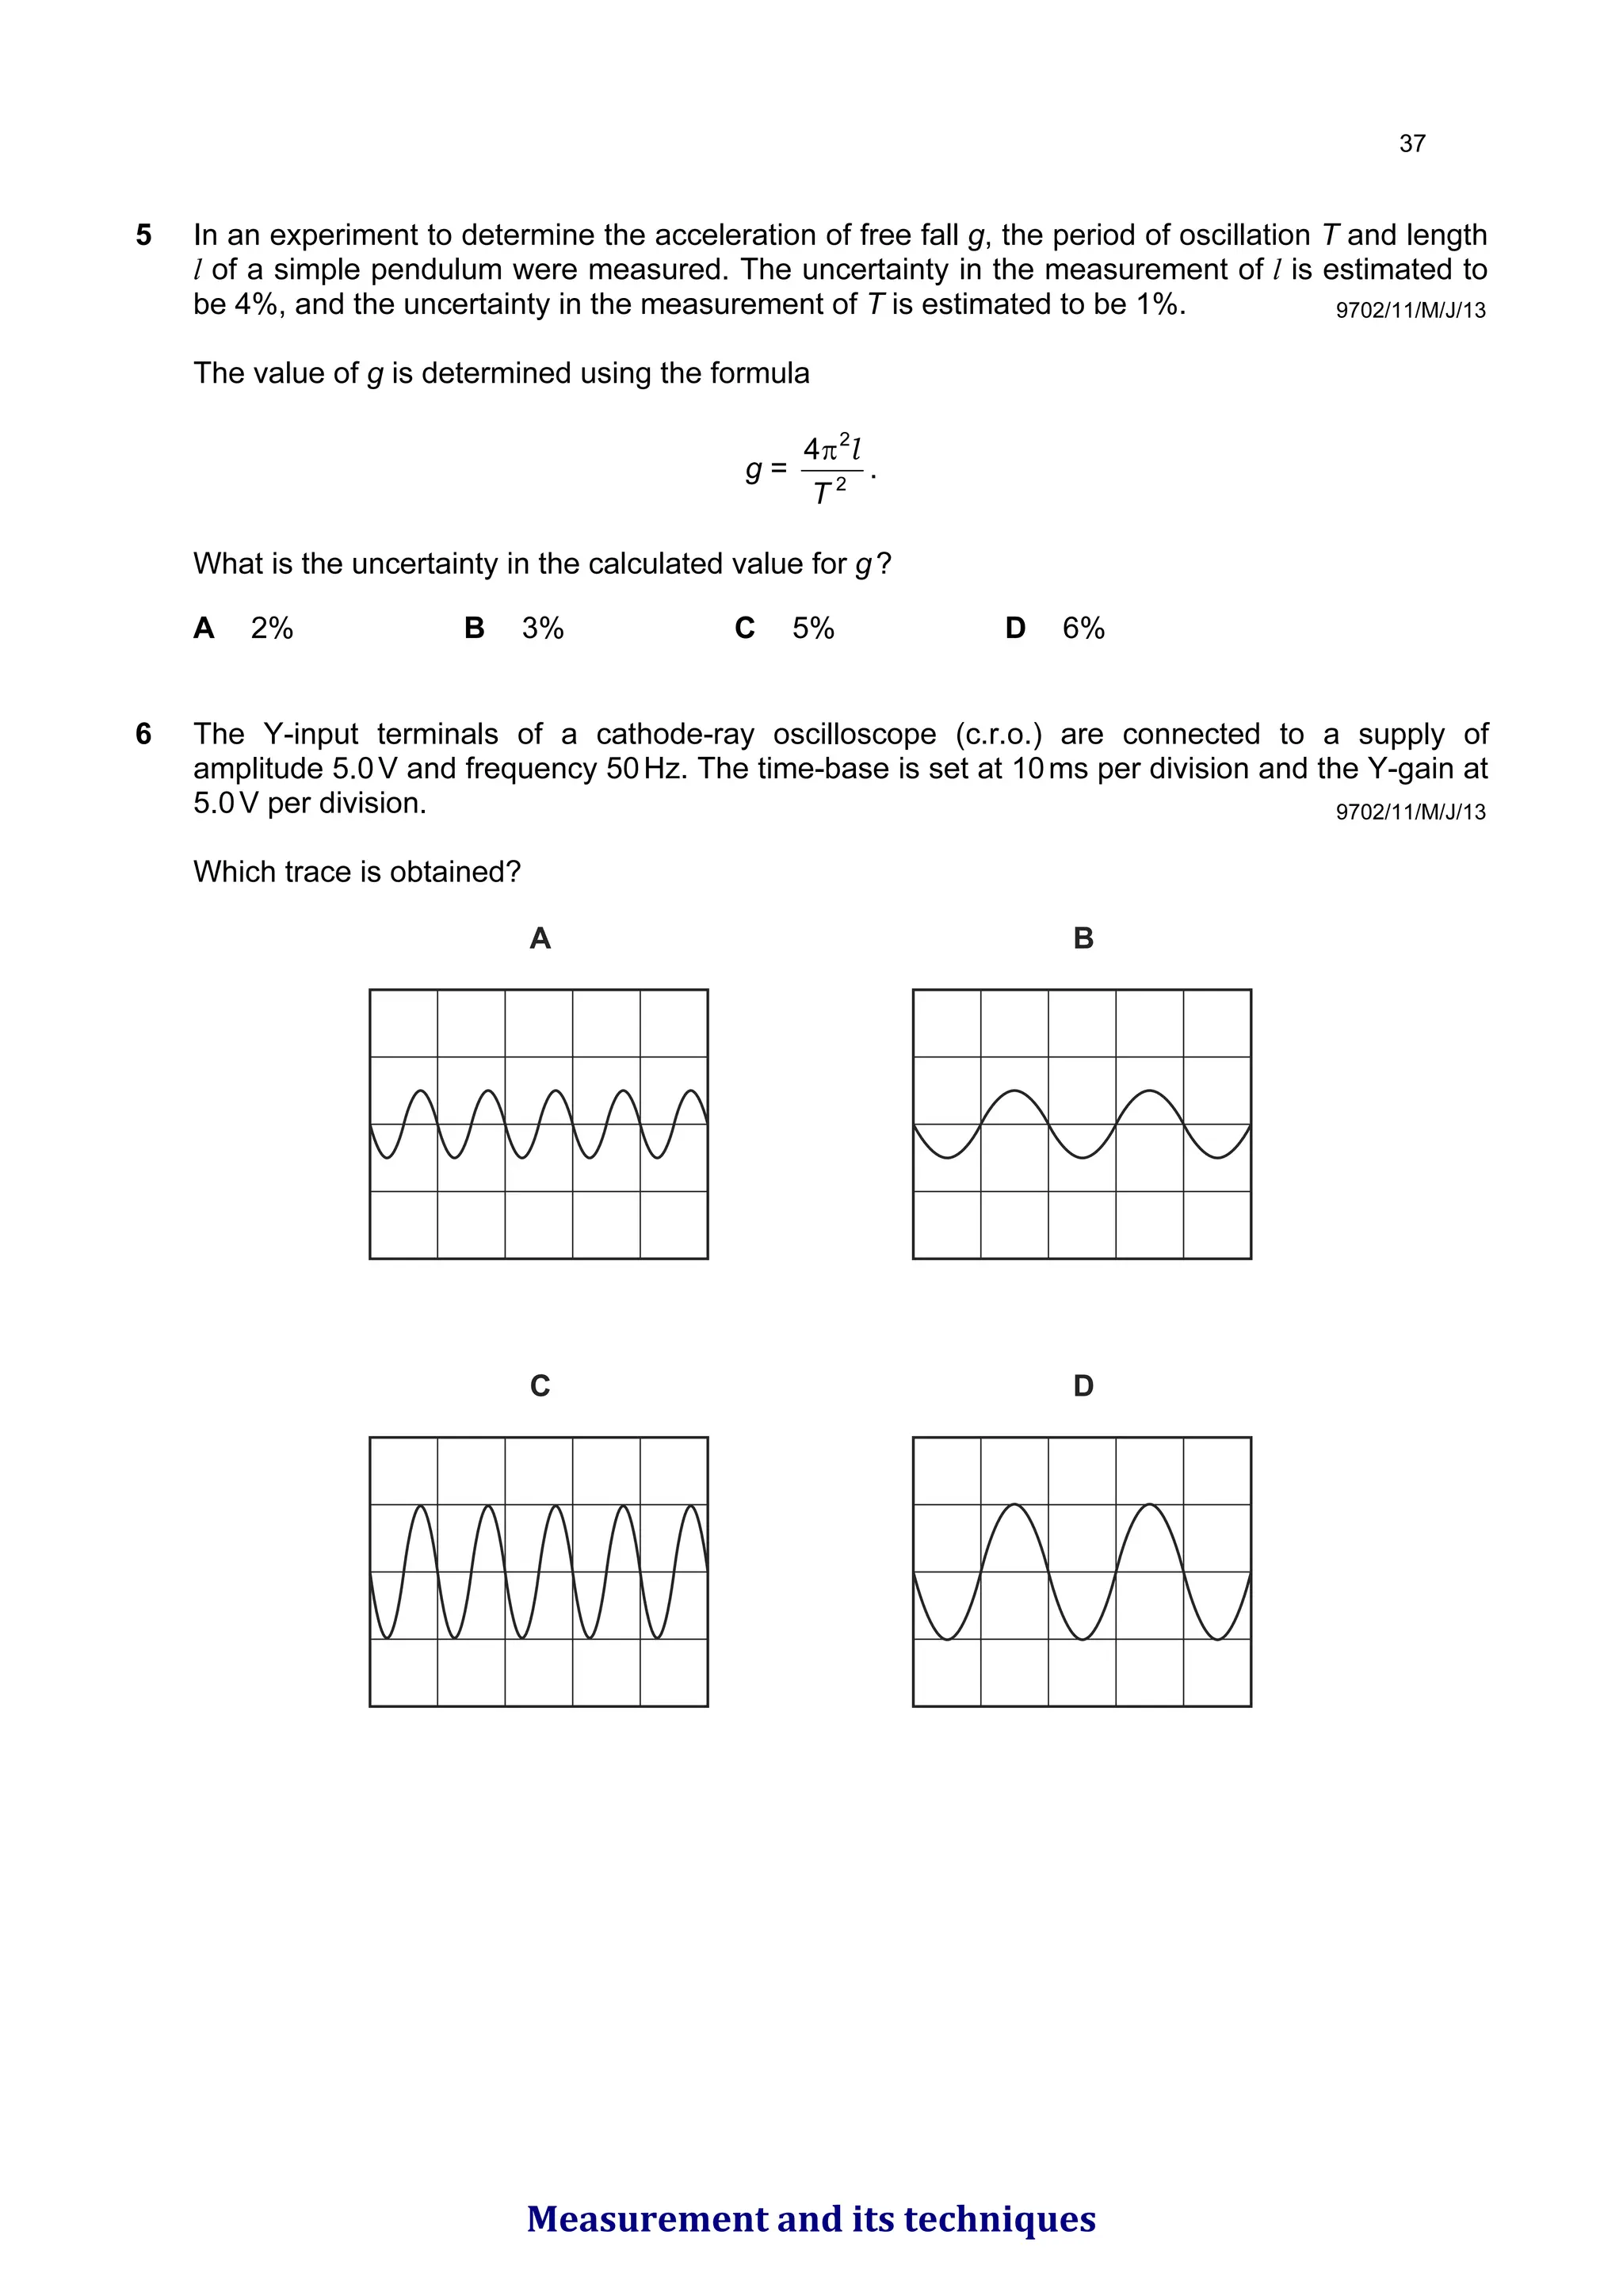
5 In anexperiment to determine the acceleration of free fall g, the period of oscillation T and length
l of a simple pendulum were measured. The uncertainty in the measurement of l is estimated to
be 4%, and the uncertainty in the measurement of T is estimated to be 1%.
The value of g is determined using the formula
g = 2
2
4
T
l
π
.
What is the uncertainty in the calculated value for g?
A 2% B 3% C 5% D 6%
6 The Y-input terminals of a cathode-ray oscilloscope (c.r.o.) are connected to a supply of
amplitude 5.0V and frequency 50Hz. The time-base is set at 10ms per division and the Y-gain at
5.0V per division.
Which trace is obtained?
A
C D
B
9702/11/M/J/13
9702/11/M/J/13
Measurement and its techniques
77.
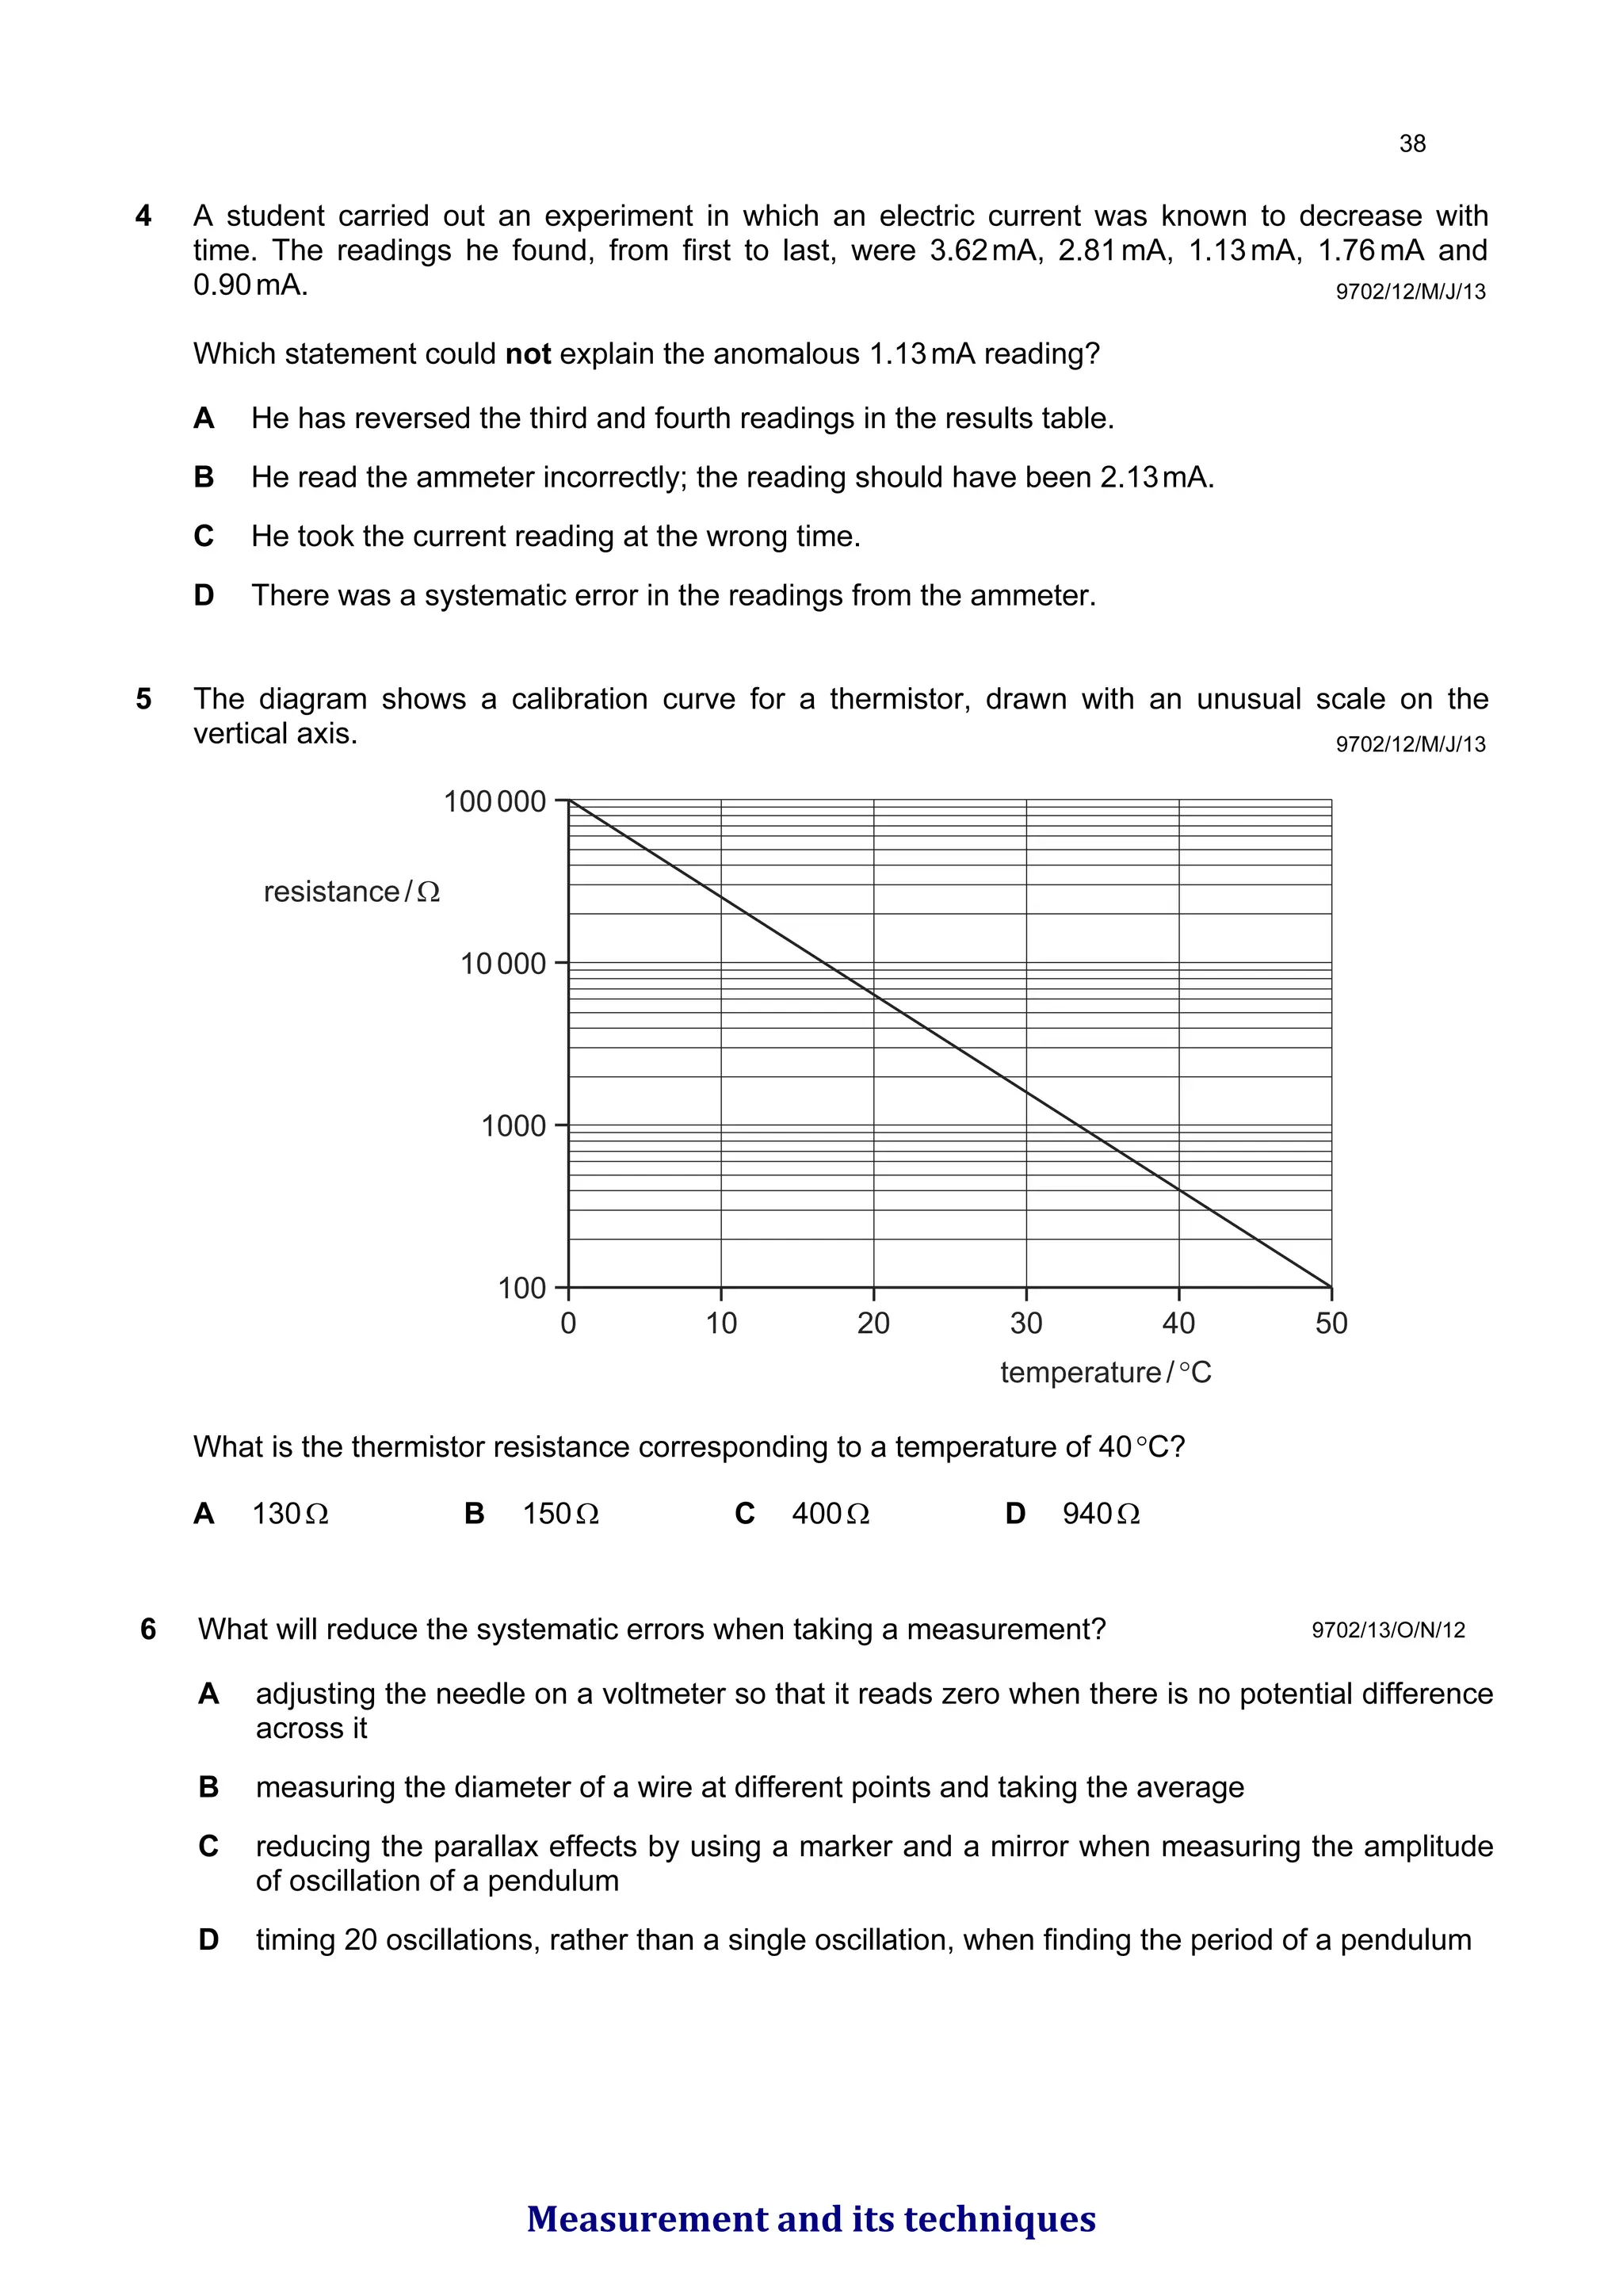
4 A studentcarried out an experiment in which an electric current was known to decrease with
time. The readings he found, from first to last, were 3.62mA, 2.81mA, 1.13mA, 1.76mA and
0.90mA.
Which statement could not explain the anomalous 1.13mA reading?
A He has reversed the third and fourth readings in the results table.
B He read the ammeter incorrectly; the reading should have been 2.13mA.
C He took the current reading at the wrong time.
D There was a systematic error in the readings from the ammeter.
5 The diagram shows a calibration curve for a thermistor, drawn with an unusual scale on the
vertical axis.
0 10 20
temperature/°C
30 40 50
100000
10000
1000
100
resistance/Ω
What is the thermistor resistance corresponding to a temperature of 40°C?
A 130Ω B 150Ω C 400Ω D 940Ω
9702/12/M/J/13
9702/12/M/J/13
6 What will reduce the systematic errors when taking a measurement?
A adjusting the needle on a voltmeter so that it reads zero when there is no potential difference
across it
B measuring the diameter of a wire at different points and taking the average
C reducing the parallax effects by using a marker and a mirror when measuring the amplitude
of oscillation of a pendulum
D timing 20 oscillations, rather than a single oscillation, when finding the period of a pendulum
9702/13/O/N/12
Measurement and its techniques
78.
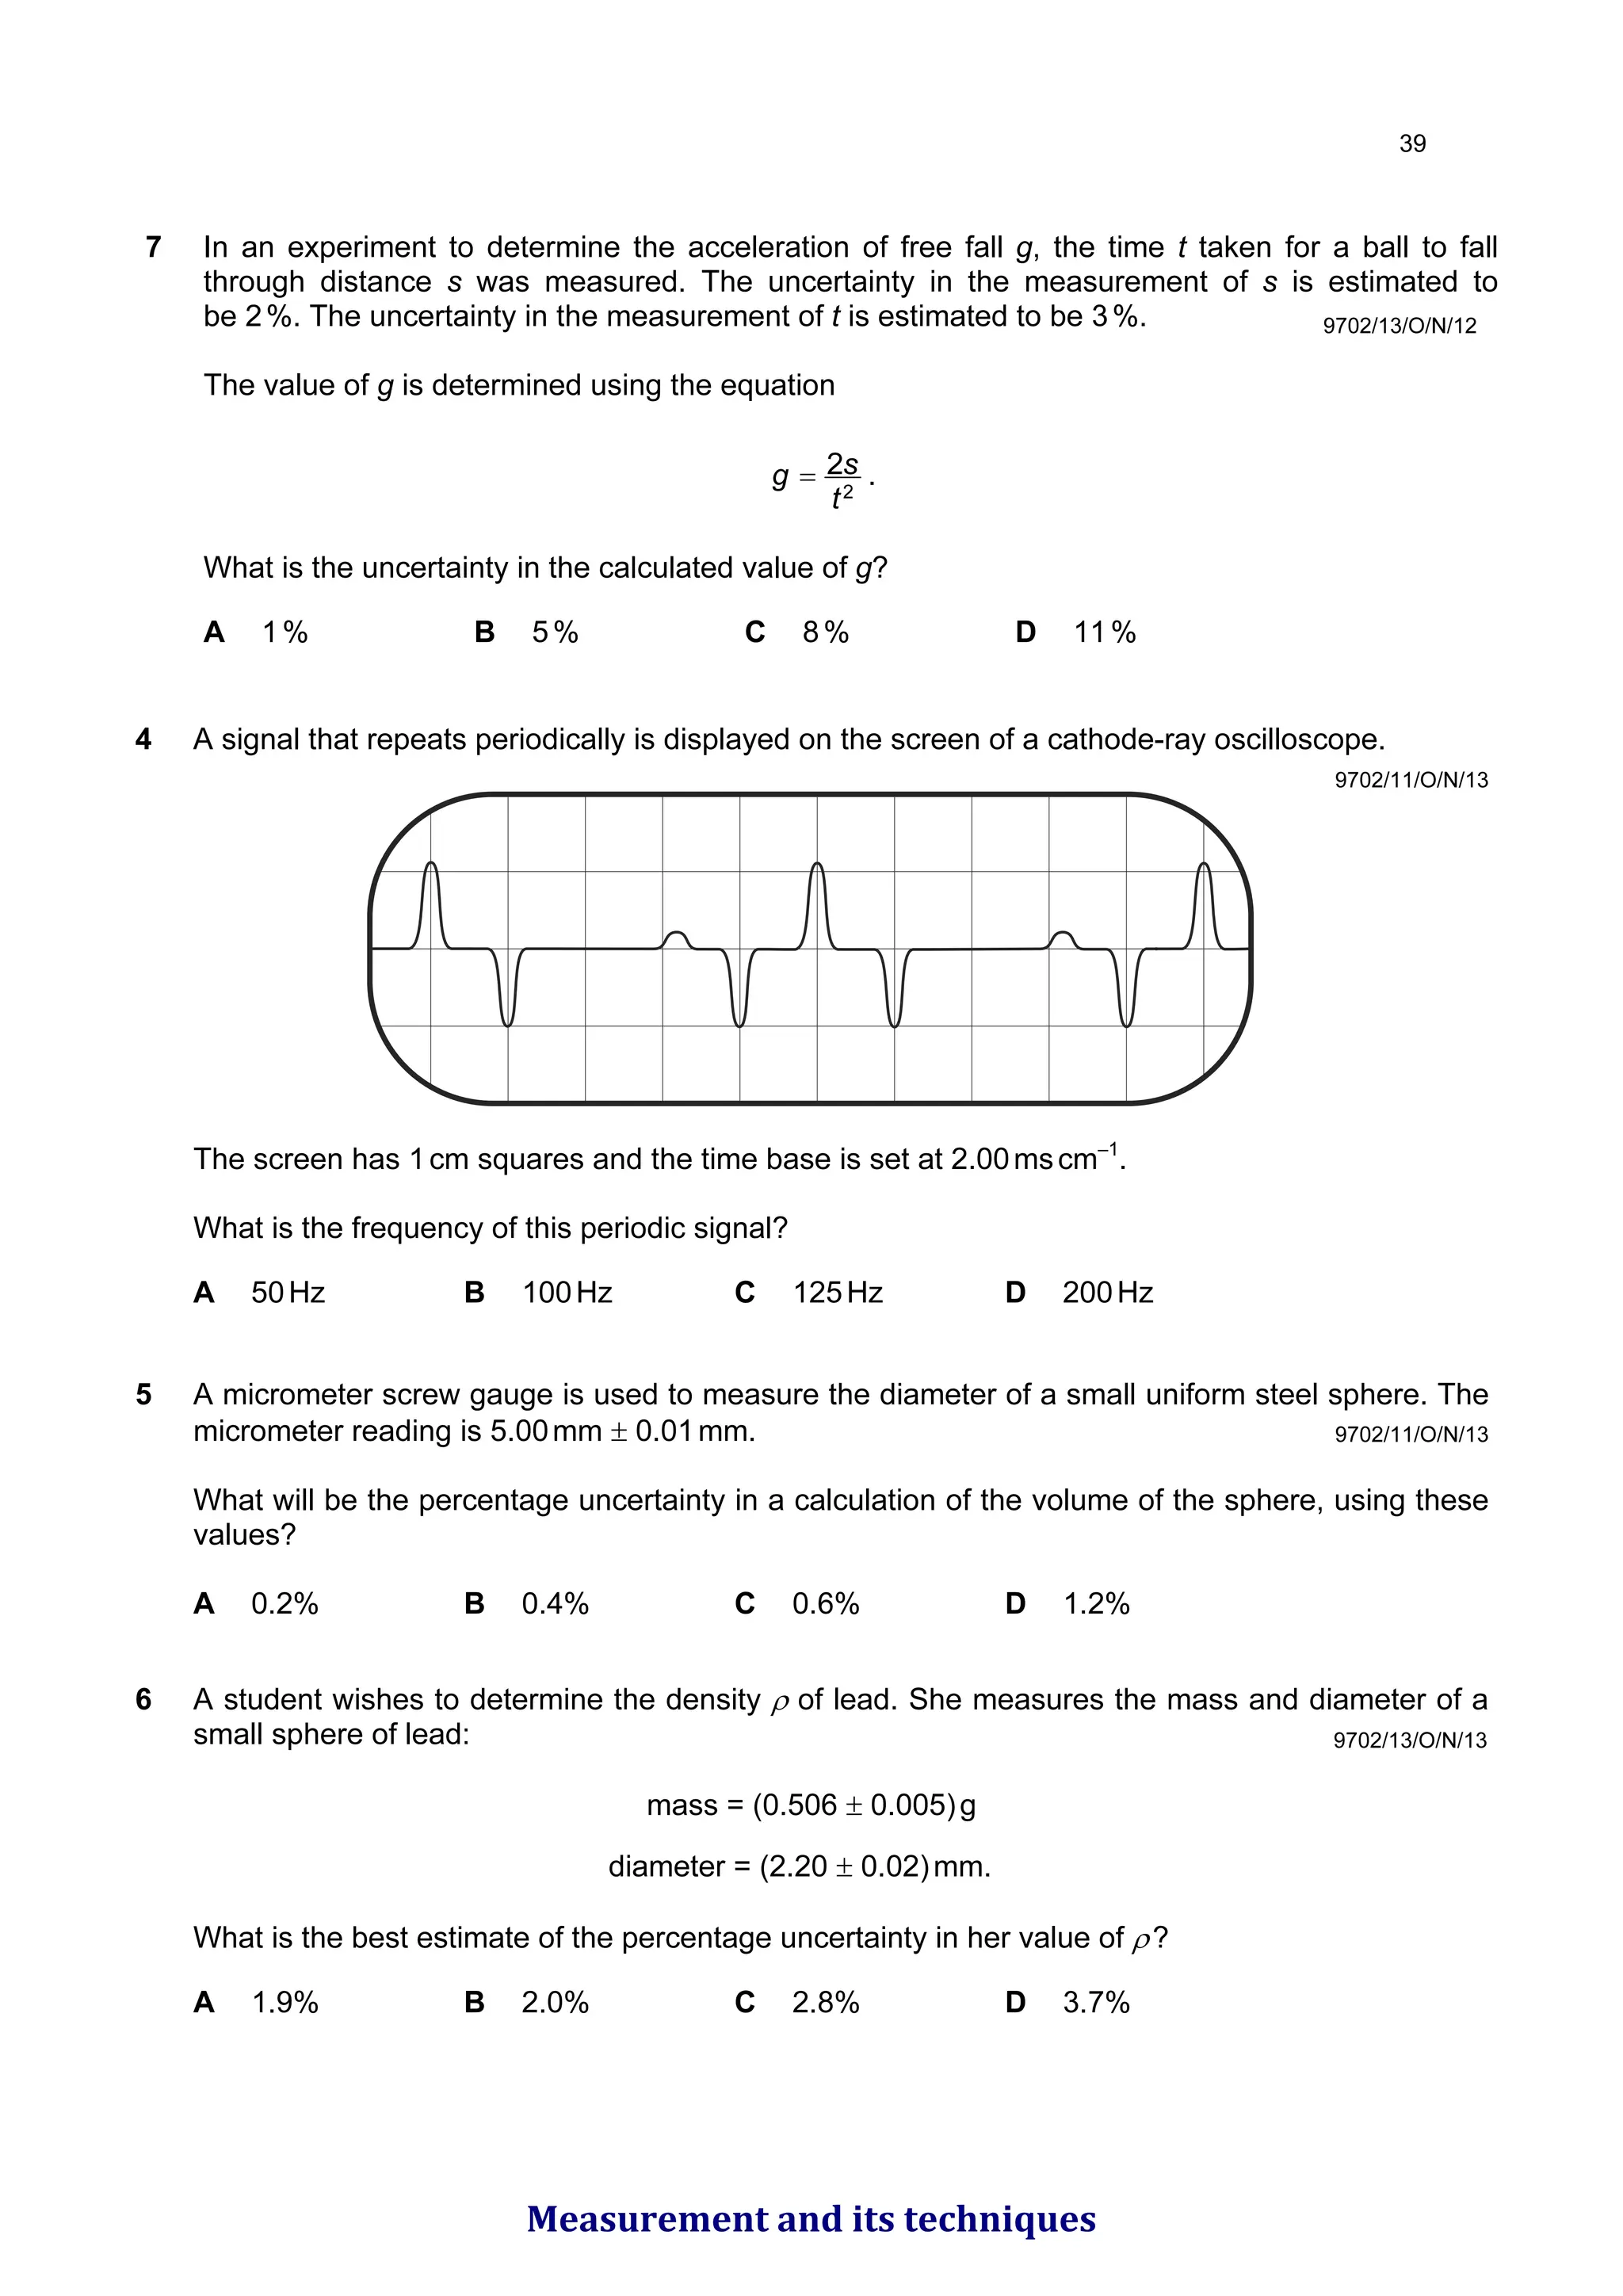
7 In anexperiment to determine the acceleration of free fall g, the time t taken for a ball to fall
through distance s was measured. The uncertainty in the measurement of s is estimated to
be 2%. The uncertainty in the measurement of t is estimated to be 3%.
The value of g is determined using the equation
2
2
t
s
g = .
What is the uncertainty in the calculated value of g?
A 1% B 5% C 8% D 11%
9702/13/O/N/12
4 A signal that repeats periodically is displayed on the screen of a cathode-ray oscilloscope.
The screen has 1cm squares and the time base is set at 2.00mscm–1
.
What is the frequency of this periodic signal?
A 50Hz B 100Hz C 125Hz D 200Hz
9702/11/O/N/13
5 A micrometer screw gauge is used to measure the diameter of a small uniform steel sphere. The
micrometer reading is 5.00mm ± 0.01mm.
What will be the percentage uncertainty in a calculation of the volume of the sphere, using these
values?
A 0.2% B 0.4% C 0.6% D 1.2%
9702/11/O/N/13
6 A student wishes to determine the density ρ of lead. She measures the mass and diameter of a
small sphere of lead:
mass = (0.506 ± 0.005)g
diameter = (2.20 ± 0.02)mm.
What is the best estimate of the percentage uncertainty in her value of ρ?
A 1.9% B 2.0% C 2.8% D 3.7%
9702/13/O/N/13
Measurement and its techniques
79.
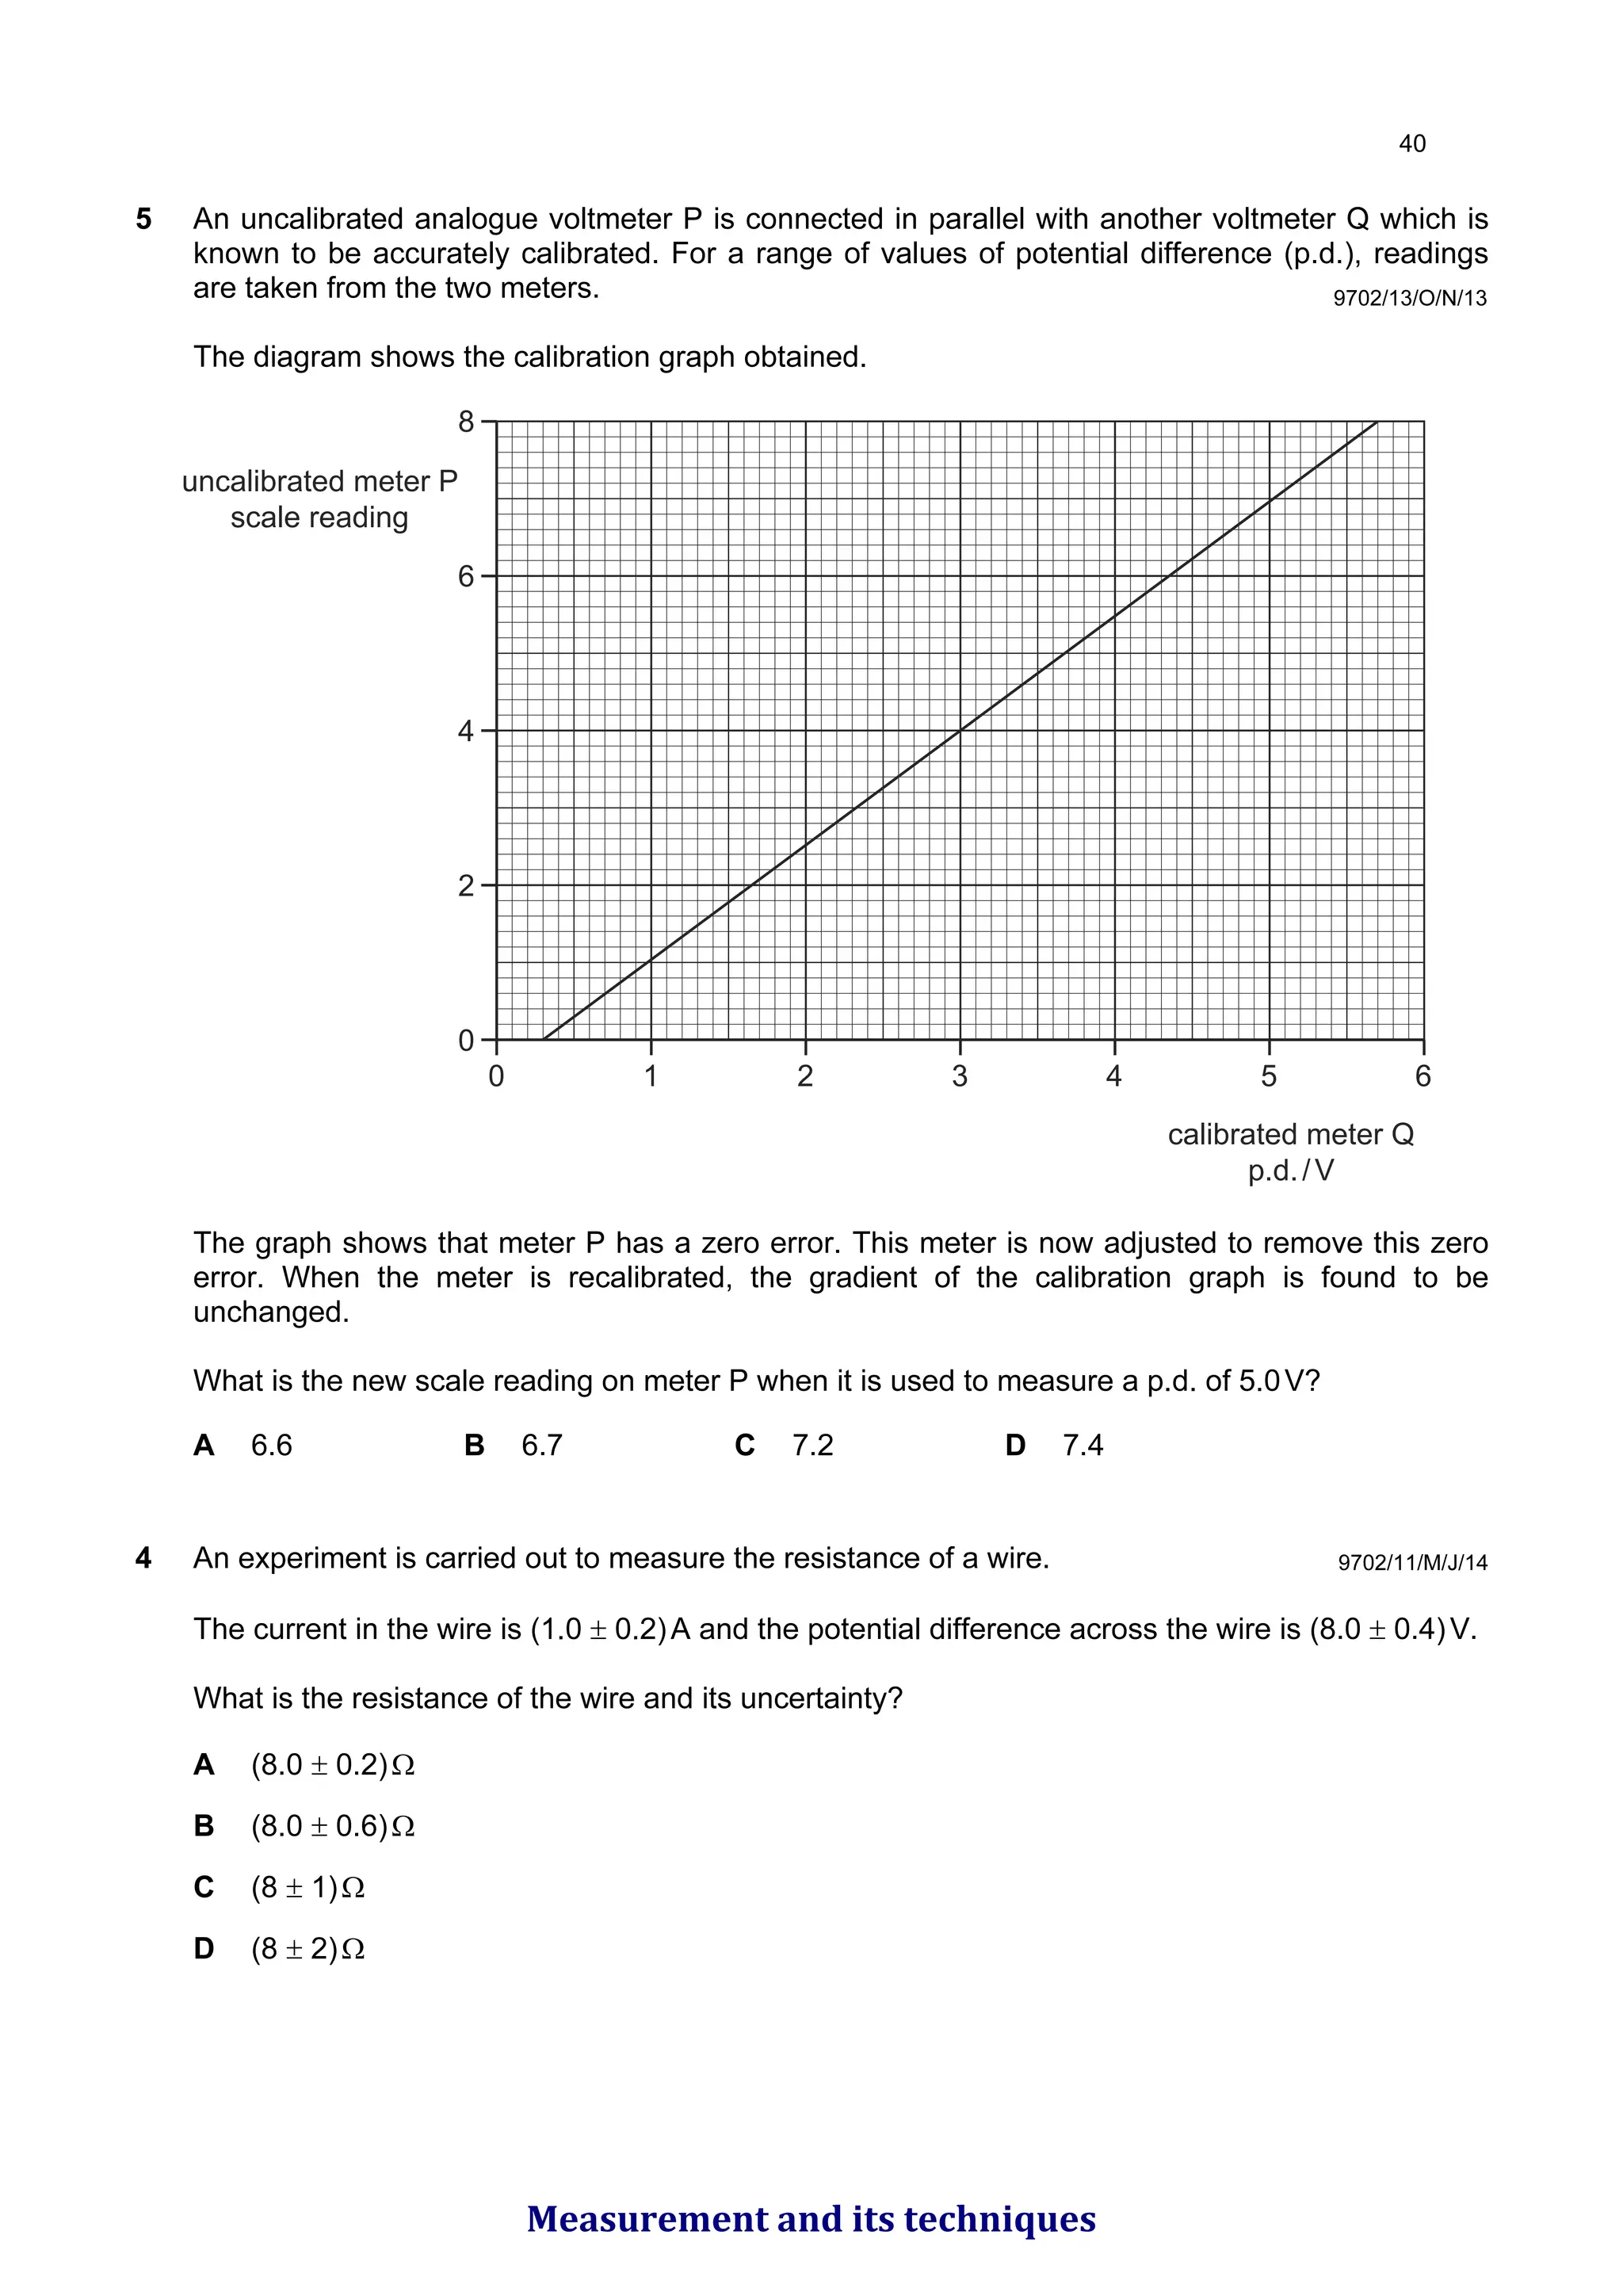
5 An uncalibratedanalogue voltmeter P is connected in parallel with another voltmeter Q which is
known to be accurately calibrated. For a range of values of potential difference (p.d.), readings
are taken from the two meters.
The diagram shows the calibration graph obtained.
8
6
4
2
0
0 1 2 3 4 5 6
calibrated meter Q
p.d./V
uncalibrated meter P
scale reading
The graph shows that meter P has a zero error. This meter is now adjusted to remove this zero
error. When the meter is recalibrated, the gradient of the calibration graph is found to be
unchanged.
What is the new scale reading on meter P when it is used to measure a p.d. of 5.0V?
A 6.6 B 6.7 C 7.2 D 7.4
9702/13/O/N/13
4 An experiment is carried out to measure the resistance of a wire.
The current in the wire is (1.0 ± 0.2)A and the potential difference across the wire is (8.0 ± 0.4)V.
What is the resistance of the wire and its uncertainty?
A (8.0 ± 0.2)Ω
B (8.0 ± 0.6)Ω
C (8 ± 1)Ω
D (8 ± 2)Ω
9702/11/M/J/14
Measurement and its techniques
80.
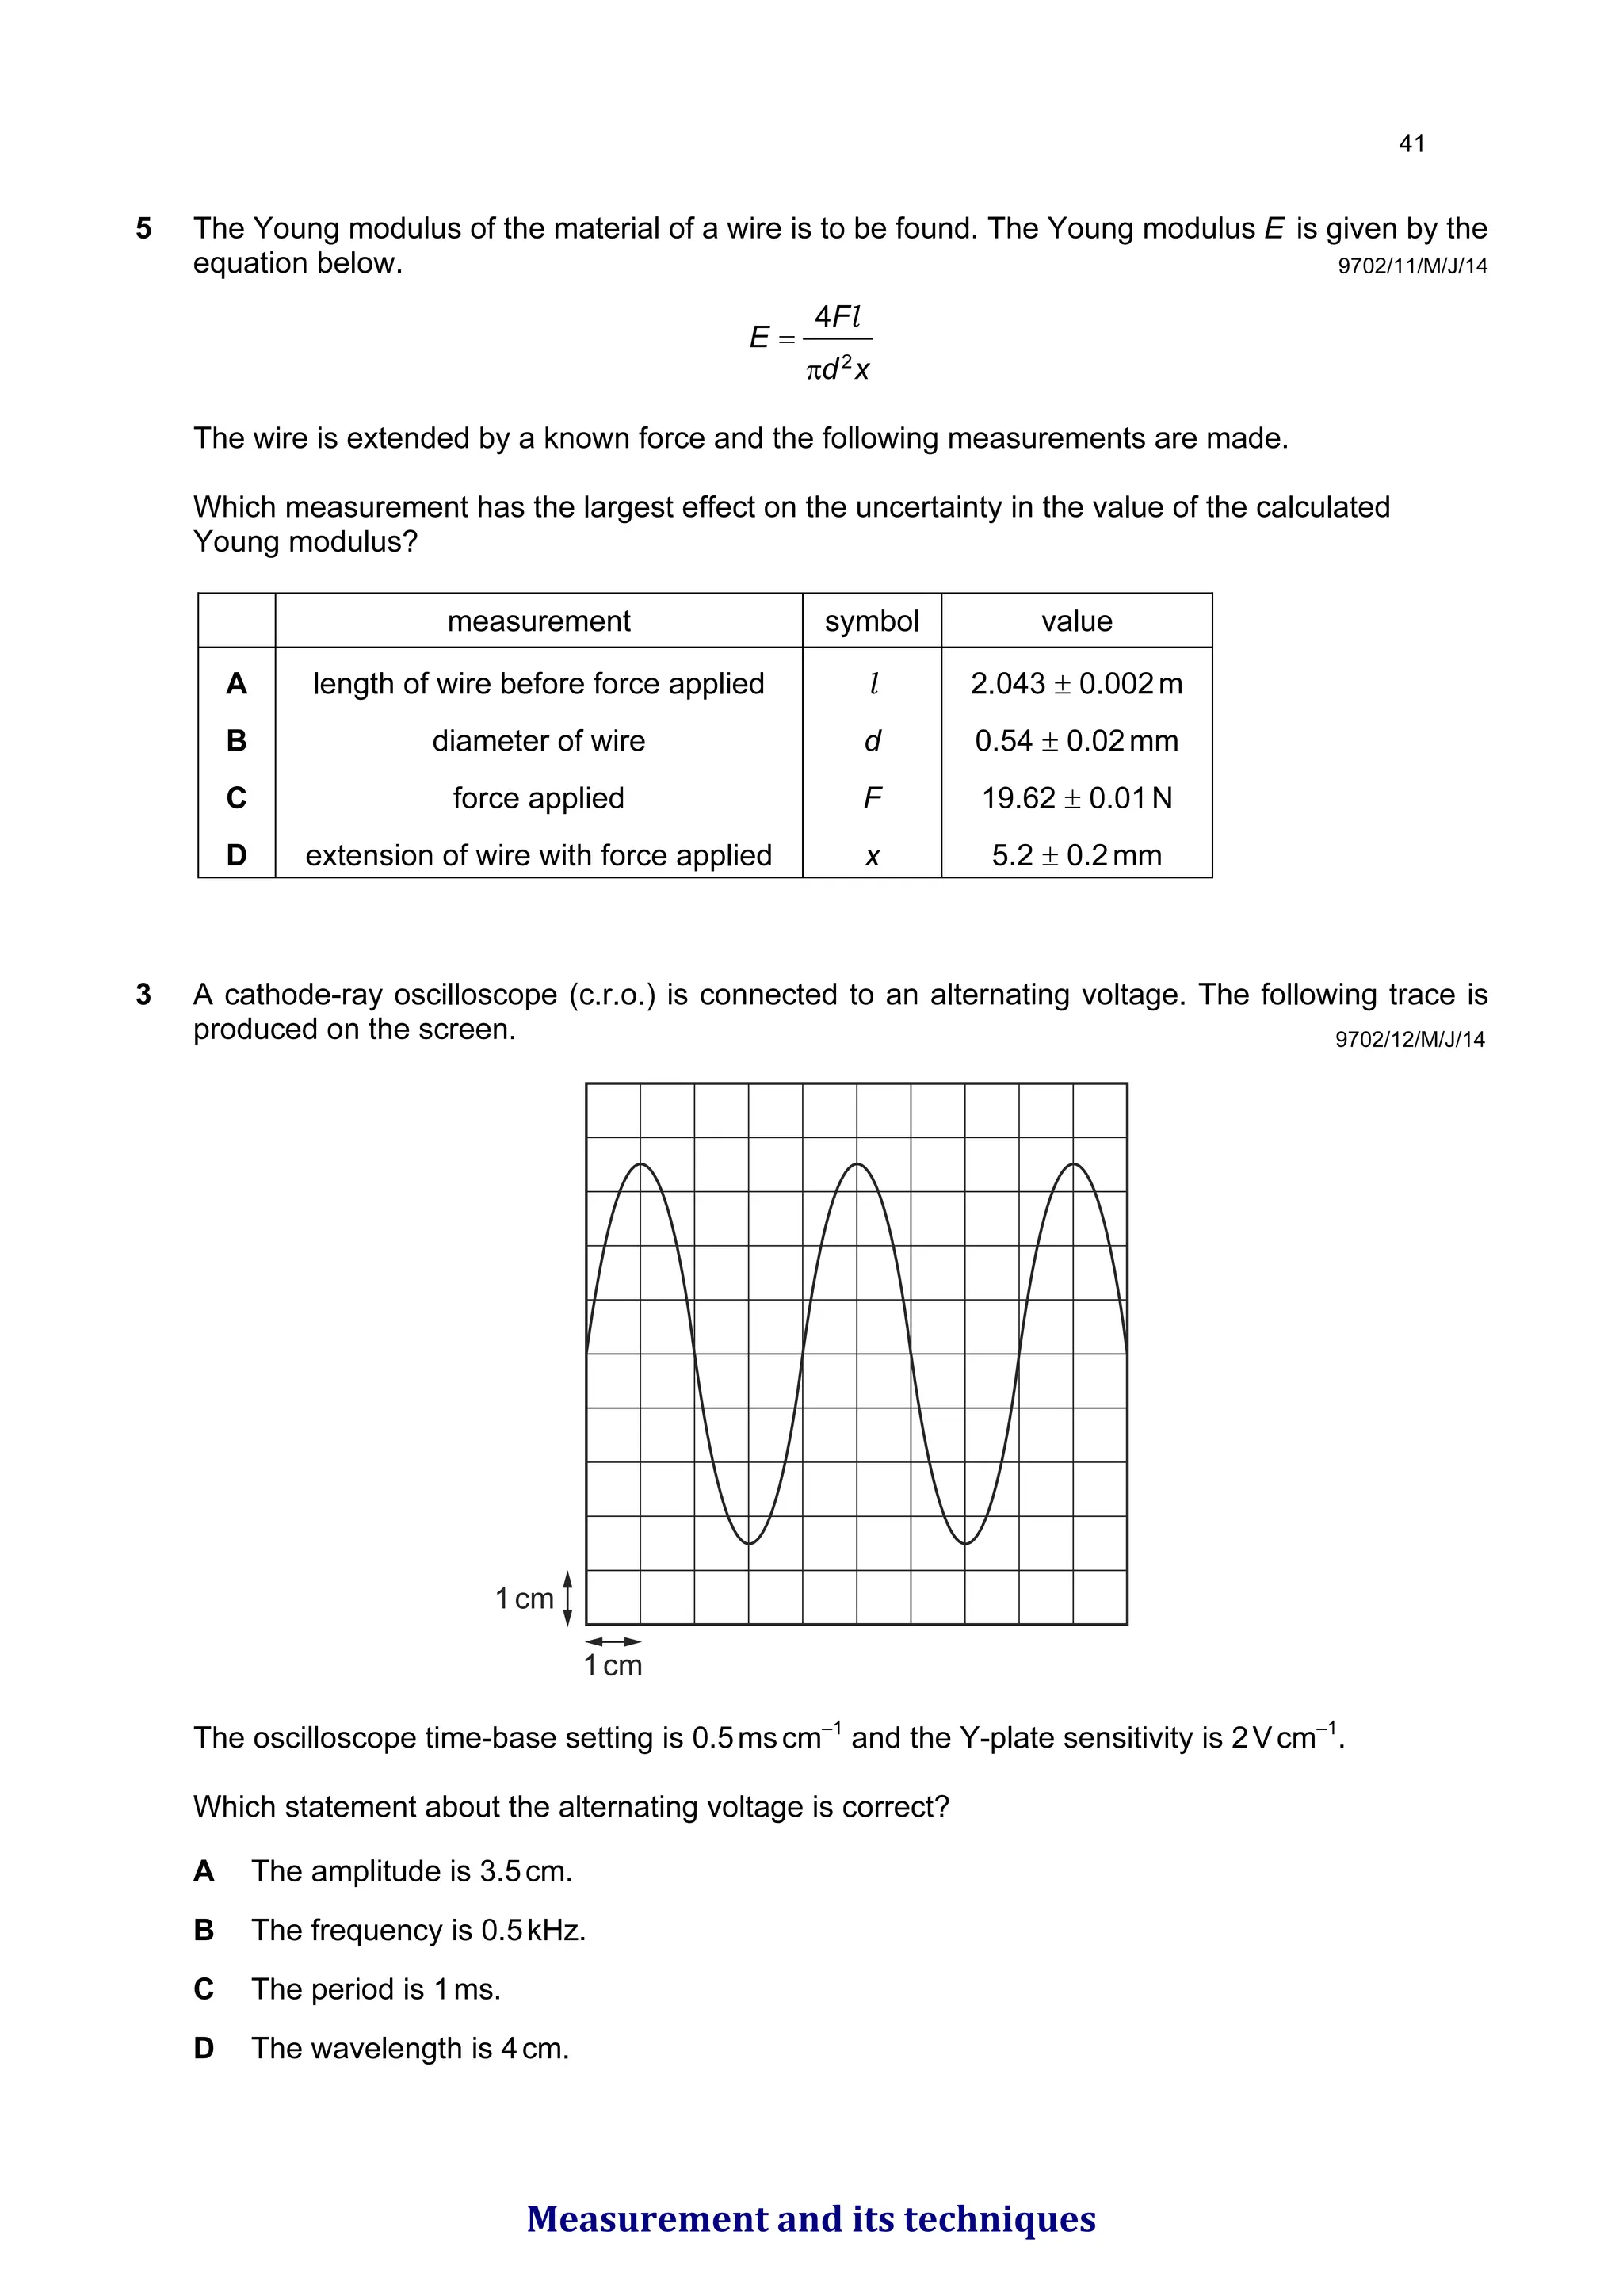
5 The Youngmodulus of the material of a wire is to be found. The Young modulus E is given by the
equation below.
x
d
F
E
2
4
π
=
l
The wire is extended by a known force and the following measurements are made.
Which measurement has the largest effect on the uncertainty in the value of the calculated
Young modulus?
measurement symbol value
A length of wire before force applied l 2.043 ± 0.002m
B diameter of wire d 0.54 ± 0.02mm
C force applied F 19.62 ± 0.01N
D extension of wire with force applied x 5.2 ± 0.2mm
9702/11/M/J/14
3 A cathode-ray oscilloscope (c.r.o.) is connected to an alternating voltage. The following trace is
produced on the screen.
1cm
1cm
The oscilloscope time-base setting is 0.5mscm–1
and the Y-plate sensitivity is 2Vcm–1
.
Which statement about the alternating voltage is correct?
A The amplitude is 3.5cm.
B The frequency is 0.5kHz.
C The period is 1ms.
D The wavelength is 4cm.
9702/12/M/J/14
Measurement and its techniques
81.
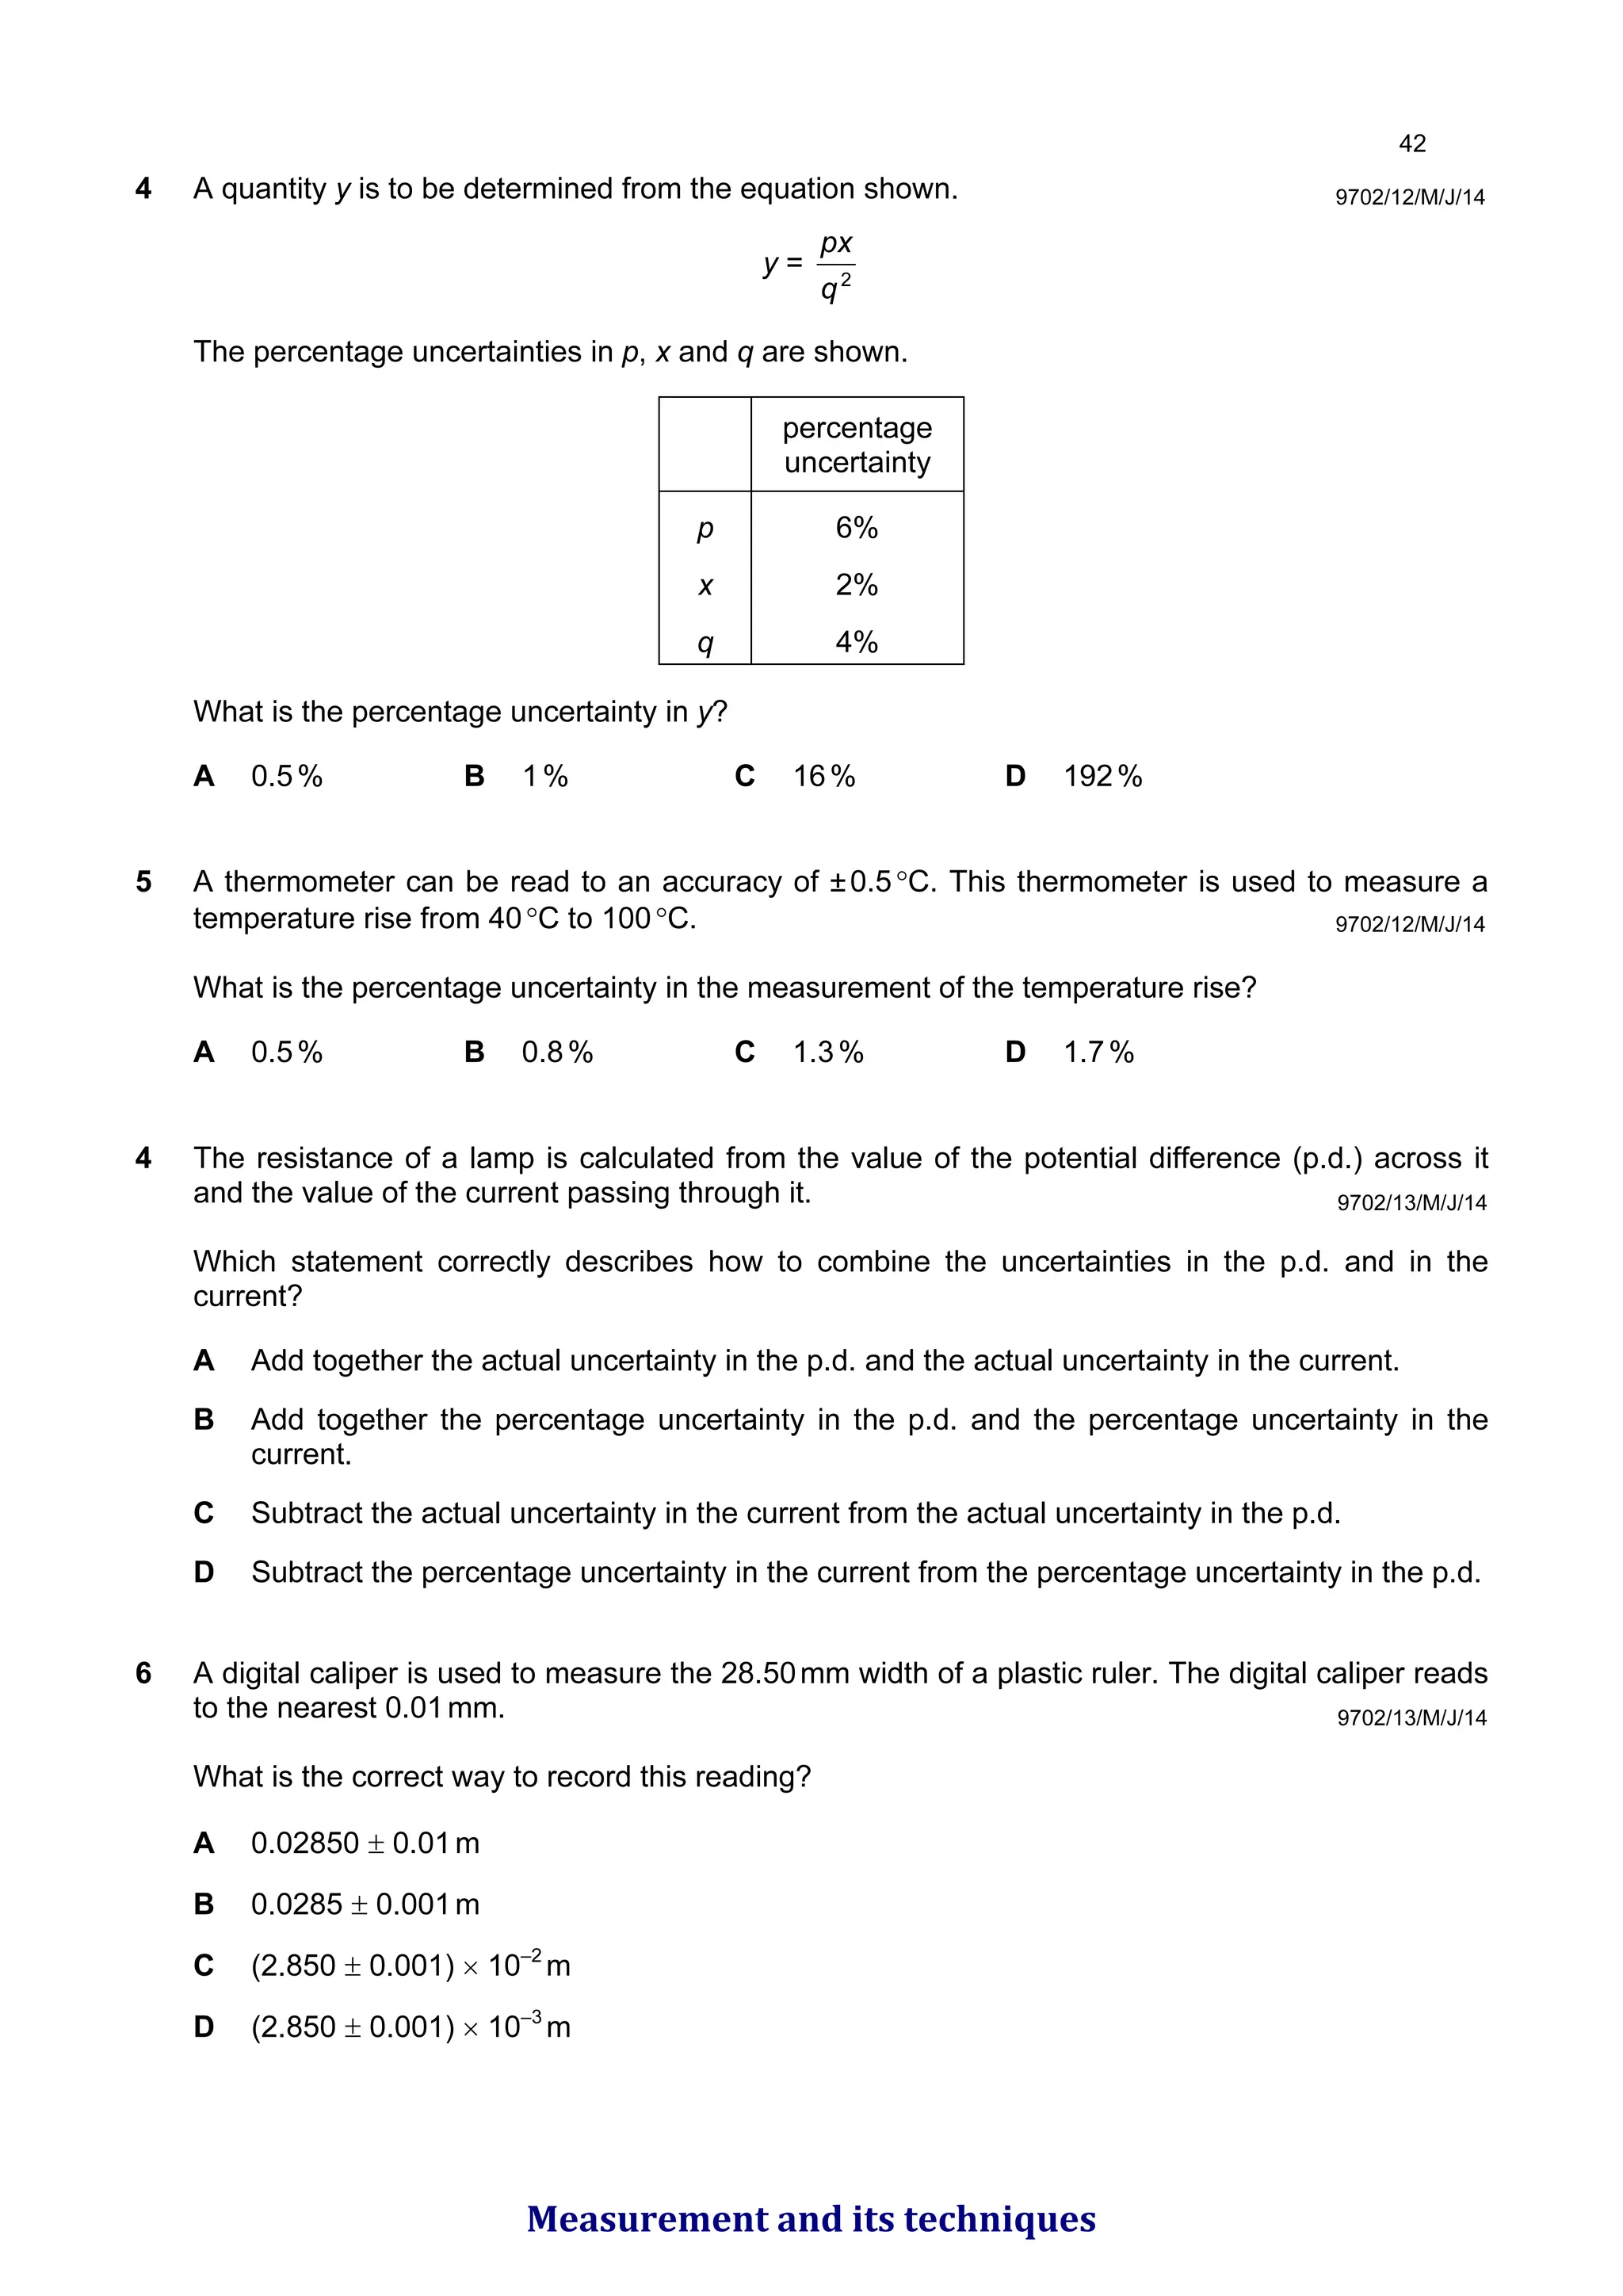
4 A quantityy is to be determined from the equation shown.
y = 2
q
px
The percentage uncertainties in p, x and q are shown.
percentage
uncertainty
p 6%
x 2%
q 4%
What is the percentage uncertainty in y?
A 0.5% B 1% C 16% D 192%
5 A thermometer can be read to an accuracy of ±0.5°C. This thermometer is used to measure a
temperature rise from 40°C to 100°C.
What is the percentage uncertainty in the measurement of the temperature rise?
A 0.5% B 0.8% C 1.3% D 1.7%
9702/12/M/J/14
9702/12/M/J/14
4 The resistance of a lamp is calculated from the value of the potential difference (p.d.) across it
and the value of the current passing through it.
Which statement correctly describes how to combine the uncertainties in the p.d. and in the
current?
A Add together the actual uncertainty in the p.d. and the actual uncertainty in the current.
B Add together the percentage uncertainty in the p.d. and the percentage uncertainty in the
current.
C Subtract the actual uncertainty in the current from the actual uncertainty in the p.d.
D Subtract the percentage uncertainty in the current from the percentage uncertainty in the p.d.
9702/13/M/J/14
6 A digital caliper is used to measure the 28.50mm width of a plastic ruler. The digital caliper reads
to the nearest 0.01mm.
What is the correct way to record this reading?
A 0.02850 ± 0.01m
B 0.0285 ± 0.001m
C (2.850 ± 0.001) × 10–2
m
D (2.850 ± 0.001) × 10–3
m
9702/13/M/J/14
Measurement and its techniques
82.
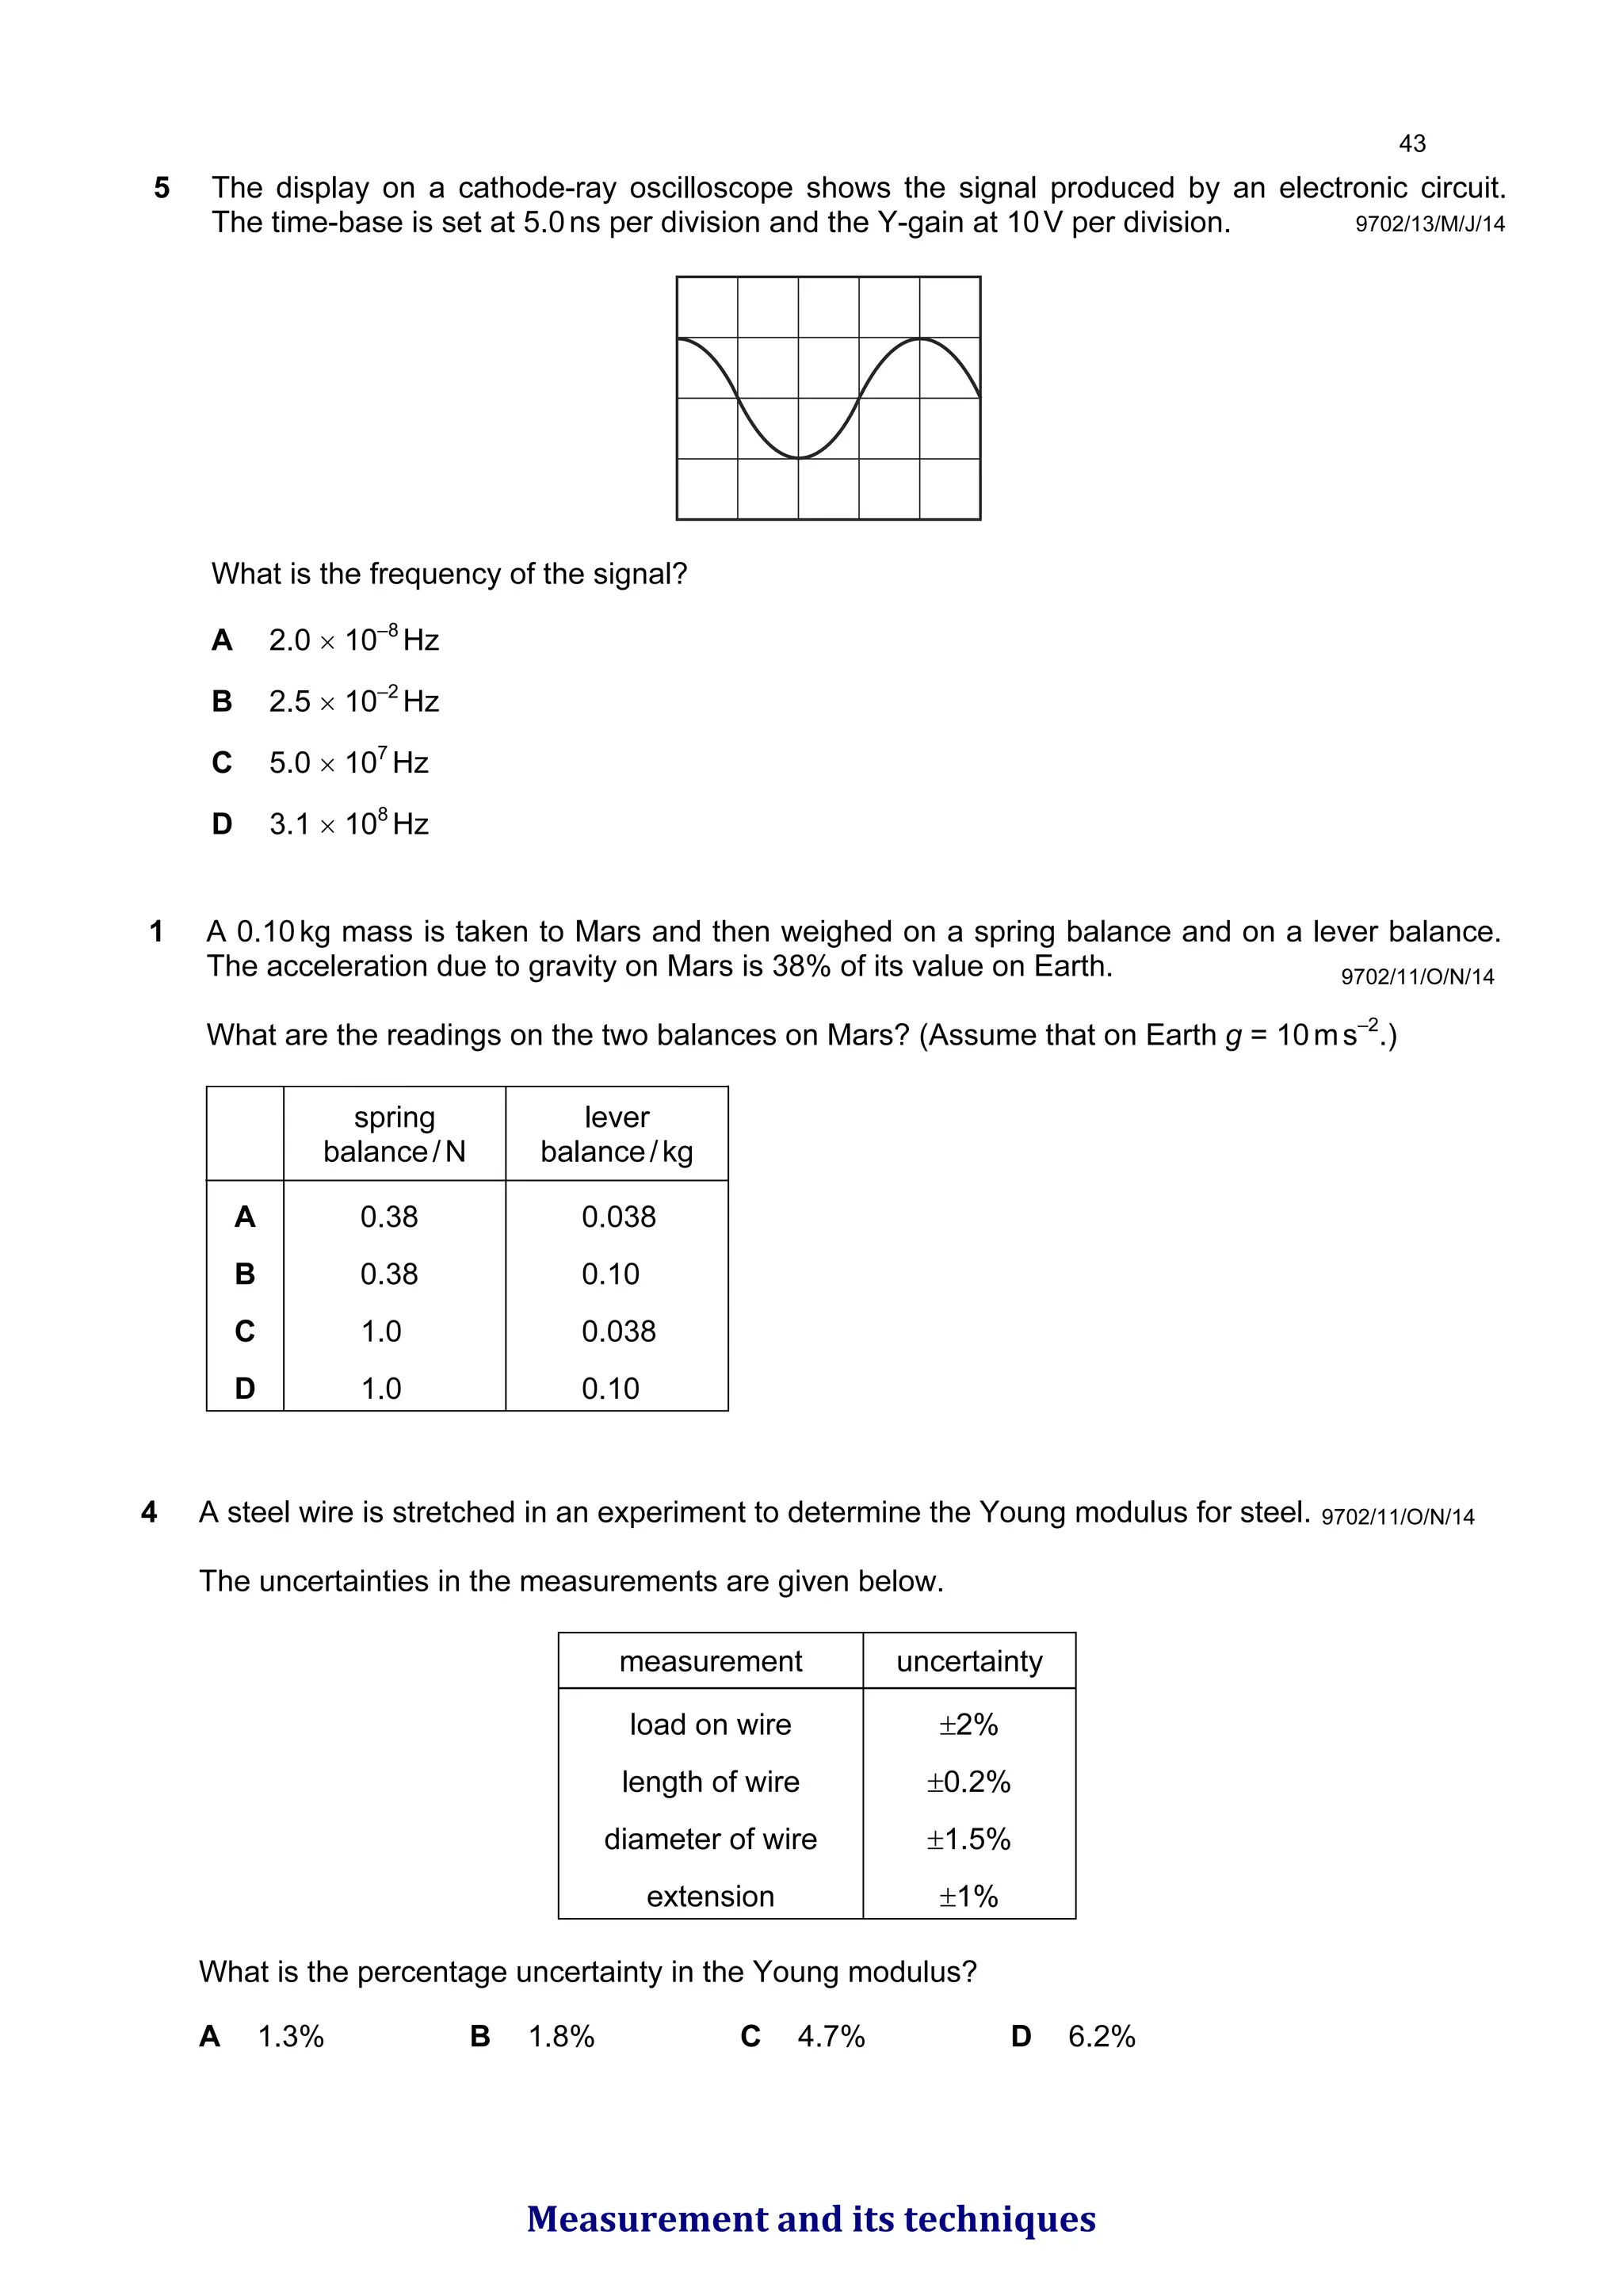
5 The displayon a cathode-ray oscilloscope shows the signal produced by an electronic circuit.
The time-base is set at 5.0ns per division and the Y-gain at 10V per division.
What is the frequency of the signal?
A 2.0 × 10⁻⁸
Hz
B 2.5 × 10⁻²
Hz
C 5.0 × 10⁷
Hz
D 3.1 × 10⁸
Hz
9702/13/M/J/14
9702/11/O/N/14
1 A 0.10kg mass is taken to Mars and then weighed on a spring balance and on a lever balance.
The acceleration due to gravity on Mars is 38% of its value on Earth.
What are the readings on the two balances on Mars? (Assume that on Earth g = 10ms–2
.)
spring
balance/N
lever
balance/kg
A 0.38 0.038
B 0.38 0.10
C 1.0 0.038
D 1.0 0.10
4 A steel wire is stretched in an experiment to determine the Young modulus for steel.
The uncertainties in the measurements are given below.
measurement uncertainty
load on wire ±2%
length of wire ±0.2%
diameter of wire ±1.5%
extension ±1%
What is the percentage uncertainty in the Young modulus?
A 1.3% B 1.8% C 4.7% D 6.2%
9702/11/O/N/14
Measurement and its techniques
83.
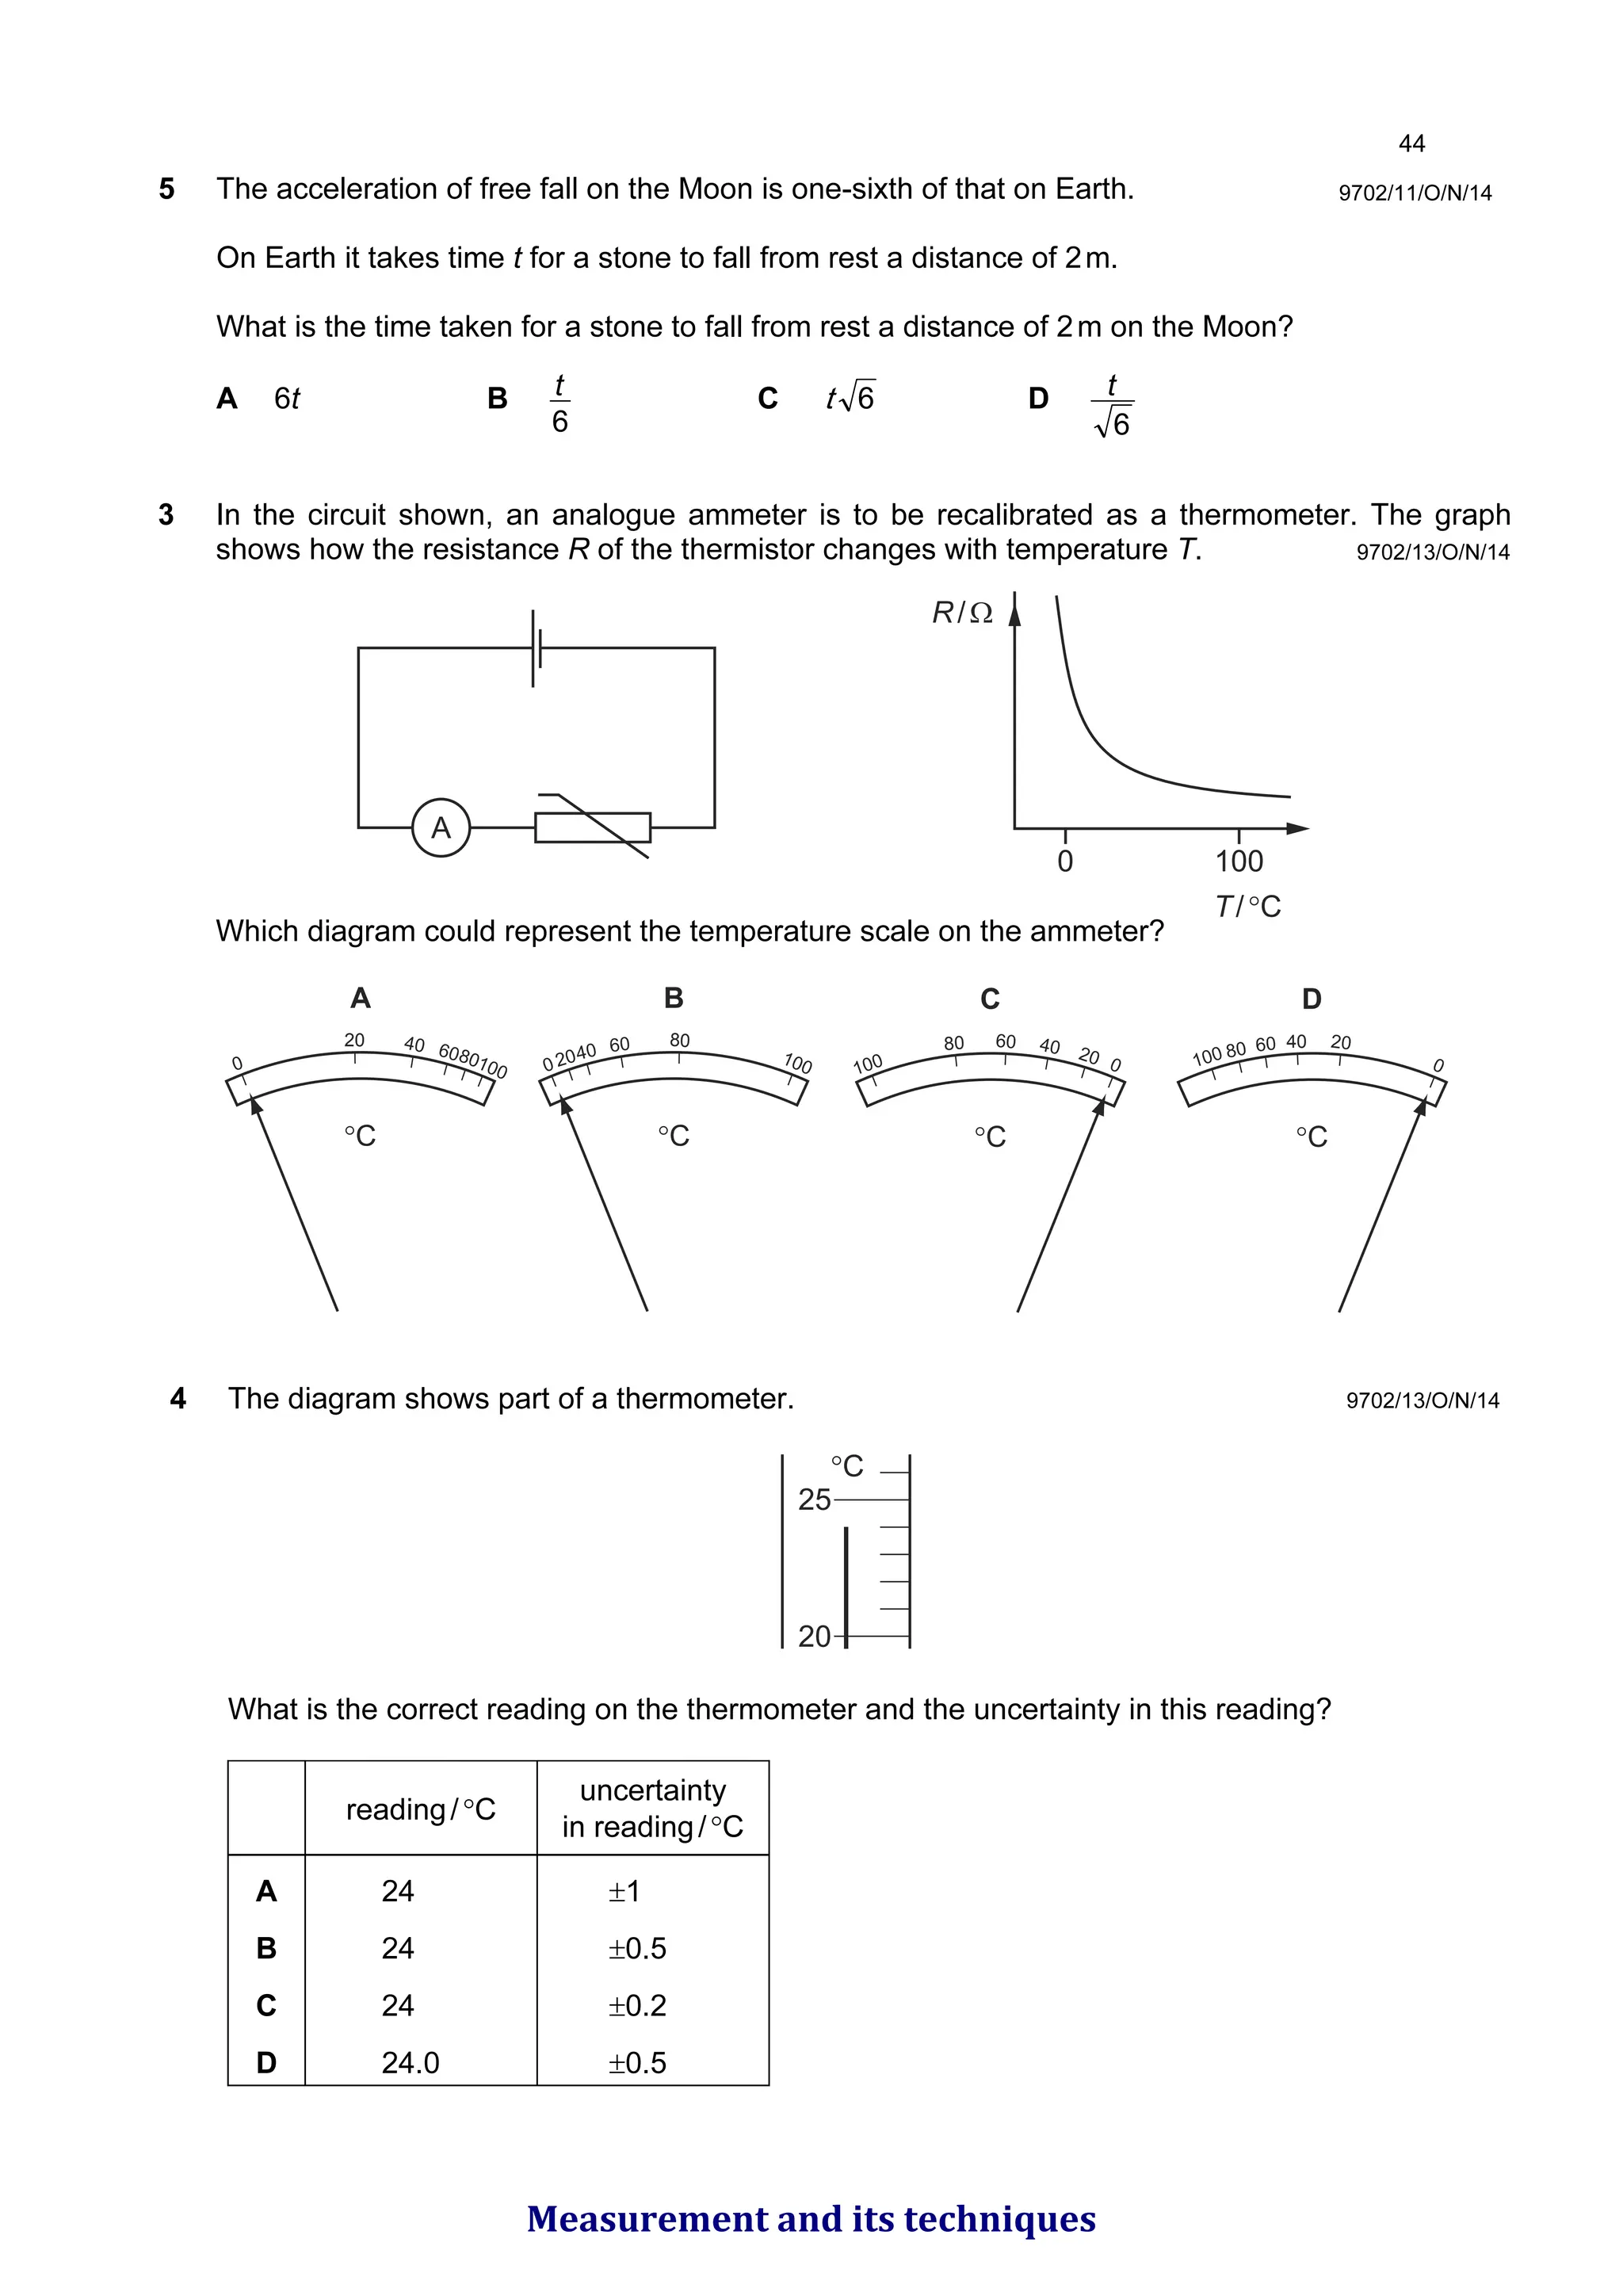
5 The accelerationof free fall on the Moon is one-sixth of that on Earth.
On Earth it takes time t for a stone to fall from rest a distance of 2m.
What is the time taken for a stone to fall from rest a distance of 2m on the Moon?
A 6t B
6
t C
W D
6
t
9702/11/O/N/14
9702/13/O/N/14
3 In the circuit shown, an analogue ammeter is to be recalibrated as a thermometer. The graph
shows how the resistance R of the thermistor changes with temperature T.
A
0 100
R/Ω
T/°C
Which diagram could represent the temperature scale on the ammeter?
0
20 40 6080100
°C
A
02040 60 80
100
°C
B
100
80 60 40 20 0
°C
C
100 80 60 40 20
0
°C
D
4 The diagram shows part of a thermometer.
25
20
°C
What is the correct reading on the thermometer and the uncertainty in this reading?
reading/°C
uncertainty
in reading/°C
A 24 ±1
B 24 ±0.5
C 24 ±0.2
D 24.0 ±0.5
9702/13/O/N/14
Measurement and its techniques
84.
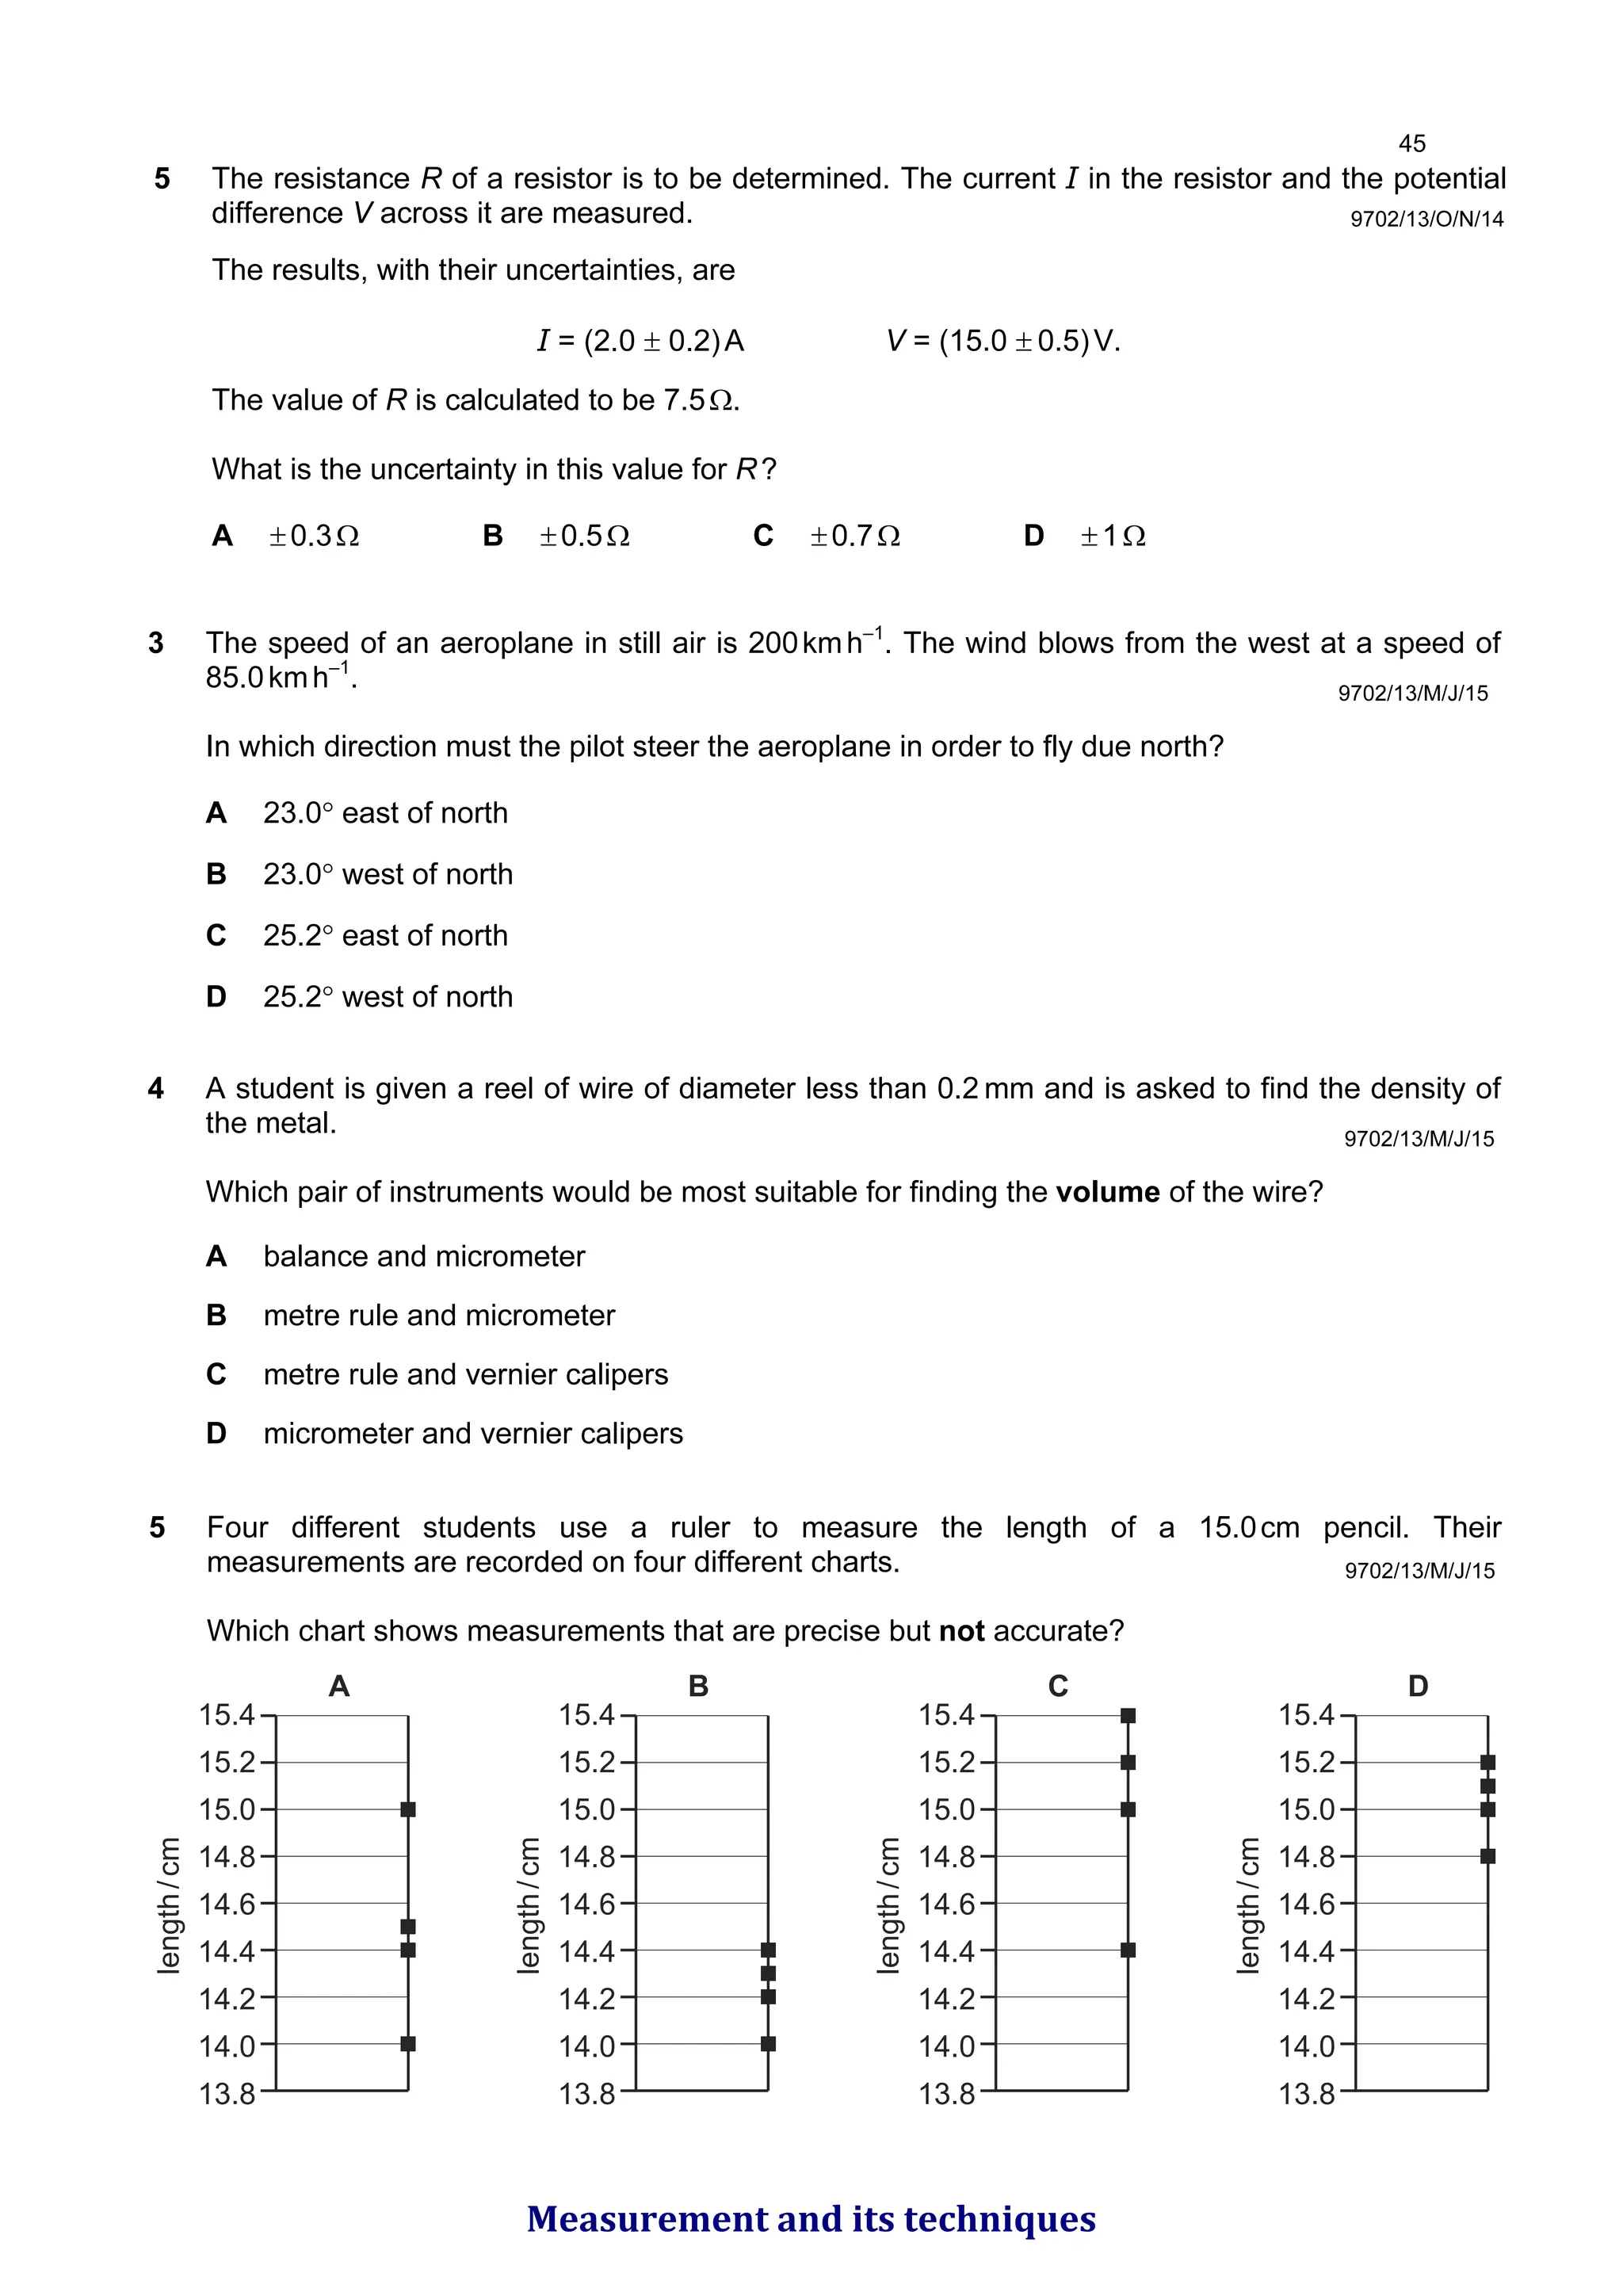
5 The resistanceR of a resistor is to be determined. The current I in the resistor and the potential
difference V across it are measured.
The results, with their uncertainties, are
I = (2.0 ± 0.2)A V = (15.0 ± 0.5)V.
The value of R is calculated to be 7.5Ω.
What is the uncertainty in this value for R?
A ±0.3Ω B ±0.5Ω C ±0.7Ω D ±1Ω
9702/13/O/N/14
9702/13/M/J/15
3 The speed of an aeroplane in still air is 200kmh–1
. The wind blows from the west at a speed of
85.0kmh–1
.
In which direction must the pilot steer the aeroplane in order to fly due north?
A 23.0° east of north
B 23.0° west of north
C 25.2° east of north
D 25.2° west of north
4 A student is given a reel of wire of diameter less than 0.2 mm and is asked to find the density of
the metal.
Which pair of instruments would be most suitable for finding the volume of the wire?
A balance and micrometer
B metre rule and micrometer
C metre rule and vernier calipers
D micrometer and vernier calipers
9702/13/M/J/15
5 Four different students use a ruler to measure the length of a 15.0cm pencil. Their
measurements are recorded on four different charts.
Which chart shows measurements that are precise but not accurate?
15.4
15.2
15.0
14.8
14.6
14.4
14.2
14.0
13.8
length
/
cm
A
15.4
15.2
15.0
14.8
14.6
14.4
14.2
14.0
13.8
length
/
cm
B
15.4
15.2
15.0
14.8
14.6
14.4
14.2
14.0
13.8
length
/
cm
C
15.4
15.2
15.0
14.8
14.6
14.4
14.2
14.0
13.8
length
/
cm
D
9702/13/M/J/15
Measurement and its techniques
85.
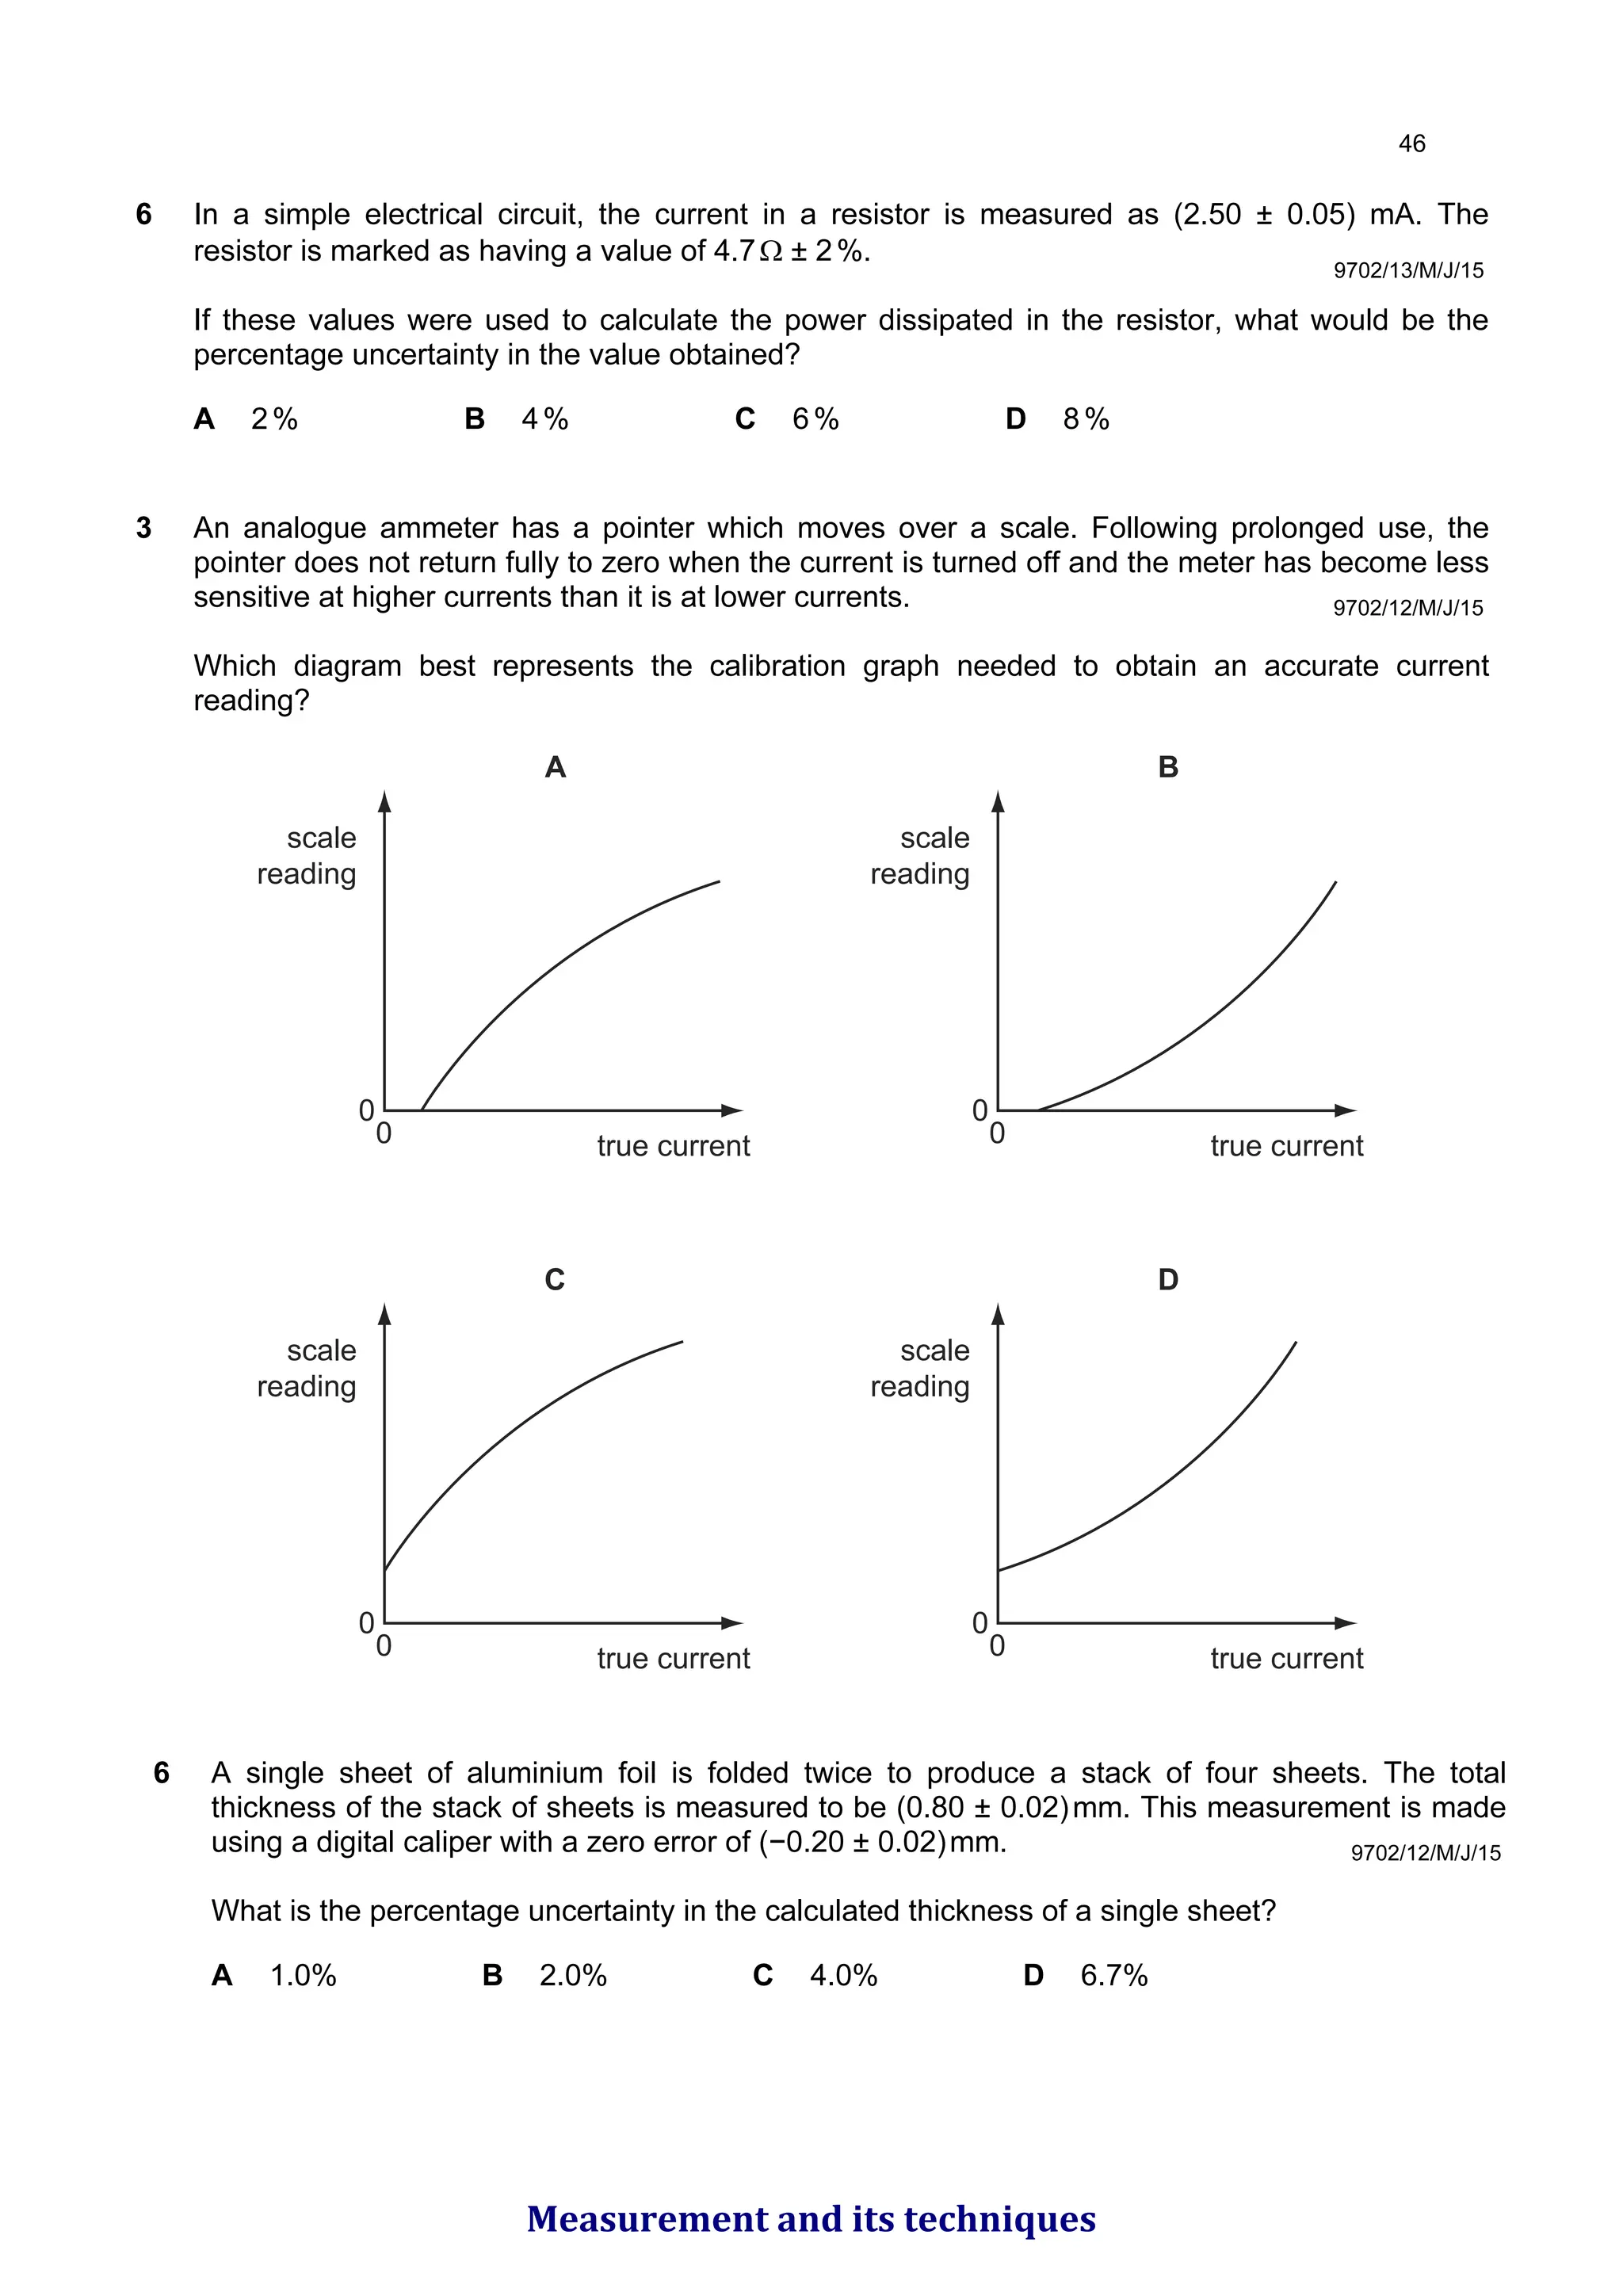
6 In asimple electrical circuit, the current in a resistor is measured as (2.50 ± 0.05) mA. The
resistor is marked as having a value of 4.7Ω ± 2%.
If these values were used to calculate the power dissipated in the resistor, what would be the
percentage uncertainty in the value obtained?
A 2% B 4% C 6% D 8%
9702/13/M/J/15
9702/12/M/J/15
3 An analogue ammeter has a pointer which moves over a scale. Following prolonged use, the
pointer does not return fully to zero when the current is turned off and the meter has become less
sensitive at higher currents than it is at lower currents.
Which diagram best represents the calibration graph needed to obtain an accurate current
reading?
A
scale
reading
true current
0
0
B
scale
reading
true current
0
0
C
scale
reading
true current
0
0
D
scale
reading
true current
0
0
9702/12/M/J/15
6 A single sheet of aluminium foil is folded twice to produce a stack of four sheets. The total
thickness of the stack of sheets is measured to be (0.80 ± 0.02)mm. This measurement is made
using a digital caliper with a zero error of (−0.20 ± 0.02)mm.
What is the percentage uncertainty in the calculated thickness of a single sheet?
A 1.0% B 2.0% C 4.0% D 6.7%
Measurement and its techniques
86.
9702/12/M/J/15
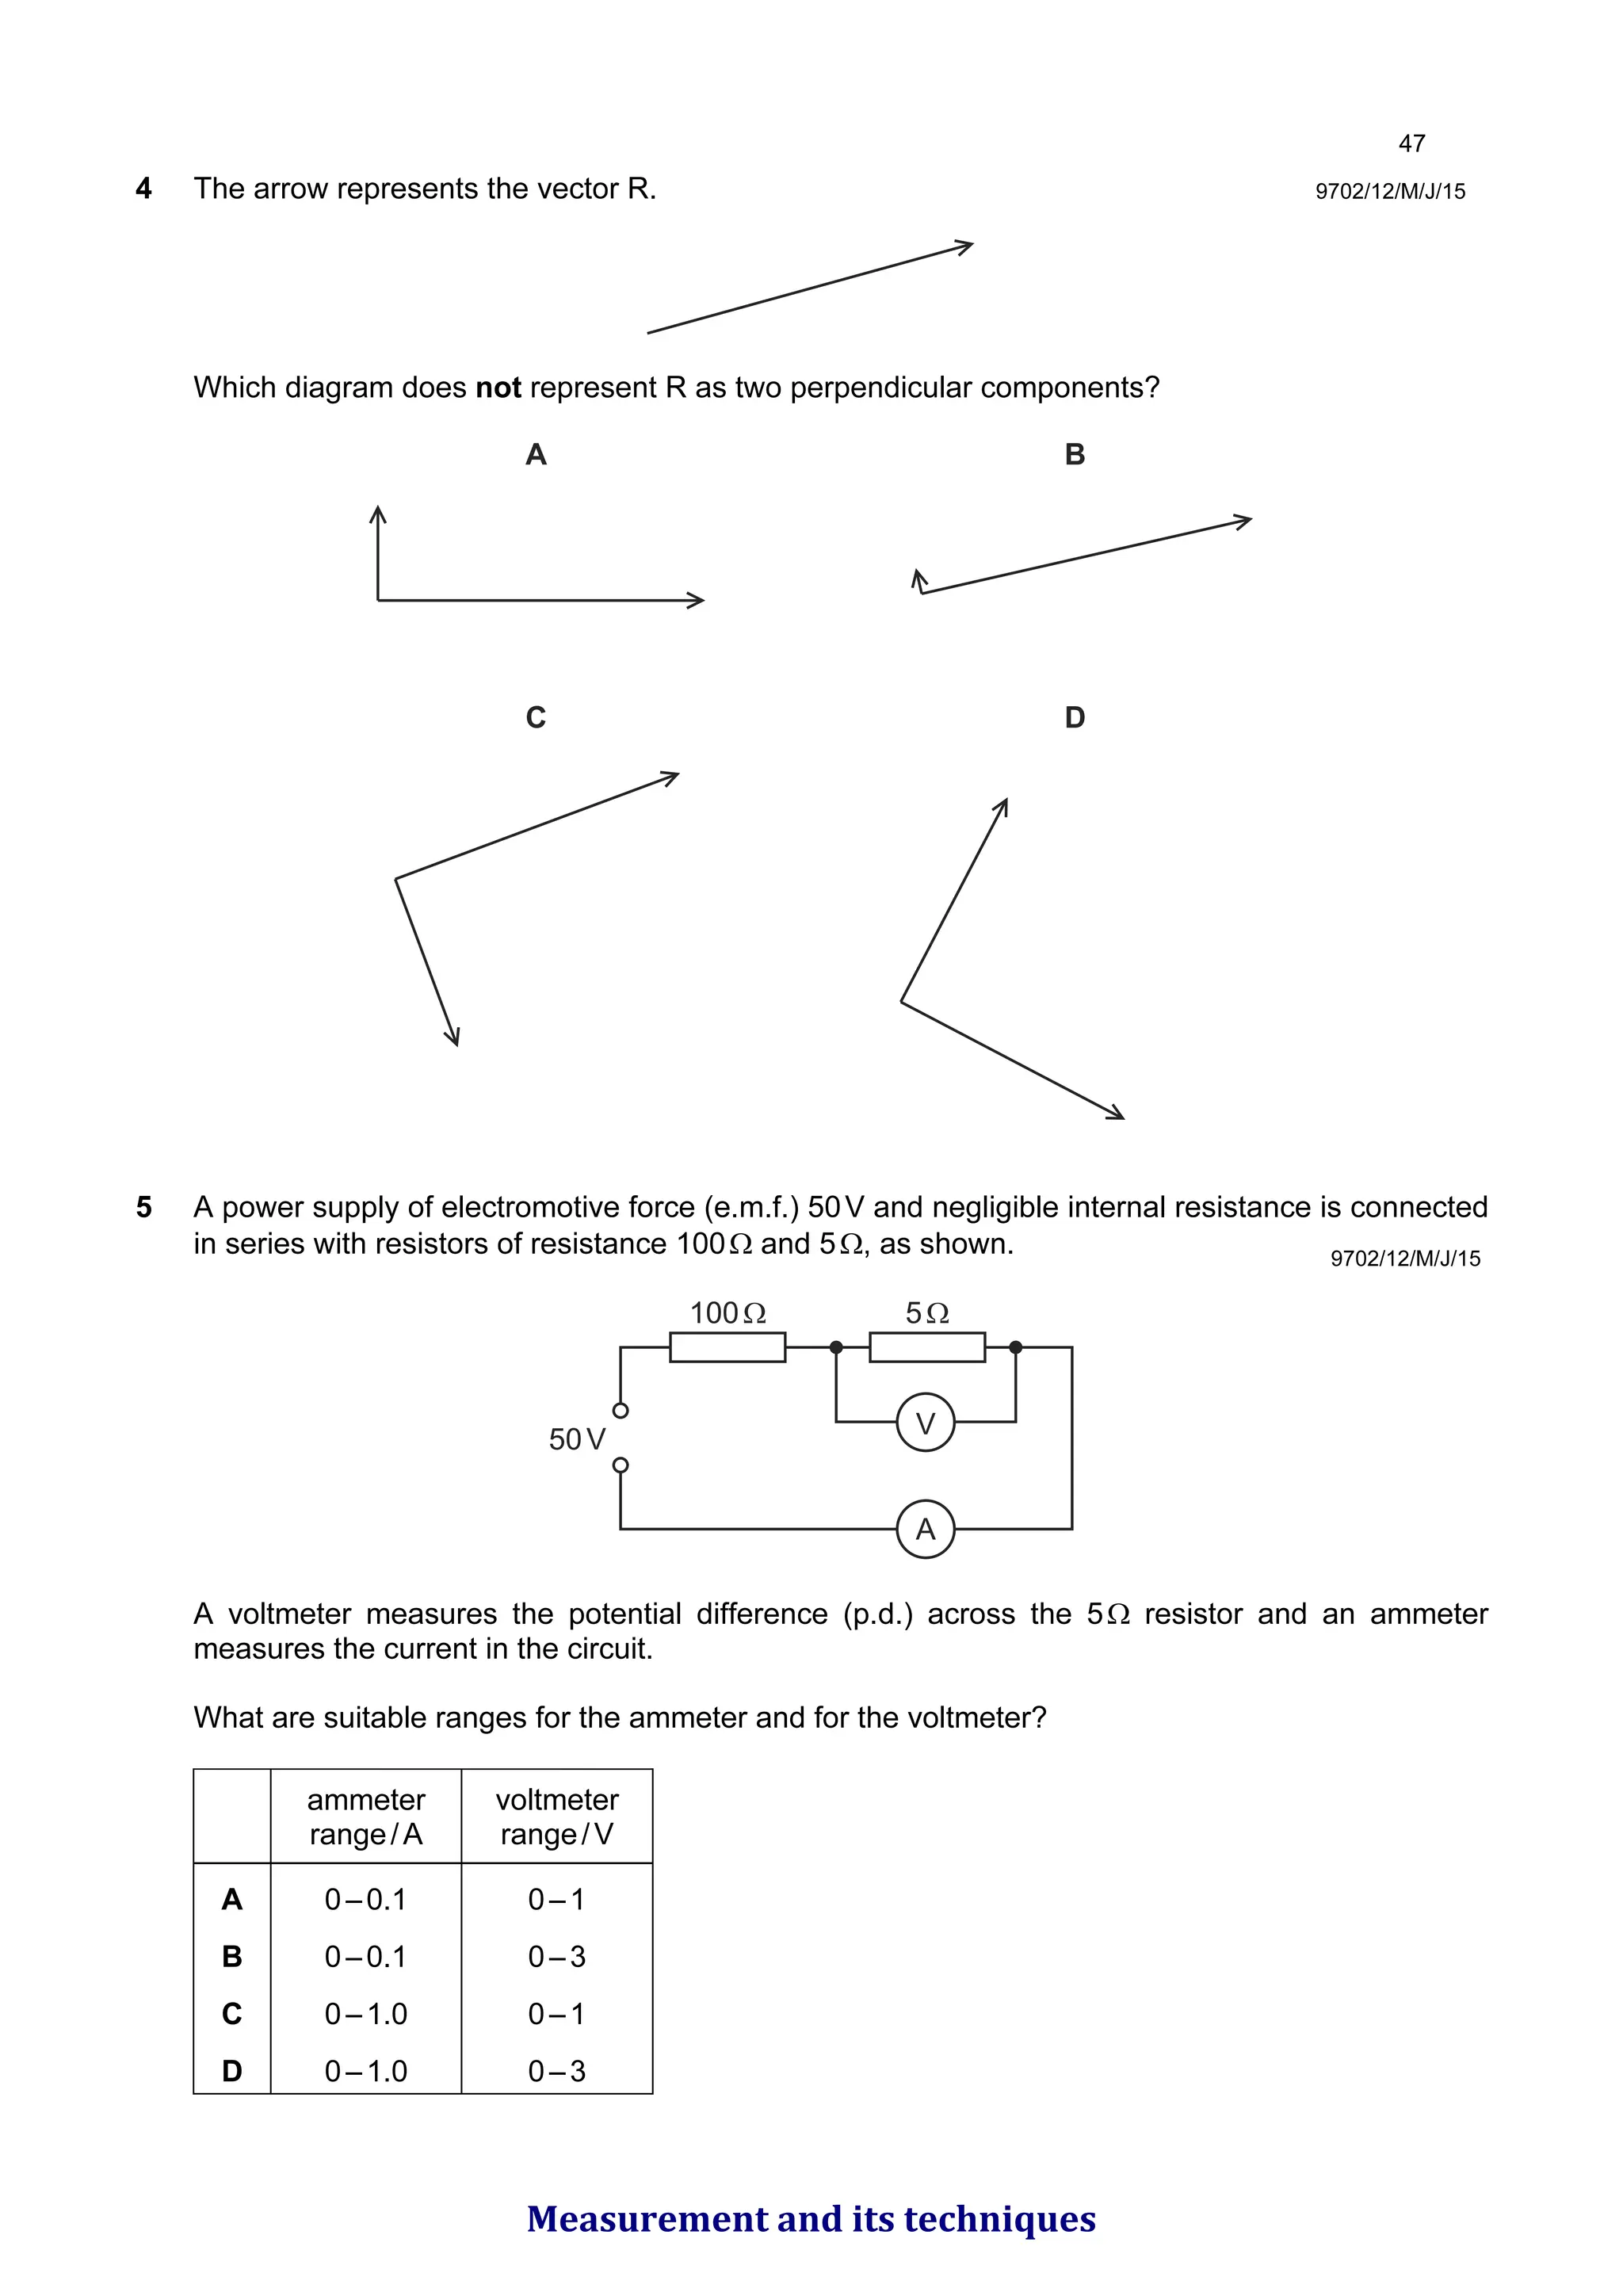
4 The arrowrepresents the vector R.
Which diagram does not represent R as two perpendicular components?
A B
C D
5 A power supply of electromotive force (e.m.f.) 50V and negligible internal resistance is connected
in series with resistors of resistance 100Ω and 5Ω, as shown.
A
V
5Ω
100Ω
50V
A voltmeter measures the potential difference (p.d.) across the 5Ω resistor and an ammeter
measures the current in the circuit.
What are suitable ranges for the ammeter and for the voltmeter?
ammeter
range/A
voltmeter
range/V
A 0–0.1 0–1
B 0–0.1 0–3
C 0–1.0 0–1
D 0–1.0 0–3
9702/12/M/J/15
Measurement and its techniques
87.
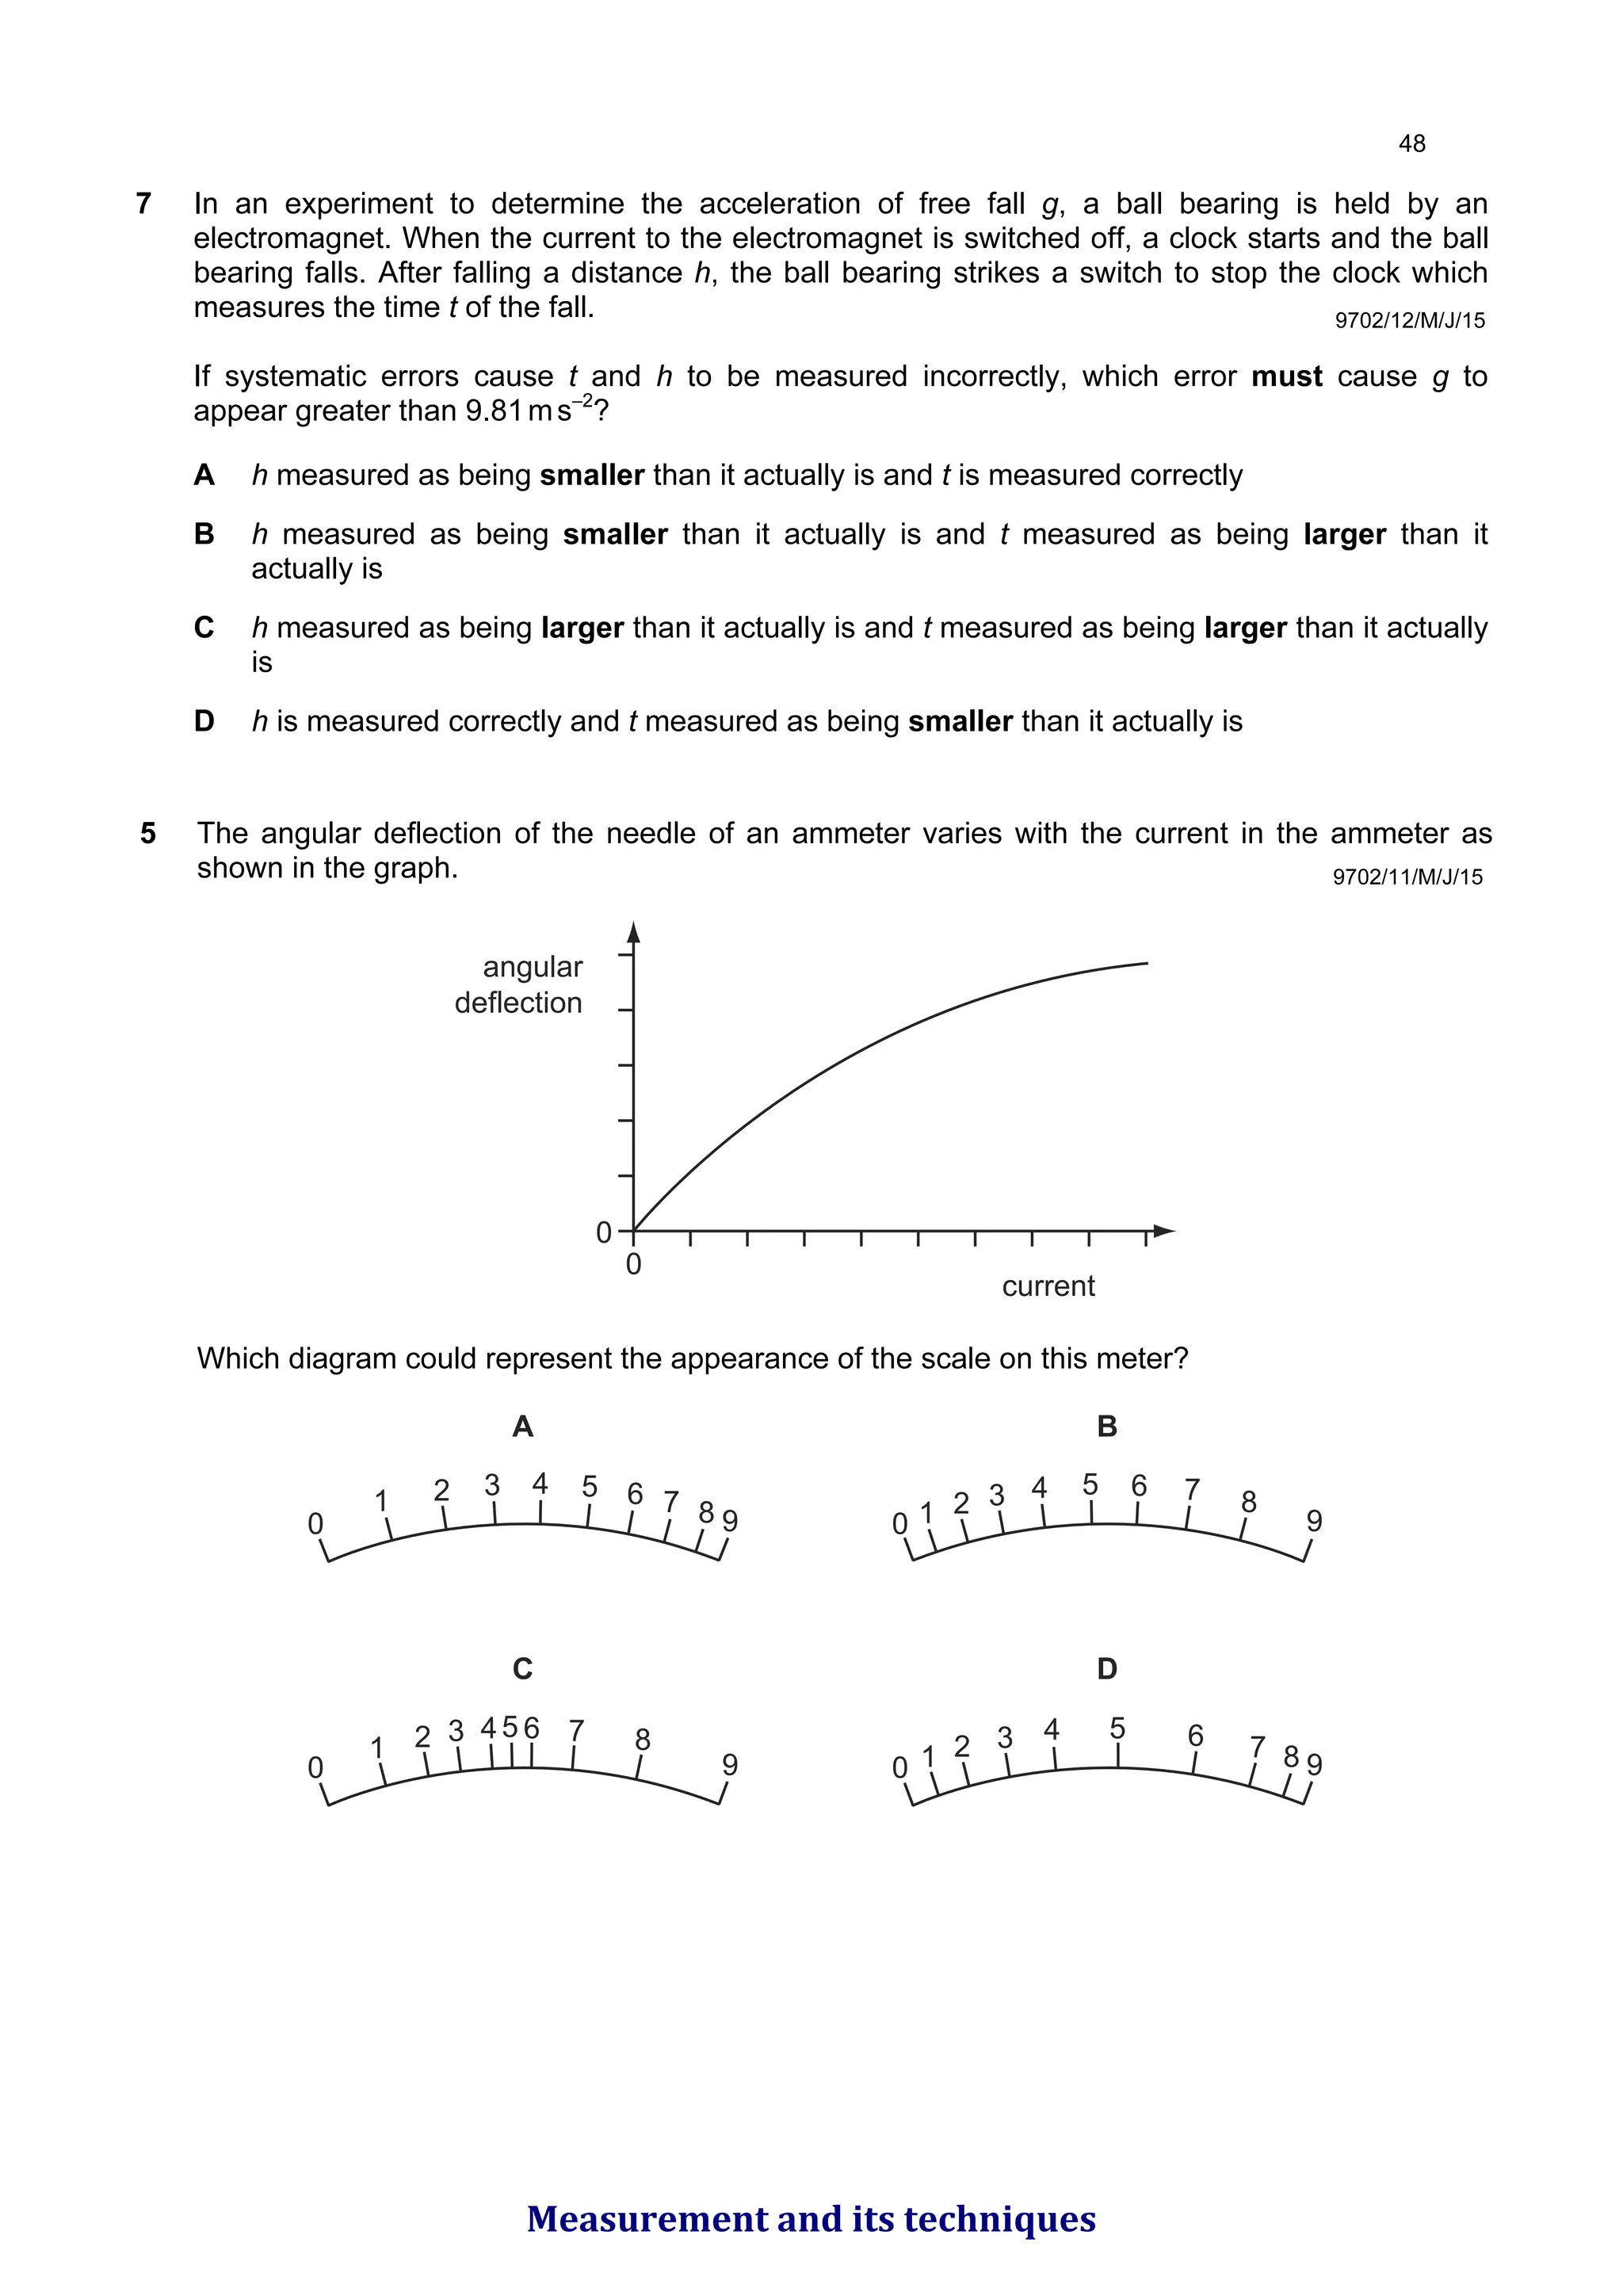
7 In anexperiment to determine the acceleration of free fall g, a ball bearing is held by an
electromagnet. When the current to the electromagnet is switched off, a clock starts and the ball
bearing falls. After falling a distance h, the ball bearing strikes a switch to stop the clock which
measures the time t of the fall.
If systematic errors cause t and h to be measured incorrectly, which error must cause g to
appear greater than 9.81ms–2
?
A h measured as being smaller than it actually is and t is measured correctly
B h measured as being smaller than it actually is and t measured as being larger than it
actually is
C h measured as being larger than it actually is and t measured as being larger than it actually
is
D h is measured correctly and t measured as being smaller than it actually is
9702/12/M/J/15
9702/11/M/J/15
5 The angular deflection of the needle of an ammeter varies with the current in the ammeter as
shown in the graph.
0
0
angular
deflection
current
Which diagram could represent the appearance of the scale on this meter?
A B
C D
0
1 2 3 4 5 6 7 8 9 0 1 2 3 4 5 6 7 8
9
0
1 2 3 45 6 7 8
9 0 1 2 3 4 5 6 7 8 9
Measurement and its techniques
88.
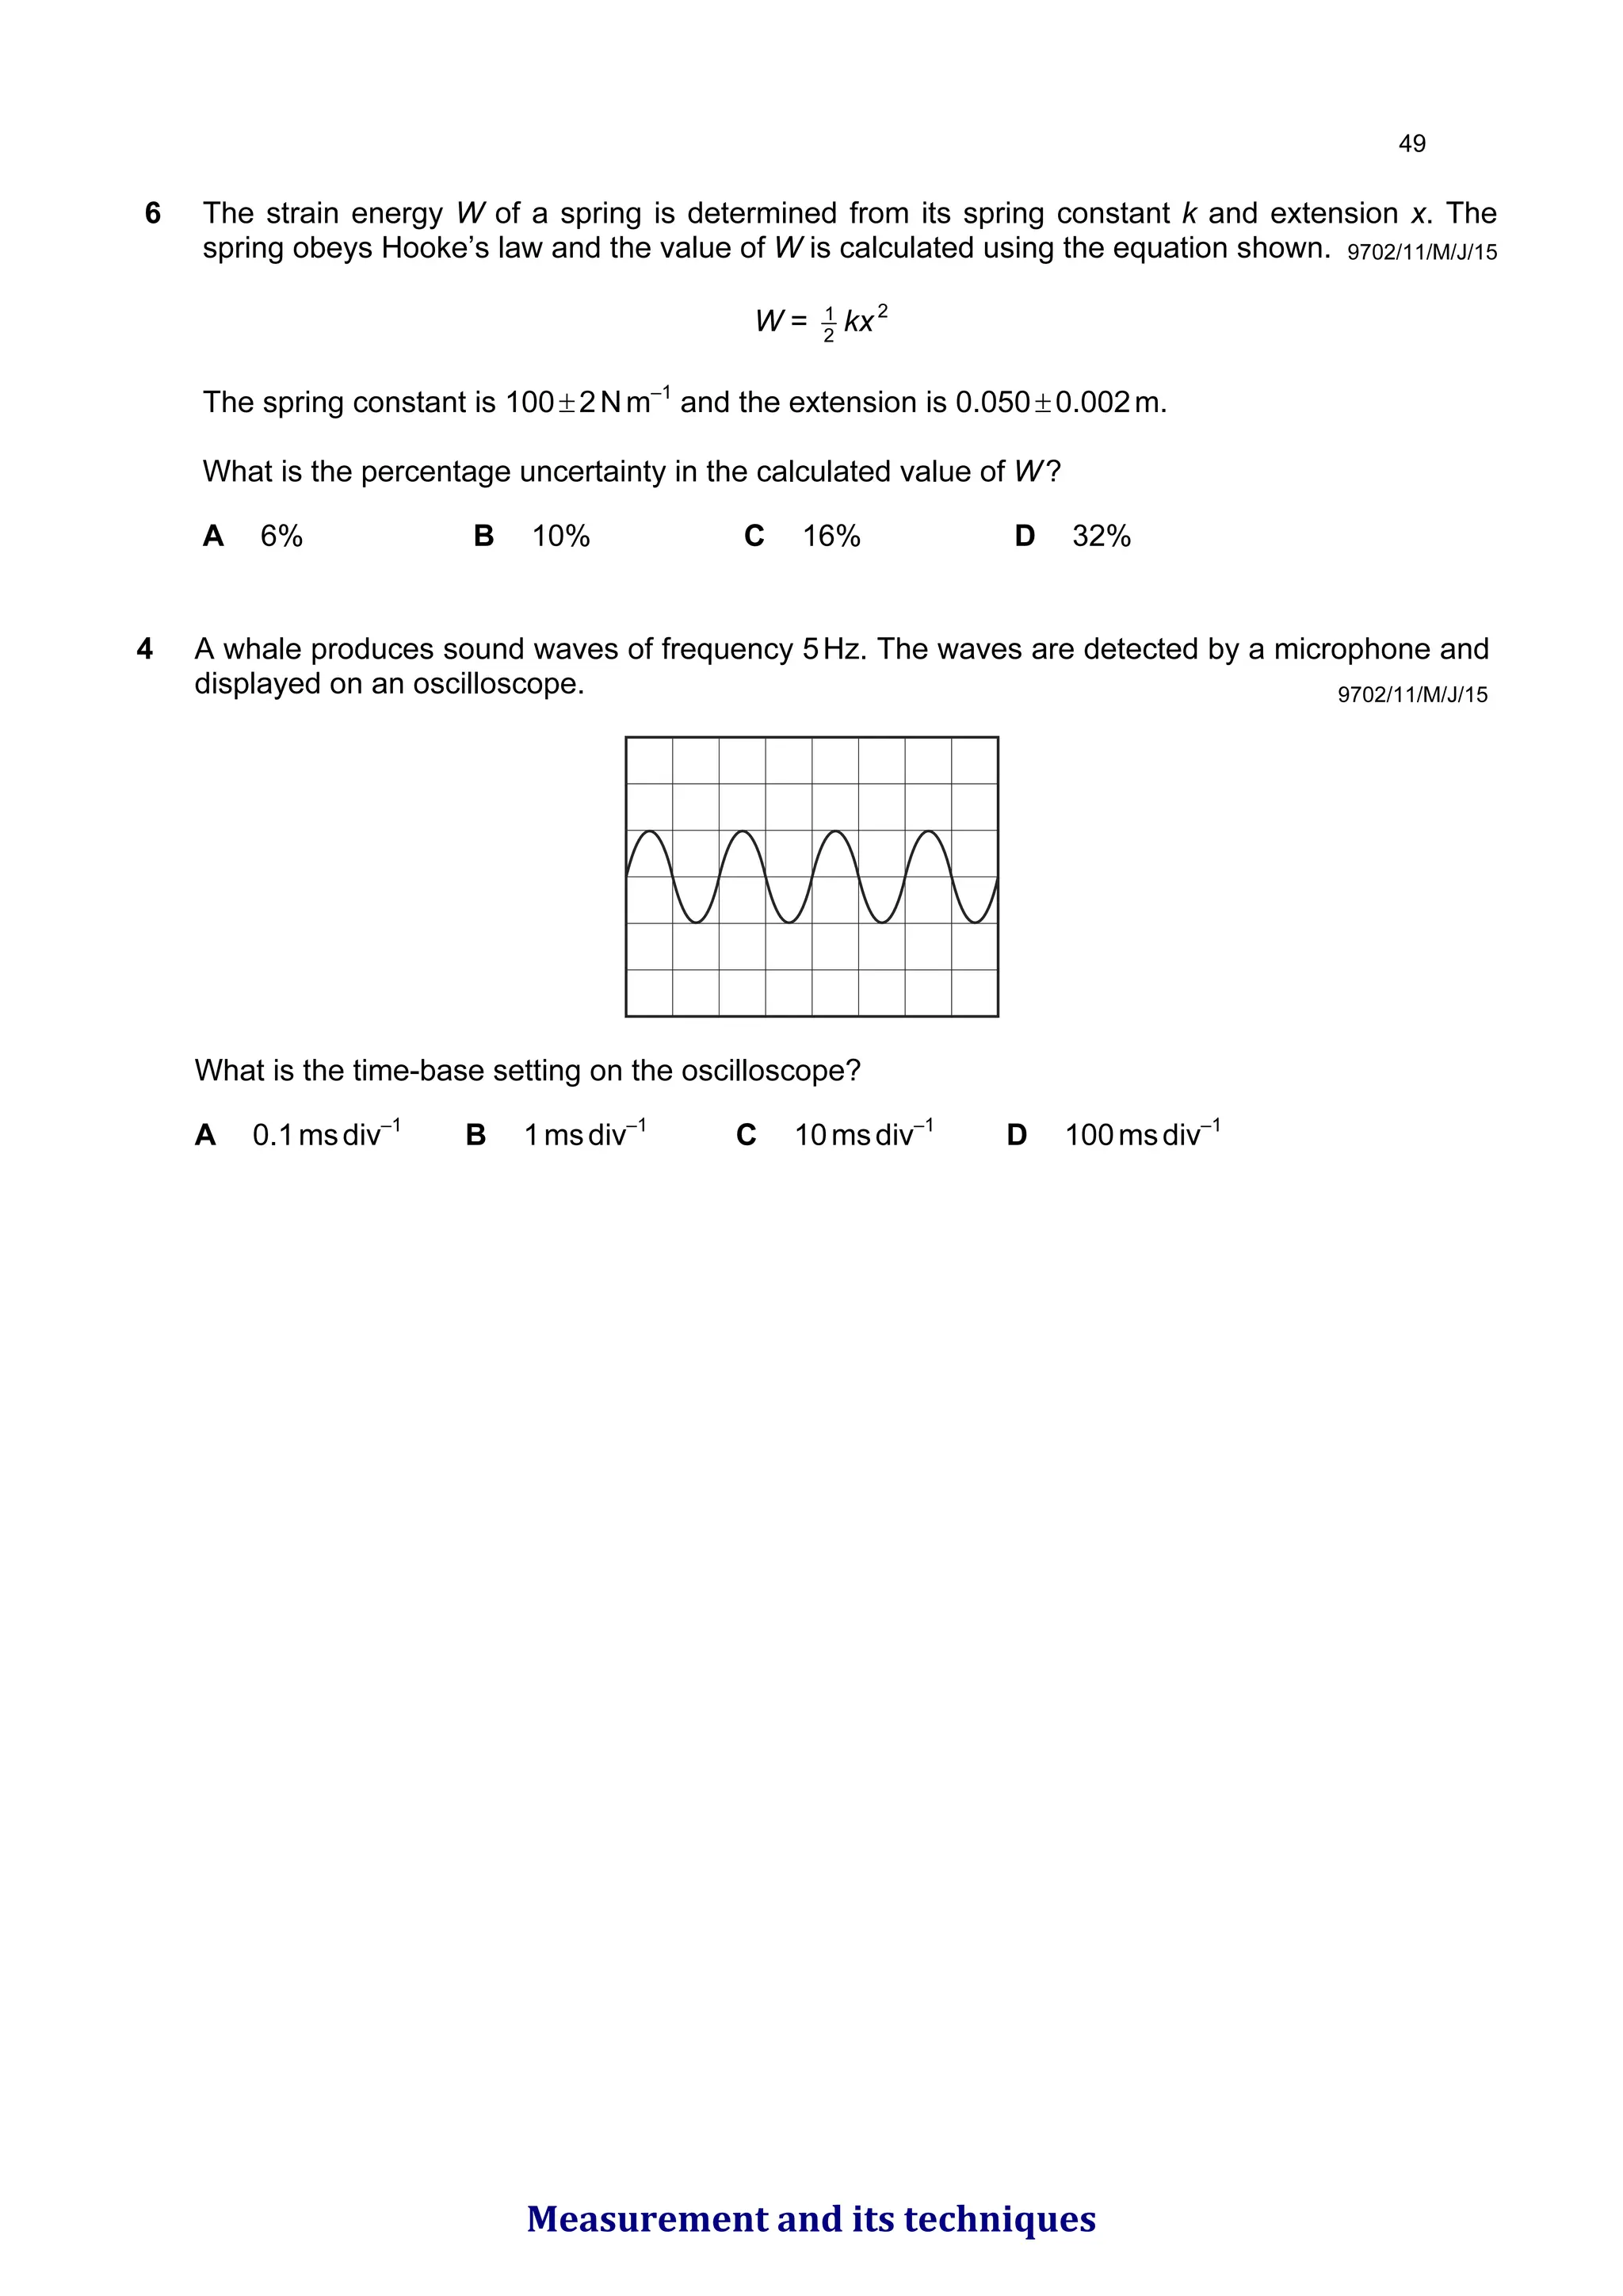
6 The strainenergy W of a spring is determined from its spring constant k and extension x. The
spring obeys Hooke’s law and the value of W is calculated using the equation shown.
W = 2
1
kx2
The spring constant is 100±2Nm–1
and the extension is 0.050±0.002m.
What is the percentage uncertainty in the calculated value of W?
A 6% B 10% C 16% D 32%
9702/11/M/J/15
9702/11/M/J/15
4 A whale produces sound waves of frequency 5Hz. The waves are detected by a microphone and
displayed on an oscilloscope.
What is the time-base setting on the oscilloscope?
A 0.1msdiv–1
B 1msdiv–1
C 10msdiv–1
D 100msdiv–1
Measurement and its techniques


![Checklist for practicals[1]](https://cdn.slidesharecdn.com/ss_thumbnails/checklistforpracticals1-110206102018-phpapp02-thumbnail.jpg?width=640&height=640&fit=bounds)


