Downloaded 18 times


![Jim Raschke, MBA, FHFMA Finance Director MidMichigan Health Services 989.422.2105 [email_address]](https://image.slidesharecdn.com/finance101mpcav2-090612102704-phpapp01/85/CHC-Finance-Finance-101-47-320.jpg)

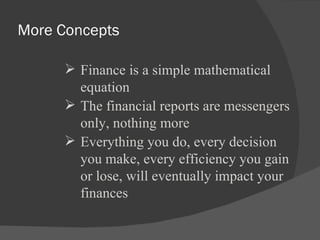
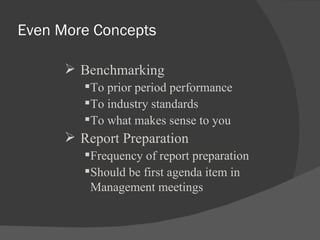
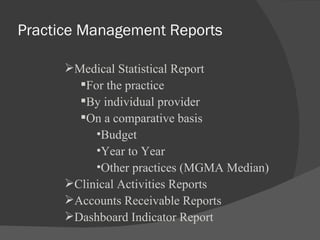
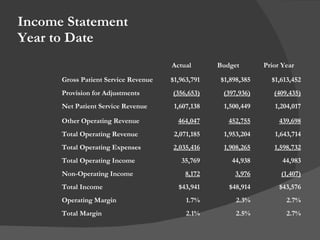
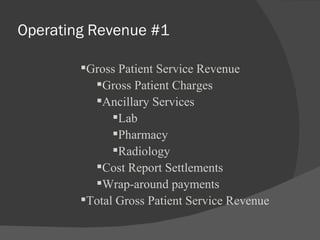
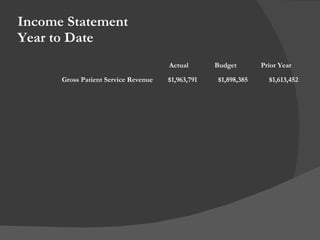
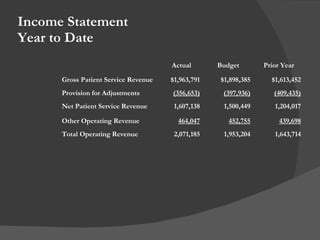
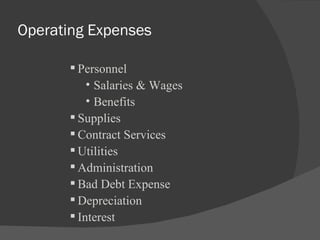
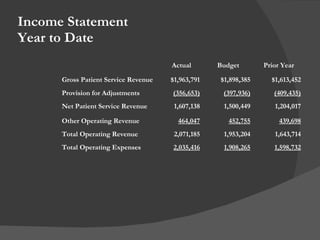
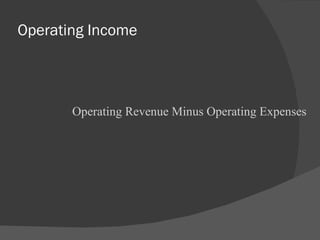
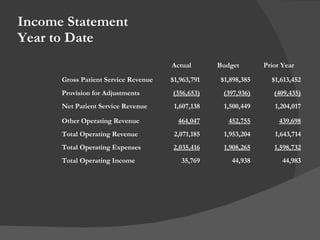
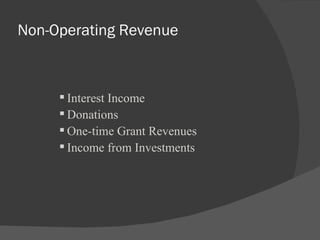
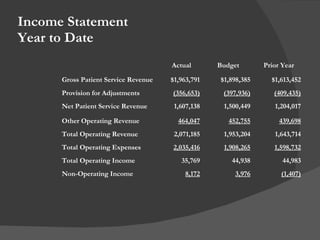
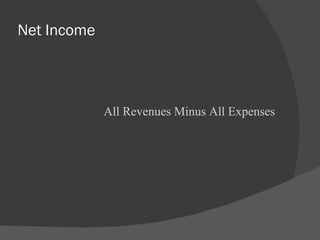
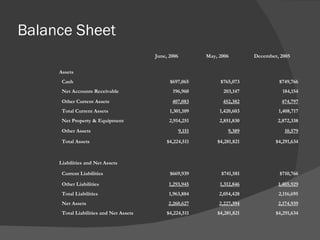
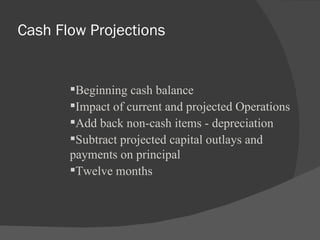
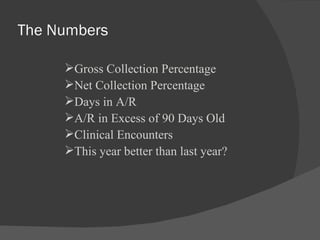
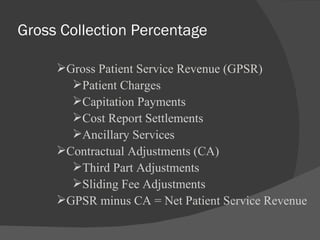
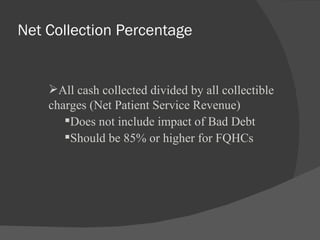
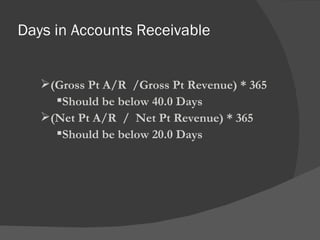
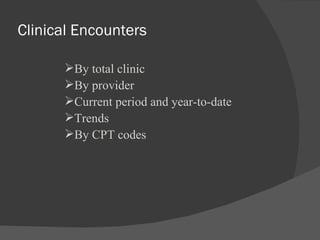
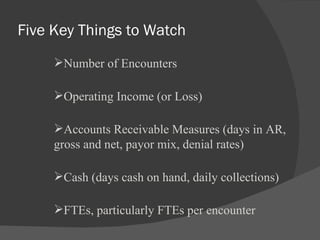
The document provides an overview of key financial concepts and metrics for health centers, including operating revenues, expenses, income statements, balance sheets, cash flow statements, and key performance indicators. It discusses gross patient revenue, contractual adjustments, net patient revenue, operating and non-operating income, operating margins, days in accounts receivable, accounts receivable over 90 days, clinical encounters, and comparing metrics to prior years to measure progress. The presentation aims to make financial statements and metrics clear and help readers understand and monitor organizational performance.


![Awareness of digital currency[1] (1).pptx](https://cdn.slidesharecdn.com/ss_thumbnails/awarenessofdigitalcurrency11-260125155504-b1badee4-thumbnail.jpg?width=640&height=640&fit=bounds)


