Download to read offline


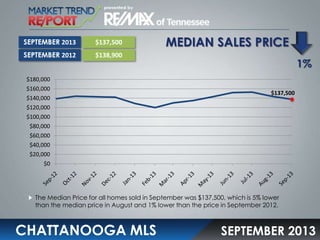
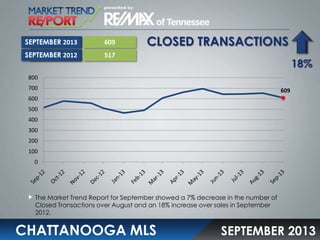

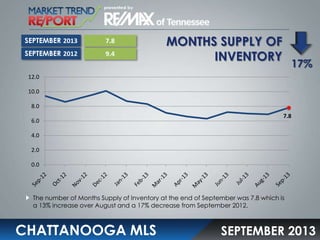

The document summarizes real estate data for Chattanooga, TN for September 2013. It reports that the median home sales price was $137,500, down 1% from September 2012. Closed home sales transactions increased 18% compared to September 2012. The average days on the market was 132 days, up 5 days from September 2012. The months supply of inventory was 7.8 months, down 17% from September 2012.


